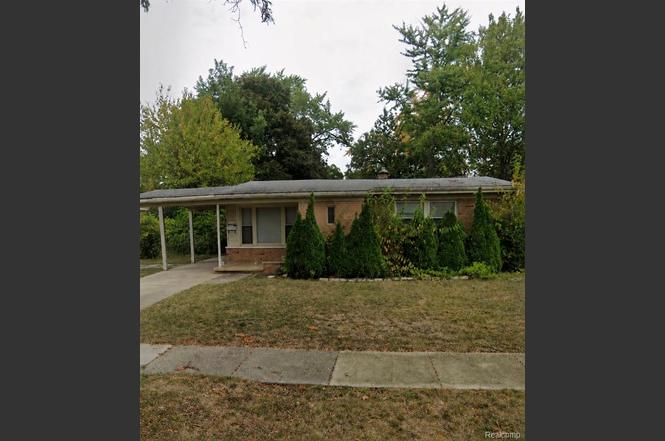
14500 Bishop St · Oak Park, MI
Flood risk 3/10 · Minor
- FEMA flood zone
- X (unshaded)
- Chance of flooding over 30 yrs
- 0.2%
- Est. flood insurance / yr
- $473 – $860
Fire risk 1/10 · Minimal
- Est. fire insurance / yr
- $784 – $1,456
Heat risk 3/10 · Minor
- Hot days now (above 97°F)
- 7 days/yr
- Hot days in 30 yrs
- 15 days/yr
Wind risk 2/10 · Minimal
- Chance of severe wind over 30 yrs
- —
Air-quality risk 4/10 · Minor
- Unhealthy air days now
- 3 days/yr
- Unhealthy air days in 30 yrs
- 6 days/yr
Risk factors via First Street. Map © Google.
Why this score? — see what drove the B- grade
The composite is a weighted blend of 9 inputs, each scored 0–100. Each bar is that input's sub-score; the figure is the points it added to the 100-point composite (weight × sub-score).
- Cash flow +26.4/30.0
- ARV discount +15.0/15.0
- DSCR +9.0/10.0
- 1% rule +8.5/10.0
- Livability +4.2/5.0
- Rent growth +3.2/5.0
- Condition / age +2.5/5.0
- Schools +0.9/10.0
- Appreciation +0.0/10.0
$120,000
🖨 Deal sheet 📄 Offer letter ✓ Due diligence
Listing remarks MLS
3 BED 1 BATH CORNER RANCH IN PAK PARK BATVAI
Key facts
- 6,534 sq ft lot
- Built 1953
Property features AI
Finance
- Other: Subdivision: Edward Rose Greenfield Acres; Directions: Northfield to Marlowe to Bishop
- Financial info: $3,427 annual tax amount
Exterior
- Parking: No garage
- Utilities: Public water; Public sewer
- Home design: Single-family residence; One story; Ground-level entry with steps
- Construction: Brick and vinyl siding exterior
- Exterior features: Paved road access; Lot approximately 0.15 acres (69.7 x 95)
Interior
- Bathrooms: One full bathroom
- Heating & cooling: Forced air heating (natural gas); No central air conditioning
- Interior features: Finished basement; Six total rooms
Neighborhood map
What this means for you Summary
Snapshot
- This is a 3-bed/1.0-bath single-family listed at $120k.
Deal economics
- At list price, monthly cash flow is $314 ($4k/yr) — positive.
- The deal already cash-flows at list — no discount required.
- Meets the 1% rule at list price ($2k rent vs $120k).
- Cap rate 9.4% vs local median 4.9% in Oak Park — top-decile yield for the area; either an underpriced asset or a hidden risk that comps aren't pricing in. Stress-test before assuming the spread holds.
Location & tenants
- Location reads 83/100 on livability (#41 in MI, #888 nationally) — a professional / high-income tenant draw. Strengths: amenities A+, commute A+, cost of living A+; Watch: schools C-, employment D+, crime D.
- Oak Park School District (suburban): math 5% / reading 15% proficiency, ranked #521 of 540 in MI (top 96%) — low school quality limits family demand, transient renter base, plan for 1-2y turnover; 77% free/reduced lunch — lower-income household profile, screen leases tightly.
- Market conditions: Rents rising (+2.7%/yr); 80 active listings in the ZIP; 30 comparable units currently listed for rent nearby; rentals at typical pace (median 22d on market — plan ~3-4 weeks tenant-placement turnaround); 2,614 units permitted in Oakland County in 2024 (721 in 5+ unit buildings).
Forward outlook
- Local home prices are declining (-3.0%/yr); year-one equity from $830 of loan paydown is wiped out by about $4k of value loss. Plan a longer hold.
- Oakland County population projected at +10% by 2050 — modest demand growth; plan on rents tracking national, not racing it.
Negotiation context
- Only 1 days on market — expect competitive offers; lowballing is unlikely to land.
- 7 sale attempts since 20y ago with the ask held roughly flat each time — persistent listings suggest the price (not the market) is what's stuck; bring a comps-based counter.
Risks & watch-outs
- Watch-outs: property tax is 2.9% of price; built in 1953 — expect roof / HVAC / electrical / plumbing capex.
Questions for the listing agent
- Built in 1953 — when were the roof, HVAC, electrical panel, plumbing, and water heater last replaced?
- Property tax is high relative to price — has the assessment been appealed recently, and will the sale trigger a re-assessment?
- Is there a deadline driving the sale (1031 exchange, divorce, estate, relocation)? That informs how much negotiation room exists.
- Crime grade is D in this area — have there been break-ins, vandalism, or insurance claims at this property in the last 3 years? What carrier currently insures it and at what premium?
- What's the average days-on-market for RENTAL listings here right now (not sales)? A rising rental-DOM trend means longer vacancies and softer asking-rent achievability than the comps imply.
- What's the recent tenant-quality profile in this submarket — average credit score on applications, eviction rate, late-payment / NSF rate, and stable-employment percentage? A property-management company in the area should have these aggregated.
- How much new for-sale + rental construction is in the pipeline within 1–3 miles? Heavy new supply typically softens prices + rents 12–24 months out; constrained supply supports both.
Investment metrics
- 1% rule
- 1.35% ✓
- Cap rate
- 9.44%
- Cash-on-cash
- 11.23%
- DSCR
- 1.50
- GRM
- 6.2
CMA / ARV
- ARV (on-the-fly)
- $184,632
- Comps found
- 12
Show comp detail 12 sales within ~0.75 mi
| Address | Dist | Beds/Ba | Sqft | Sold | Price | $/sf | Match |
|---|---|---|---|---|---|---|---|
| 24151 Church St | 0.12mi | 3/1.0 | 1,100 (+0%) | 1mo | $150,000 | $136 | 94 |
| 15211 Joan St | 0.26mi | 3/1.0 | 1,106 (+1%) | 2mo | $125,000 | $113 | 85 |
| 24270 Radclift St | 0.21mi | 3/1.5 | 1,086 (-1%) | 8mo | $188,000 | $173 | 80 |
| 14421 Rosemary Blvd | 0.27mi | 3/1.5 | 1,050 (-4%) | 2mo | $200,000 | $190 | 77 |
| 24310 Kipling St | 0.44mi | 3/1.0 | 1,129 (+3%) | 2mo | $190,000 | $168 | 73 |
| 24670 Gardner St | 0.41mi | 3/1.0 | 1,211 (+10%) | 1mo | $197,000 | $163 | 63 |
| 14221 W 10 Mile Rd | 0.45mi | 3/1.0 | 1,198 (+9%) | 4mo | $190,000 | $159 | 61 |
| 23071 Kenosha St | 0.48mi | 2/1.0 (-1) | 1,021 (-7%) | 5mo | $180,000 | $176 | 56 |
| 22130 Kenosha St S | 0.67mi | 3/1.0 | 1,200 (+9%) | 1mo | $150,000 | $125 | 53 |
| 24700 Westhampton St | 0.59mi | 3/1.0 | 1,200 (+9%) | 6mo | $200,000 | $167 | 52 |
| 23041 Marlow St | 0.51mi | 3/1.5 | 1,250 (+14%) | 7mo | $254,000 | $203 | 45 |
| 22020 Sussex St | 0.71mi | 3/1.5 | 1,203 (+10%) | 7mo | $260,000 | $216 | 44 |
Match score weights: distance 35% · size 25% · config 20% · recency 20%. Top-matched comps best support the ARV.
Projected returns pro-forma
-3.0% appreciation · 2.71% rent growth · sell at horizon
- IRR
- 0.2%
- Equity multiple
- 1.01×
- Total profit
- $212
- Equity at exit
- $17,892
- IRR
- 9.6%
- Equity multiple
- 1.73×
- Total profit
- $24,481
- Equity at exit
- $10,375
Cash invested: $33,600 (down + closing). Projections, not guarantees.
Landlord ↔ Tenant lean methodology
- Overall (STATE)
- 62 Landlord-Friendly
- State Michigan
- 62 Landlord-Friendly · EVEN
- County
- — inherits STATE
- City
- — inherits STATE
ZIP-level market 48237
- Rents YoY
- 2.7%
- Active inventory
- 80
- Price-to-rent
- 6.2×
Monthly cashflow live
- Estimated rent
- $1,619 high interval (Pro) →
- Mortgage (P&I)
- −$629
- Tax from tax record
- −$286 /mo · $3,428/yr
- Insurance
- −$50
- HOA
- −$0
- Vacancy / Maint / Mgmt
- −$340
- Net cashflow
- $314
Break-even live
UW: 25.0% down · 7.5% · 30yr · 1.5% tax · 5.0% vac · 8.0% maint · 8.0% mgmt
Financing live
Cash to close
- Down payment
- $30,000
- Closing costs
- $3,600
- Reserves months
- —
- Total cash needed
- —
Loan-product check · same deal, 3 products live
Conventional
25% down · 7.5% · 30yr
- Down + closing
- —
- Monthly P&I
- —
- Monthly cashflow
- —
- DSCR
- —
- Eligible?
- —
Personal DTI + credit; lowest rate.
DSCR
20% down · 8.5% · 30yr
- Down + closing
- —
- Monthly P&I
- —
- Monthly cashflow
- —
- DSCR
- —
- Eligible?
- —
No personal income docs; deal must DSCR.
Hard money
10% down · 12.0% · 12mo
- Down + closing
- —
- Monthly P&I
- —
- Monthly cashflow
- —
- DSCR
- —
- Eligible?
- —
Short-term bridge; refi at stabilization.
Rent comps 30 comps
| Address | Beds | Baths | Sqft | Rent | $/sqft | DOM | Units | Dist |
|---|---|---|---|---|---|---|---|---|
| 13600 Kenwood St Oak Park, MI | 1.0–2.0 | 1.0 | 770 | $1,649 | $2.14 | 1d | 26 | 0.54mi |
| 25221 W Rue Versailles Dr Oak Park, MI | 1.0–2.0 | 1.0 | 850 | $1,055 | $1.24 | 24d | 1 | 0.63mi |
| 15800 Providence Dr Southfield, MI | 3.0 | 1.0–2.0 | 1140 | $1,895 | $1.66 | 1d | 22 | 0.64mi |
| 14051 W Nine Mile Rd Oak Park, MI | 2.0 | 1.0 | 900 | $1,100 | $1.22 | 24d | 1 | 0.66mi |
| 25337 S Montmartre Ct Unit 2 Oak Park, MI | 2.0 | 1.0 | 981 | $1,200 | $1.22 | 24d | 1 | 0.69mi |
| 25225 Greenfield Rd Southfield, MI | 1.0–2.0 | 1.0 | 705 | $1,133 | $1.61 | 43d | 6 | 0.75mi |
| 23300 Providence Dr Southfield, MI | 2.0–3.0 | 2.0 | 1342 | $1,749 | $1.30 | 1d | 15 | 0.77mi |
| 23600 Lamplighter Dr Southfield, MI | 1.0–2.0 | 1.0–2.0 | 1085 | $1,765 | $1.63 | 2d | 15 | 0.77mi |
| 25500 Greenfield Rd Oak Park, MI | 2.0 | 1.0 | 637 | $1,310 | $2.05 | 1d | 12 | 0.79mi |
| 13710 Balfour St Oak Park, MI | 4.0 | 1.0 | 1152 | $2,450 | $2.13 | 16d | 1 | 0.81mi |
| 25600 Briar Dr Oak Park, MI | 2.0–3.0 | 1.5 | 1235 | $1,935 | $1.57 | 23d | 7 | 0.84mi |
| 15075 Lincoln St Oak Park, MI | 2.0 | 1.0–2.0 | 746 | $1,240 | $1.66 | 2d | 1 | 0.88mi |
| 14801 Lincoln St Oak Park, MI | 2.0 | 1.0–1.5 | 990 | $1,240 | $1.25 | 2d | 1 | 0.89mi |
| 16176 Cumberland Rd Southfield, MI | 2.0–3.0 | 2.0 | 1450 | $1,675 | $1.16 | 43d | 1 | 0.90mi |
| 22108 Dante St #115 Oak Park, MI | 2.0 | 2.0 | 898 | $1,250 | $1.39 | 24d | 1 | 0.96mi |
| 22108 Dante St Oak Park, MI | 2.0 | 1.0 | 898 | $1,250 | $1.39 | 24d | 1 | 0.97mi |
| 22148 Dante St #211 Oak Park, MI | 2.0 | 2.0 | 916 | $1,475 | $1.61 | 17d | 1 | 0.98mi |
| 22148 Dante St #211 Oak Park, MI | 2.0 | 1.0 | 916 | $1,475 | $1.61 | 24d | 1 | 0.98mi |
| 22148 Dante St #212 Oak Park, MI | 2.0 | 2.0 | 916 | $1,475 | $1.61 | 21d | 1 | 0.98mi |
| 16200 W 9 Mile Rd Southfield, MI | 1.0–2.0 | 1.0–2.0 | 971 | $1,700 | $1.75 | 4d | 2 | 0.99mi |
| 16300 W 9 Mile Rd Southfield, MI | 1.0–2.0 | 1.0–2.0 | 950 | $1,350 | $1.42 | 43d | 1 | 1.03mi |
| 21850 Coolidge Hwy #203 Oak Park, MI | 3.0 | 2.0 | 1100 | $1,700 | $1.55 | 4d | 1 | 1.06mi |
| 21880 Coolidge Hwy #203 Oak Park, MI | 2.0 | 1.0 | 938 | $1,300 | $1.39 | 24d | 1 | 1.06mi |
| 21800 Coolidge Hwy Oak Park, MI | 1.0–2.0 | 1.0 | 938 | $1,300 | $1.39 | 24d | 3 | 1.08mi |
| 12800 W 9 Mile Rd Oak Park, MI | 1.0–2.0 | 1.0 | 775 | $1,250 | $1.61 | 24d | 1 | 1.11mi |
| 16500 N Park Dr Southfield, MI | 1.0–3.0 | 1.0–2.5 | 1500 | $2,289 | $1.53 | 1d | 1 | 1.37mi |
| 23511 Majestic St Oak Park, MI | 3.0 | 1.0 | 1100 | $1,750 | $1.59 | 24d | 1 | 1.44mi |
| 15833 W Eleven Mile Rd Southfield, MI | 1.0–2.0 | 1.0 | 905 | $1,424 | $1.57 | 1d | 6 | 1.46mi |
| 10400 Saratoga St Oak Park, MI | 2.0 | 1.0 | 829 | $1,450 | $1.75 | 4d | 1 | 1.46mi |
| 24540 Pinehurst Ave Unit 1 Oak Park, MI | 2.0 | 3.0 | 1272 | $2,500 | $1.97 | 1d | 1 | 1.48mi |
Listing history 2 events
-
2026-06-19remarks 44-char remark
-
2026-06-19$120,000 Active 1 DOM
ⓘ Source: listings_history table (triggers on properties + properties_extension) + one-shot
backfill from property_details.listing_events for pre-trigger history.
Tax reassessment forecast MI · Partial reset (capped growth)
- Current annual tax
- $3,428 · $286/mo
- Projected year-2 tax
- $3,428 · $286/mo
- Expected delta
- $0/yr ($0/mo · 0.0%)
ⓘ Screening estimate from a state-policy table — verify with the county assessor before closing.
Climate risk First Street
- Flood 3/10 Moderate FEMA zone X (unshaded) · 20% chance over 30 yrs
- Wildfire 1/10 Low
- Heat 3/10 Moderate 7 d/yr ≥97°F today · 15 d/yr by 30 yrs out
- Wind 2/10 Low
- Air quality 4/10 Moderate 3 unhealthy d/yr today · 6 by 30 yrs out
Nearby sold comps map
Loading sold comps map…
Walkable amenities ~0.75 mi
Loading nearby amenities…
Taxation est. · year 1
- Rental income
- $19,432
- − Mortgage interest
- −$6,722
- − Property taxes
- −$3,428
- − Insurance
- −$600
- − Repairs & maintenance
- −$1,555
- − Management
- −$1,555
- − Depreciation
- −$3,491
- Taxable income
- $2,082
- Est. tax owed @ 24.0%
- −$500
- After-tax cash flow
- $3,272/yr
For passive investors: Depreciation is non-cash, so a rental often shows a tax loss while cash-flowing — sheltering income. Rental losses are passive: they offset passive income freely, and up to $25,000/yr can offset ordinary (W-2) income if you actively participate and your MAGI is under $100k (phasing out to $0 by $150k); unused losses carry forward. On sale, claimed depreciation is recaptured at up to 25%, and gains may owe capital-gains tax (a 1031 exchange can defer both). Figures are a year-1 estimate at your 24.0% rate — not tax advice; consult a CPA.
Schools (NCES district)
- District
- Oak Park School District
- NCES district ID
- 2626190
- Math proficiency
- 5% ▼ -5.00%
- Reading proficiency
- 15% ▼ -5.00%
- Median HH income
- $46,117
- Composite
- 9.21/100
- National rank
- #9862
- State rank
- #521 of 540 in MI
Livability — Oak Park
- Score
- 83/100
- State rank
- #41
- US rank
- #888
Category grades
Schools grade is shown separately in the Schools card above.
Census & demographics
- Census place
- Oak Park, MI
- County
- Oakland County · 1,009,092 people
- City population
- 29,318
- Metro
- Detroit-Warren-Dearborn, MI
- Population (ZIP)
- 29,318
- Household income
- $71,510
- Rent vs Own
- Severe rent burden
- 960.0
Population outlook (Oakland County) Hauer SSP2
- Today (2025)
- 1,335,747 people
- By 2030
- 1,375,100 · +2.9%
- By 2040
- 1,435,385 · +7.5%
- By 2050
- 1,469,250 · +10.0%
- By 2075
- 1,531,946 · +14.7%
- By 2100
- 1,450,485 · +8.6%
Race, ethnicity, and origin ACS 2023
- Neighborhood character
- Diverse neighborhood (Simpson 0.59)
- Race & ethnicity
- Black 53% White 36% Two or more races 6% Asian 3% Hispanic / Latino 1%
- Common ancestry
- Romanian 4% Scotch-Irish 3% Slovak 1%
- Foreign-born
- 8% · Vietnam, Canada, South Korea
- Languages at home
- 90% English-only · Russian/Polish/Slavic 3% Arabic 1% Vietnamese 1%
Political lean MEDSL · Oakland
- 2024 margin
- D (+10.6) · D 54.4% · R 43.8% · Other 1.9%
- 2008→2024 swing
- -3.9pp toward R · 2008: 14.5pp · 2024: 10.6pp
- All cycles
- 2024: D+10.6 2020: D+14.1 2016: D+8.1 2012: D+8.1 2008: D+14.5
Not yet ingested
- Civics
- —
Market trends
- HPI YoY
- ▼ -336.34%
- Current HPI
- 229.1148
- Rent YoY
- ▲ 2.71%
- Metro
- Detroit-Warren-Dearborn, MI
- State GDP YoY
- ▲ 1.37%
- F500 in state
- 28
Industry mix (Fortune 500 HQ in MI)
| Industry | F500 HQs | Revenue |
|---|---|---|
| Automotive Parts | 3 | $48B |
|
||
| Automotive | 2 | $372B |
|
||
| Chemicals | 1 | $45B |
|
||
| Automotive Retail | 1 | $29B |
|
||
| Healthcare / Medical Devices | 1 | $23B |
|
||
| Automotive Technology | 1 | $20B |
|
||
Price history
+203.8% since first listed20 events — show timeline
- 2026-06-18 Listed $120,000 REALCOMP
- 2026-06-18 Listed $120,000 MiRealSource-MiMLS
- 2016-07-15 Sold (MLS) $105,000 MiRealSource-MiMLS
- 2016-07-15 Sold (MLS) $105,000 REALCOMP
- 2016-07-02 Pending — MiRealSource-MiMLS
- 2016-07-02 Pending — REALCOMP
- 2016-06-25 Listed $105,000 MiRealSource-MiMLS
- 2016-06-25 Listed $105,000 REALCOMP
- 2013-04-23 Sold (MLS) $39,000 MiRealSource-MiMLS
- 2013-04-23 Sold (MLS) $39,000 REALCOMP
- 2013-04-18 Listing Removed — MiRealSource-MiMLS
- 2013-04-18 Listing Removed — REALCOMP
- 2012-11-27 Listed $32,900 MiRealSource-MiMLS
- 2012-11-27 Listed $32,900 REALCOMP
- 2006-08-08 Sold (Public Records) $115,000 Public Records
- 2006-07-21 Sold (MLS) $115,000 REALCOMP
- 2006-06-08 Listed $115,900 REALCOMP
- 2003-10-20 Sold (Public Records) $79,500 Public Records
- 1991-11-14 Sold (Public Records) $42,000 Public Records
- 1989-09-26 Sold (Public Records) $39,500 Public Records
Property tax history
+6.0%/yrLatest (2025): $3,428 · +31.0% YoY. Source: county tax records.
Cash-flow waterfall
monthlySold comps — $/sqft
last 12 mo · ≤1 miLoading sold comps…