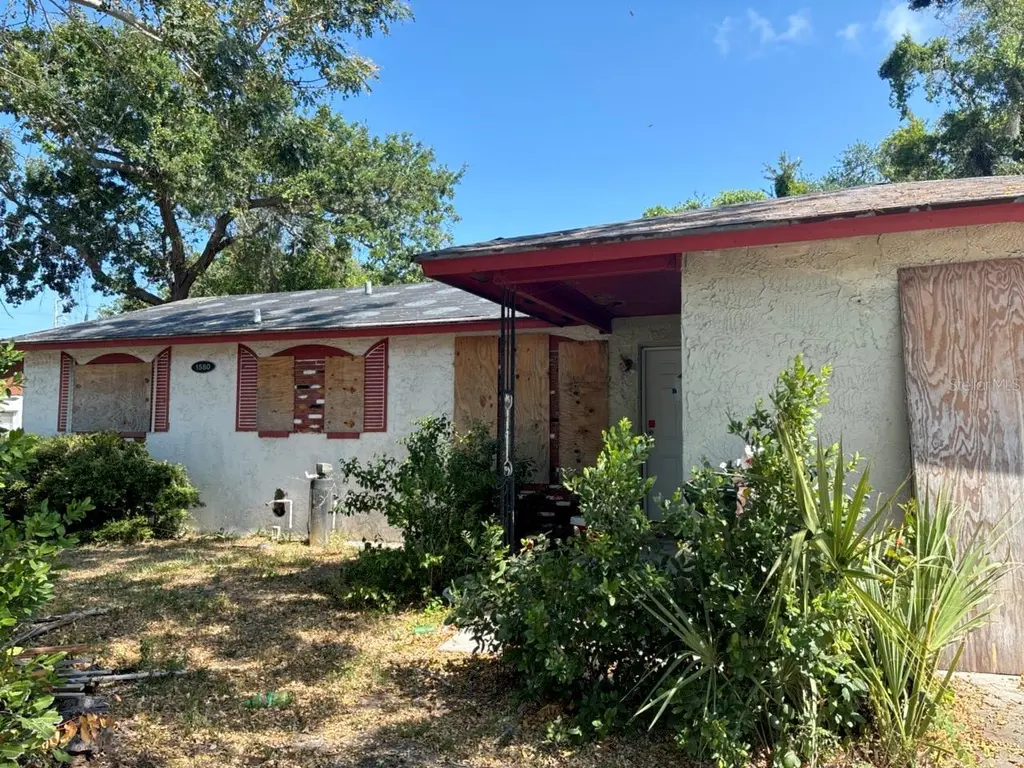
1580 Oak Village Dr · Ridgecrest, FL
Flood risk 1/10 · Minimal
- FEMA flood zone
- X (unshaded)
- Chance of flooding over 30 yrs
- 0.0%
- Est. flood insurance / yr
- $507 – $1,088
Fire risk 1/10 · Minimal
- Est. fire insurance / yr
- $947 – $1,759
Heat risk 10/10 · Severe
- Hot days now (above 107°F)
- 5 days/yr
- Hot days in 30 yrs
- 16 days/yr
Wind risk 10/10 · Severe
- Chance of severe wind over 30 yrs
- 99.0%
Air-quality risk 3/10 · Minor
- Unhealthy air days now
- 2 days/yr
- Unhealthy air days in 30 yrs
- 3 days/yr
Risk factors via First Street. Map © Google.
Why this score? — see what drove the B grade
The composite is a weighted blend of 9 inputs, each scored 0–100. Each bar is that input's sub-score; the figure is the points it added to the 100-point composite (weight × sub-score).
- Cash flow +30.0/30.0
- 1% rule +10.0/10.0
- DSCR +10.0/10.0
- ARV discount +7.5/15.0
- Schools +4.3/10.0
- Livability +3.6/5.0
- Rent growth +2.8/5.0
- Condition / age +2.5/5.0
- Appreciation +0.0/10.0
$154,000
🖨 Deal sheet 📄 Offer letter ✓ Due diligence
Listing remarks
Investor and Renovator Special! Opportunity awaits at 1580 Oak Village Dr! This solid block construction home offers 3 bedrooms, 1.5 bathrooms, and a 1-car garage, making it the perfect project for investors, renovators, or buyers looking to add their personal touch. Situated in a high and dry location, this property is conveniently located directly across from Ridgecrest Elementary School and just minutes from Largo Mall, shopping, dining, and everyday conveniences. Enjoy easy access throughout Pinellas County, making commuting to beaches, parks, and surrounding areas a breeze. With great bones and an unbeatable location, this home is full of potential and ready for its next chapter! This
Key facts
- Conveniently located
- 8,268 sq ft lot
- Garage
Tags
Property features AI
Finance
- Financial info: Lease restrictions apply
Exterior
- Parking: Attached garage (1 space)
- Utilities: Public water; Public sewer; Sewer connected; Utilities available
- Home design: Single family residence; One story; Faces north
- Construction: Block and concrete construction; Shingle roof; Block foundation; Built on a single level
- Exterior features: Sidewalk
Interior
- Kitchen: No appliances included
- Bedrooms: 3 bedrooms
- Flooring: Concrete flooring
- Bathrooms: 1 full bath; 1 half bath
- Heating & cooling: Central heating; Central air conditioning
- Interior features: Living room/dining room combo
- Laundry & utility: Laundry inside
Neighborhood map
What this means for you Summary
Snapshot
- This is a 3-bed/1.5-bath single-family listed at $154k.
Deal economics
- At list price, monthly cash flow is $839 ($10k/yr) — positive.
- The deal already cash-flows at list — no discount required.
- Meets the 1% rule at list price ($2k rent vs $154k).
Location & tenants
- Location reads 72/100 on livability (#323 in FL) — a middle-class / working-renter tenant base. Strengths: crime A+, health & safety A+, commute A-; Watch: schools D-, amenities F, employment F.
- Pinellas (suburban): math 51% / reading 51% proficiency, ranked #31 of 73 in FL (top 42%) — acceptable for families but not a draw, mixed tenant base, ~2y average lease.
- Market conditions: Rents rising (+1.4%/yr); 139 active listings in the ZIP; 40 comparable units currently listed for rent nearby; rentals at typical pace (median 17d on market — plan ~3-4 weeks tenant-placement turnaround); 2,676 units permitted in Pinellas County in 2024 (1,422 in 5+ unit buildings).
- This rent runs 44% of the median local income ($65k/yr) — at the standard rent-burdened threshold; future hikes will face affordability resistance.
Forward outlook
- Local home prices are declining (-3.0%/yr); year-one equity from $1k of loan paydown is wiped out by about $5k of value loss. Plan a longer hold.
- Pinellas County population projected at +14% by 2050 — modest demand growth; plan on rents tracking national, not racing it.
- At projected returns (-3.0% appreciation + 1.4% rent growth), your $43k cash investment doubles in ~6 years — after that, you're playing with house money.
Negotiation context
- Only 12 days on market — expect competitive offers; lowballing is unlikely to land.
Risks & watch-outs
- Climate carrying-cost: severe wind risk, 99% chance of damaging wind over 30y; extreme-heat days projected 5→16/yr by 2055 (HVAC capex compounding) — expect insurance premiums to compound above CPI over the hold.
Questions for the listing agent
- Built in 1972 — when were the roof, HVAC, electrical panel, plumbing, and water heater last replaced?
- Is there a deadline driving the sale (1031 exchange, divorce, estate, relocation)? That informs how much negotiation room exists.
- Schools are D-rated, which usually means shorter tenancies and higher turnover. Who's the typical renter profile here, and what's been the actual vacancy rate?
- What's the average days-on-market for RENTAL listings here right now (not sales)? A rising rental-DOM trend means longer vacancies and softer asking-rent achievability than the comps imply.
- What's the recent tenant-quality profile in this submarket — average credit score on applications, eviction rate, late-payment / NSF rate, and stable-employment percentage? A property-management company in the area should have these aggregated.
- How much new for-sale + rental construction is in the pipeline within 1–3 miles? Heavy new supply typically softens prices + rents 12–24 months out; constrained supply supports both.
Investment metrics
- 1% rule
- 1.56% ✓
- Cap rate
- 12.83%
- Cash-on-cash
- 23.36%
- DSCR
- 2.04
- GRM
- 5.4
CMA / ARV
- ARV (on-the-fly)
- $350,760
- Comps found
- 12
Show comp detail 12 sales within ~0.75 mi
| Address | Dist | Beds/Ba | Sqft | Sold | Price | $/sf | Match |
|---|---|---|---|---|---|---|---|
| 1649 12th St SW | 0.28mi | 3/2.0 | 1,109 (-0%) | 2mo | $350,000 | $316 | 83 |
| 13698 120th St | 0.09mi | 3/2.0 | 1,163 (+5%) | 6mo | $290,000 | $249 | 81 |
| 720 Orangeview Dr | 0.43mi | 3/2.0 | 1,080 (-3%) | 7mo | $325,000 | $301 | 67 |
| 12781 118th St | 0.64mi | 3/1.5 | 1,128 (+2%) | 0mo | $259,900 | $230 | 67 |
| 13248 120th Ln | 0.34mi | 4/2.0 (+1) | 1,100 (-1%) | 10mo | $218,000 | $198 | 67 |
| 917 18th St SW | 0.70mi | 2/2.0 (-1) | 1,095 (-1%) | 2mo | $350,000 | $320 | 57 |
| 2322 Nolan Dr | 0.72mi | 3/2.0 | 1,089 (-2%) | 9mo | $365,000 | $335 | 54 |
| 2733 21st Ave SW | 0.74mi | 3/2.0 | 1,130 (+2%) | 9mo | $395,000 | $350 | 53 |
| 11780 129th Ter | 0.55mi | 3/2.0 | 1,224 (+10%) | 3mo | $375,000 | $306 | 53 |
| 2131 Ridge Rd S #132 | 0.55mi | 2/2.0 (-1) | 995 (-10%) | 1mo | $165,000 | $166 | 49 |
| 2394 19th Ave SW | 0.52mi | 4/2.0 (+1) | 1,186 (+7%) | 13mo | $405,000 | $341 | 47 |
| 918 18th St SW | 0.69mi | 2/1.5 (-1) | 1,013 (-9%) | 6mo | $359,000 | $354 | 44 |
Match score weights: distance 35% · size 25% · config 20% · recency 20%. Top-matched comps best support the ARV.
Projected returns pro-forma
-3.0% appreciation · 1.38% rent growth · sell at horizon
- IRR
- 14.6%
- Equity multiple
- 1.57×
- Total profit
- $24,700
- Equity at exit
- $22,962
- IRR
- 22.1%
- Equity multiple
- 2.74×
- Total profit
- $75,215
- Equity at exit
- $13,315
Cash invested: $43,120 (down + closing). Projections, not guarantees.
Landlord ↔ Tenant lean methodology
- Overall (STATE)
- 87 Strongly Landlord-Friendly
- State Florida
- 87 Strongly Landlord-Friendly · R+3
- County
- — inherits STATE
- City
- — inherits STATE
ZIP-level market 33778
- Rents YoY
- 1.4%
- Active inventory
- 139
- Price-to-rent
- 5.4×
Monthly cashflow live
- Estimated rent
- $2,395 high interval (Pro) →
- Mortgage (P&I)
- −$808
- Tax from tax record
- −$181 /mo · $2,167/yr
- Insurance
- −$64
- HOA
- −$0
- Vacancy / Maint / Mgmt
- −$503
- Net cashflow
- $839
Break-even live
UW: 25.0% down · 7.5% · 30yr · 1.5% tax · 5.0% vac · 8.0% maint · 8.0% mgmt
Financing live
Cash to close
- Down payment
- $38,500
- Closing costs
- $4,620
- Reserves months
- —
- Total cash needed
- —
Loan-product check · same deal, 3 products live
Conventional
25% down · 7.5% · 30yr
- Down + closing
- —
- Monthly P&I
- —
- Monthly cashflow
- —
- DSCR
- —
- Eligible?
- —
Personal DTI + credit; lowest rate.
DSCR
20% down · 8.5% · 30yr
- Down + closing
- —
- Monthly P&I
- —
- Monthly cashflow
- —
- DSCR
- —
- Eligible?
- —
No personal income docs; deal must DSCR.
Hard money
10% down · 12.0% · 12mo
- Down + closing
- —
- Monthly P&I
- —
- Monthly cashflow
- —
- DSCR
- —
- Eligible?
- —
Short-term bridge; refi at stabilization.
Rent comps 40 comps
| Address | Beds | Baths | Sqft | Rent | $/sqft | DOM | Units | Dist |
|---|---|---|---|---|---|---|---|---|
| 1448 Oak St Largo, FL | 2.0 | 2.0 | 1070 | $2,300 | $2.15 | 4d | 1 | 0.18mi |
| 1825 134th Ave Largo, FL | 3.0 | 2.0 | 1005 | $2,200 | $2.19 | 24d | 1 | 0.26mi |
| 11938 133rd Ave Apt 4 Largo, FL | 3.0 | 1.0 | 1200 | $2,150 | $1.79 | 24d | 1 | 0.29mi |
| 11938 133rd Ave Largo, FL | 3.0 | 1.0 | 1200 | $2,150 | $1.79 | 16d | 1 | 0.29mi |
| 11960 133rd Ave Unit 4 Largo, FL | 3.0 | 1.0 | 1200 | $2,150 | $1.79 | 24d | 1 | 0.30mi |
| 11960 133rd Ave Largo, FL | 3.0 | 1.0 | 936 | $2,150 | $2.30 | 7d | 1 | 0.30mi |
| 11980 133rd Ave Largo, FL | 3.0 | 1.0 | 1200 | $2,150 | $1.79 | 16d | 3 | 0.30mi |
| 11980 133rd Ave Apt 4 Largo, FL | 3.0 | 1.0 | 1200 | $2,150 | $1.79 | 24d | 1 | 0.30mi |
| 1767 10th St SW Largo, FL | 4.0 | 2.0 | 1374 | $2,995 | $2.18 | 4d | 1 | 0.32mi |
| 13264 120th Ln Largo, FL | 4.0 | 1.0 | 1050 | $2,700 | $2.57 | 24d | 1 | 0.32mi |
| 13264 120th Ln Largo, FL | 4.0 | 1.0 | 1050 | $2,300 | $2.19 | 7d | 1 | 0.32mi |
| 13250 Ridge Rd Unit 3B1 Largo, FL | 3.0 | 2.0 | 1225 | $1,975 | $1.61 | 17d | 1 | 0.42mi |
| 13001 120th St Largo, FL | 3.0 | 1.0 | 1044 | $1,950 | $1.87 | 7d | 1 | 0.46mi |
| 13333 Ridge Rd Largo, FL | 1.0–2.0 | 1.0–1.5 | 860 | $1,765 | $2.05 | 7d | 1 | 0.49mi |
| 740 16th Ave SW Largo, FL | 4.0 | 2.0 | 1346 | $2,695 | $2.00 | 16d | 1 | 0.50mi |
| 2272 16th Ave SW Unit C Largo, FL | 2.0 | 1.0 | 1031 | $2,600 | $2.52 | 24d | 1 | 0.54mi |
| 1741 Trotter Rd Unit A Largo, FL | 2.0 | 1.0 | 800 | $1,350 | $1.69 | 24d | 1 | 0.56mi |
| 775 Royal Palm Cir Largo, FL | 2.0 | 2.0 | 1008 | $1,700 | $1.69 | 4d | 1 | 0.64mi |
| 11704 127th Ave Largo, FL | 3.0 | 2.0 | 1311 | $2,345 | $1.79 | 4d | 1 | 0.67mi |
| 2131 Ridge Rd S #105 Largo, FL | 2.0 | 1.5 | 1035 | $1,850 | $1.79 | 24d | 1 | 0.70mi |
| 11786 126th Ter Largo, FL | 4.0 | 2.0 | 1242 | $2,650 | $2.13 | 20d | 1 | 0.71mi |
| 2317 13th Ave SW Largo, FL | 3.0 | 1.0 | 1189 | $2,309 | $1.94 | 16d | 1 | 0.71mi |
| 11666 126th Ter Largo, FL | 3.0 | 1.0 | 1056 | $2,183 | $2.07 | 24d | 1 | 0.72mi |
| 667 Sugar Palm St Largo, FL | 2.0 | 2.0 | 1296 | $2,500 | $1.93 | 3d | 1 | 0.74mi |
| 910 9th Ave SW Largo, FL | 3.0 | 2.0 | 1120 | $2,100 | $1.88 | 4d | 1 | 0.79mi |
| 1884 Pine St Largo, FL | 3.0 | 1.5 | 1012 | $2,499 | $2.47 | 21d | 1 | 0.82mi |
| 2098 Seminole Blvd Largo, FL | 1.0–3.0 | 1.0–2.0 | 1018 | $2,895 | $2.84 | 2d | 23 | 0.84mi |
| 2316 Fulton Way Largo, FL | 3.0 | 2.0 | 1209 | $2,699 | $2.23 | 4d | 1 | 0.88mi |
| 310 15th Ave SW Largo, FL | 3.0 | 2.0 | 1284 | $2,800 | $2.18 | 24d | 1 | 0.88mi |
| 3000 Karen Ave Largo, FL | 2.0 | 1.0 | 888 | $2,450 | $2.76 | 21d | 1 | 0.91mi |
| 3000 Karen Ave Largo, FL | 2.0 | 1.0 | 888 | $2,800 | $3.15 | 24d | 1 | 0.91mi |
| 253 Sago Palm St Largo, FL | 2.0 | 2.0 | 1000 | $1,295 | $1.29 | 24d | 1 | 0.91mi |
| 2503 Mary Sue St SW Largo, FL | 3.0 | 2.0 | 1260 | $2,211 | $1.75 | 14d | 1 | 0.91mi |
| 3054 Adrian Ave Largo, FL | 2.0 | 1.0 | 1059 | $3,500 | $3.31 | 4d | 1 | 0.96mi |
| 1830 30th Ln SW Largo, FL | 3.0 | 2.0 | 1400 | $2,725 | $1.95 | 14d | 1 | 0.98mi |
| 1635 Gladys St Unit 2 Largo, FL | 3.0 | 1.0 | 1200 | $2,000 | $1.67 | 16d | 1 | 1.06mi |
| 1635 Gladys St Unit 2 Largo, FL | 3.0 | 1.0 | 1194 | $1,900 | $1.59 | 7d | 1 | 1.06mi |
| 46 Palm Forest Dr Largo, FL | 2.0 | 2.0 | 1296 | $2,200 | $1.70 | 4d | 1 | 1.06mi |
| 11201 122nd Ave Largo, FL | 1.0–2.0 | 1.0–2.0 | 867 | $2,300 | $2.65 | 4d | 2 | 1.08mi |
| 3223 Dryer Ave Largo, FL | 2.0 | 1.0 | 1000 | $1,800 | $1.80 | 24d | 1 | 1.09mi |
Listing history 10 events
-
2026-06-13status $154,000 Pending 12 DOM
-
2026-06-09days on market $154,000 Active 12 DOM
-
2026-06-08days on market $154,000 Active 11 DOM
-
2026-06-07days on market $154,000 Active 10 DOM
-
2026-06-04days on market $154,000 Active 7 DOM
-
2026-06-03days on market $154,000 Active 6 DOM
-
2026-06-02days on market $154,000 Active 5 DOM
-
2026-06-01days on market $154,000 Active 4 DOM
-
2026-05-31days on market $154,000 Active 3 DOM
-
2026-05-28$154,000 Active
ⓘ Source: listings_history table (triggers on properties + properties_extension) + one-shot
backfill from property_details.listing_events for pre-trigger history.
Tax reassessment forecast FL · Resets to sale price
- Current annual tax
- $2,167 · $181/mo
- Projected year-2 tax
- $2,167 · $181/mo
- Expected delta
- $0/yr ($0/mo · 0.0%)
ⓘ Screening estimate from a state-policy table — verify with the county assessor before closing.
Climate risk First Street
- Flood 1/10 Low FEMA zone X (unshaded) · 0% chance over 30 yrs
- Wildfire 1/10 Low
- Heat 10/10 Extreme 5 d/yr ≥107°F today · 16 d/yr by 30 yrs out
- Wind 10/10 Extreme 99% chance of damaging wind over 30 yrs
- Air quality 3/10 Moderate 2 unhealthy d/yr today · 3 by 30 yrs out
Nearby sold comps map
Loading sold comps map…
Walkable amenities ~0.75 mi
Loading nearby amenities…
Taxation est. · year 1
- Rental income
- $28,737
- − Mortgage interest
- −$8,626
- − Property taxes
- −$2,167
- − Insurance
- −$770
- − Repairs & maintenance
- −$2,299
- − Management
- −$2,299
- − Depreciation
- −$4,480
- Taxable income
- $8,095
- Est. tax owed @ 24.0%
- −$1,943
- After-tax cash flow
- $8,131/yr
For passive investors: Depreciation is non-cash, so a rental often shows a tax loss while cash-flowing — sheltering income. Rental losses are passive: they offset passive income freely, and up to $25,000/yr can offset ordinary (W-2) income if you actively participate and your MAGI is under $100k (phasing out to $0 by $150k); unused losses carry forward. On sale, claimed depreciation is recaptured at up to 25%, and gains may owe capital-gains tax (a 1031 exchange can defer both). Figures are a year-1 estimate at your 24.0% rate — not tax advice; consult a CPA.
Schools (NCES district)
- District
- Pinellas
- NCES district ID
- 1201560
- Math proficiency
- 51% ▼ -5.00%
- Reading proficiency
- 51% ▼ -3.00%
- Median HH income
- $46,270
- Composite
- 43.27/100
- National rank
- #3046
- State rank
- #31 of 73 in FL
Livability — Ridgecrest
- Score
- 72/100
- State rank
- #323
- US rank
- #5732
Category grades
Schools grade is shown separately in the Schools card above.
Census & demographics
- Census place
- Ridgecrest, FL
- County
- Pinellas County · 939,478 people
- Metro
- Tampa-St. Petersburg-Clearwater, FL
- Population (ZIP)
- 16,807
- Household income
- $65,355
- Rent vs Own
- Severe rent burden
- 261.0
Population outlook (Pinellas County) Hauer SSP2
- Today (2025)
- 1,027,532 people
- By 2030
- 1,063,586 · +3.5%
- By 2040
- 1,125,020 · +9.5%
- By 2050
- 1,168,637 · +13.7%
- By 2075
- 1,265,188 · +23.1%
- By 2100
- 1,260,357 · +22.7%
Race, ethnicity, and origin ACS 2023
- Neighborhood character
- Predominantly White (72%)
- Race & ethnicity
- White 72% Hispanic / Latino 15% Two or more races 11% Black 9% Asian 2%
- Hispanic origin (detail)
- Puerto Rican 3% Cuban 6%
- Common ancestry
- Romanian 3% Italian 3% Lithuanian 3%
- Foreign-born
- 13% · Canada, Vietnam, Jamaica
- Languages at home
- 85% English-only · Spanish 10% Vietnamese 1% French/Haitian/Cajun 1%
Political lean MEDSL · Pinellas
- 2024 margin
- Lean R (+5.2) · D 46.9% · R 52.1%
- 2008→2024 swing
- -13.5pp toward R · 2008: 8.3pp · 2024: -5.2pp
- All cycles
- 2024: R+5.2 2020: D+0.2 2016: R+1.1 2012: D+5.6 2008: D+8.3
Not yet ingested
- Civics
- —
Market trends
- HPI YoY
- ▼ -320.64%
- Current HPI
- 369.3008
- Rent YoY
- ▲ 1.38%
- Metro
- Tampa-St. Petersburg-Clearwater, FL
- State GDP YoY
- ▲ 3.28%
- F500 in state
- 36
Industry mix (Fortune 500 HQ in FL)
| Industry | F500 HQs | Revenue |
|---|---|---|
| Industrial Technology | 2 | $29B |
|
||
| Insurance | 2 | $17B |
|
||
| Retail | 1 | $60B |
|
||
| Technology Distribution | 1 | $58B |
|
||
| Homebuilding | 1 | $35B |
|
||
| Technology Manufacturing | 1 | $35B |
|
||
Price history
1 event — show timeline
- 2026-05-28 Listed $154,000 Stellar MLS as Distributed by MLS Grid
Property tax history
+5.6%/yrLatest (2025): $2,167 · +311.7% YoY. Source: county tax records.
Cash-flow waterfall
monthlySold comps — $/sqft
last 12 mo · ≤1 miLoading sold comps…