 🏢 Co-op
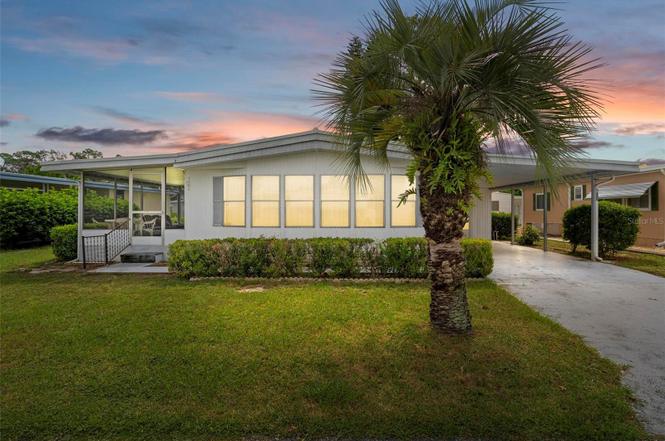
259 Kelou Ct · Leesburg, FL
Flood risk 1/10 · Minimal
- FEMA flood zone
- X (unshaded)
- Chance of flooding over 30 yrs
- 0.0%
- Est. flood insurance / yr
- $507 – $1,088
Fire risk 4/10 · Minor
- Est. fire insurance / yr
- $947 – $1,759
Heat risk 8/10 · Major
- Hot days now (above 107°F)
- 7 days/yr
- Hot days in 30 yrs
- 20 days/yr
Wind risk 9/10 · Severe
- Chance of severe wind over 30 yrs
- 99.0%
Air-quality risk 2/10 · Minimal
- Unhealthy air days now
- 1 days/yr
- Unhealthy air days in 30 yrs
- 1 days/yr
Risk factors via First Street. Map © Google.
Why this score? — see what drove the B- grade
The composite is a weighted blend of 9 inputs, each scored 0–100. Each bar is that input's sub-score; the figure is the points it added to the 100-point composite (weight × sub-score).
- Cash flow +30.0/30.0
- 1% rule +10.0/10.0
- DSCR +10.0/10.0
- ARV discount +7.5/15.0
- Schools +4.2/10.0
- Livability +3.1/5.0
- Rent growth +2.5/5.0
- Condition / age +2.5/5.0
- Appreciation +0.0/10.0
$99,900
🖨 Deal sheet 📄 Offer letter ✓ Due diligence
Listing remarks
MOTIVATED SELLER! Affordable 55+ Living with Co-Op Share – No Lot Rent & Resort-Style Amenities. Enjoy relaxed Florida living in this 2-bedroom, 2-bath single-wide manufactured home located in a golf-cart-friendly 55+ co-op community, where residents own a share of the park and pay no lot rent. Inside, the home offers a bright and functional layout featuring a spacious great room, dedicated dining area, and a fully enclosed side porch that adds valuable extra living space. The washer and dryer are conveniently located inside, and the home comes fully equipped with a refrigerator, stove, microwave, plus an additional under-counter refrigerator—making it truly move-in ready.
Key facts
- Screened side porch
- Nearby shopping
- Nearby restaurants
Tags
Property features AI
Finance
- Other: Lease restrictions apply; Total annual fees reported as $2,520
- HOA & community: HOA present with monthly fee of $210 (association approval required); Senior community; No pets allowed
Exterior
- Parking: Carport with 1 space
- Utilities: Private water; Public sewer; Broadband/high-speed internet available; Cable available and connected; Electricity available; Irrigation equipment
- Home design: Manufactured double-wide home; Single-story; Faces north; Entry level: One
- Construction: Metal and frame construction; Metal roof; Crawlspace foundation; Built on a lot of about 0.12 acre
- Exterior features: Enclosed patio; Side porch; Rain gutters; Sliding doors; Paved lot
Interior
- Kitchen: Range; Refrigerator
- Bedrooms: 2 bedrooms
- Flooring: Laminate
- Bathrooms: 2 full bathrooms
- Heating & cooling: Electric heating; Central air conditioning
- Interior features: Ceiling fans
- Laundry & utility: Washer; Dryer; Laundry located in the kitchen
Neighborhood map
What this means for you Summary
Snapshot
- This is a 3-bed/2.0-bath condo listed at $100k.
Deal economics
- At list price, monthly cash flow is $688 ($8k/yr) — positive.
- The deal already cash-flows at list — no discount required.
- Meets the 1% rule at list price ($2k rent vs $100k).
- Recommended offer: $88k (12.0% below list) — sets the bar for market timing.
- Cap rate 14.6% vs local median 4.5% in Leesburg — top-decile yield for the area; either an underpriced asset or a hidden risk that comps aren't pricing in. Stress-test before assuming the spread holds.
Location & tenants
- Location reads 62/100 on livability (#751 in FL) — a middle-class / working-renter tenant base. Strengths: cost of living A+, housing A+; Watch: schools D+, crime D, amenities F.
- Lake (suburban): math 49% / reading 50% proficiency, ranked #37 of 73 in FL (top 51%) — families likely to look elsewhere, expect single-tenant / working-renter base with shorter leases.
- Market conditions: 285 active listings in the ZIP; 3 comparable units currently listed for rent nearby; rentals at typical pace (median 24d on market — plan ~3-4 weeks tenant-placement turnaround); 4,799 units permitted in Lake County in 2024 (814 in 5+ unit buildings).
- This rent runs 44% of the median local income ($54k/yr) — at the standard rent-burdened threshold; future hikes will face affordability resistance.
Forward outlook
- Local home prices are declining (-3.0%/yr); year-one equity from $691 of loan paydown is wiped out by about $3k of value loss. Plan a longer hold.
- Lake County population projected at +37% by 2050 — long-run rental-demand tailwind backs the buy-and-hold thesis.
- At projected returns (-3.0% appreciation + 3.0% rent growth), your $28k cash investment doubles in ~5 years — after that, you're playing with house money.
Negotiation context
- It's been on market 197 days — a 12% lower offer ($88k) is reasonable based on typical stale-listing flexibility.
- 3 sale attempts since 2y ago; this cycle's ask has dropped $13k (12%) from the opening price — seller is motivated, your offer sets the floor, not the list.
Risks & watch-outs
- Climate carrying-cost: severe wind risk, 99% chance of damaging wind over 30y; extreme-heat days projected 7→20/yr by 2055 (HVAC capex compounding) — expect insurance premiums to compound above CPI over the hold.
Questions for the listing agent
- It's been on market 197 days. Have you received any prior offers? Is the seller open to a 12% concession, seller financing, or rate buy-down credit?
- Built in 1977 — when were the roof, HVAC, electrical panel, plumbing, and water heater last replaced?
- What does the HOA fee cover, when was the last increase, and are there any pending special assessments or reserve-fund shortfalls?
- Any open or pending special assessments — roof, HVAC, plumbing, elevator, façade? What's the per-unit balance and payoff schedule, and is the seller paying it off at close or rolling it to the buyer?
- Why hasn't it sold? Are there any deal-killer items the seller is aware of (foundation, flood, title, zoning, code violations)?
- Is there a deadline driving the sale (1031 exchange, divorce, estate, relocation)? That informs how much negotiation room exists.
- Schools are D-rated, which usually means shorter tenancies and higher turnover. Who's the typical renter profile here, and what's been the actual vacancy rate?
- Crime grade is D in this area — have there been break-ins, vandalism, or insurance claims at this property in the last 3 years? What carrier currently insures it and at what premium?
- What's the average days-on-market for RENTAL listings here right now (not sales)? A rising rental-DOM trend means longer vacancies and softer asking-rent achievability than the comps imply.
- What's the recent tenant-quality profile in this submarket — average credit score on applications, eviction rate, late-payment / NSF rate, and stable-employment percentage? A property-management company in the area should have these aggregated.
- How much new apartment / multifamily construction is in the pipeline within 1–3 miles? Heavy new supply (>2% of stock underway) typically softens rents 12–24 months out; light construction supports rent growth.
Investment metrics
- 1% rule
- 1.97% ✓
- Cap rate
- 14.55%
- Cash-on-cash
- 29.49%
- DSCR
- 2.31
- GRM
- 4.2
CMA / ARV
No comps found within radius.
Projected returns pro-forma
-3.0% appreciation · 3.0% rent growth · sell at horizon
- IRR
- 24.1%
- Equity multiple
- 1.99×
- Total profit
- $27,739
- Equity at exit
- $14,895
- IRR
- 32.0%
- Equity multiple
- 3.90×
- Total profit
- $81,104
- Equity at exit
- $8,638
Cash invested: $27,972 (down + closing). Projections, not guarantees.
Landlord ↔ Tenant lean methodology
- Overall (STATE)
- 87 Strongly Landlord-Friendly
- State Florida
- 87 Strongly Landlord-Friendly · R+3
- County
- — inherits STATE
- City
- — inherits STATE
ZIP-level market 34788
- Home prices YoY
- -18.2%
- Active inventory
- 285
- Price-to-rent
- 4.2×
Monthly cashflow live
- Estimated rent
- $1,970 medium interval (Pro) →
- Mortgage (P&I)
- −$524
- Tax from tax record
- −$93 /mo · $1,115/yr
- Insurance
- −$42
- HOA
- −$210
- Vacancy / Maint / Mgmt
- −$414
- Net cashflow
- $688
Break-even live
UW: 25.0% down · 7.5% · 30yr · 1.5% tax · 5.0% vac · 8.0% maint · 8.0% mgmt
Financing live
Cash to close
- Down payment
- $24,975
- Closing costs
- $2,997
- Reserves months
- —
- Total cash needed
- —
Loan-product check · same deal, 3 products live
Conventional
25% down · 7.5% · 30yr
- Down + closing
- —
- Monthly P&I
- —
- Monthly cashflow
- —
- DSCR
- —
- Eligible?
- —
Personal DTI + credit; lowest rate.
DSCR
20% down · 8.5% · 30yr
- Down + closing
- —
- Monthly P&I
- —
- Monthly cashflow
- —
- DSCR
- —
- Eligible?
- —
No personal income docs; deal must DSCR.
Hard money
10% down · 12.0% · 12mo
- Down + closing
- —
- Monthly P&I
- —
- Monthly cashflow
- —
- DSCR
- —
- Eligible?
- —
Short-term bridge; refi at stabilization.
Rent comps 3 comps
| Address | Beds | Baths | Sqft | Rent | $/sqft | DOM | Units | Dist |
|---|---|---|---|---|---|---|---|---|
| 32818 Lake Square Ct #10 Leesburg, FL | 2.0 | 1.0 | 912 | $1,200 | $1.32 | 23d | 1 | 0.73mi |
| 32635 Vista Ave Leesburg, FL | 3.0 | 2.0 | 1159 | $1,950 | $1.68 | 23d | 1 | 0.81mi |
| 32629 Vista Ave Leesburg, FL | 3.0 | 2.0 | 1500 | $1,850 | $1.23 | 17d | 1 | 0.81mi |
HOA detail condo
- Monthly dues
- $210 · $2,520/yr
- Assessments
- None detected in remarks — confirm with the listing agent.
Listing history 20 events
-
2026-06-18days on market $99,900 Active 197 DOM
-
2026-06-17days on market $99,900 Active 196 DOM
-
2026-06-16days on market $99,900 Active 195 DOM
-
2026-06-15days on market $99,900 Active 194 DOM
-
2026-06-13days on market $99,900 Active 192 DOM
-
2026-06-09days on market $99,900 Active 188 DOM
-
2026-06-08days on market $99,900 Active 187 DOM
-
2026-06-07days on market $99,900 Active 186 DOM
-
2026-06-04days on market $99,900 Active 183 DOM
-
2026-06-03days on market $99,900 Active 182 DOM
-
2026-06-02days on market $99,900 Active 181 DOM
-
2026-06-02days on market $99,900 Active 180 DOM
-
2026-05-31days on market $99,900 Active 179 DOM
-
2026-05-02status Active
-
2026-02-28historical
-
2026-02-17price $99,900
-
2025-10-01$113,000 Active
-
2025-06-30historical
-
2025-04-07price $115,000
-
2024-12-21$125,000 Active
ⓘ Source: listings_history table (triggers on properties + properties_extension) + one-shot
backfill from property_details.listing_events for pre-trigger history.
Tax reassessment forecast FL · Resets to sale price
- Current annual tax
- $1,115 · $93/mo
- Projected year-2 tax
- $1,115 · $93/mo
- Expected delta
- $0/yr ($0/mo · 0.0%)
ⓘ Screening estimate from a state-policy table — verify with the county assessor before closing.
Climate risk First Street
- Flood 1/10 Low FEMA zone X (unshaded) · 0% chance over 30 yrs
- Wildfire 4/10 Moderate
- Heat 8/10 Severe 7 d/yr ≥107°F today · 20 d/yr by 30 yrs out
- Wind 9/10 Extreme 99% chance of damaging wind over 30 yrs
- Air quality 2/10 Low 1 unhealthy d/yr today · 1 by 30 yrs out
Nearby sold comps map
Loading sold comps map…
Walkable amenities ~0.75 mi
Loading nearby amenities…
Taxation est. · year 1
- Rental income
- $23,634
- − Mortgage interest
- −$5,596
- − Property taxes
- −$1,115
- − Insurance
- −$500
- − Repairs & maintenance
- −$1,891
- − Management
- −$1,891
- − HOA
- −$2,520
- − Depreciation
- −$2,906
- Taxable income
- $7,216
- Est. tax owed @ 24.0%
- −$1,732
- After-tax cash flow
- $6,518/yr
For passive investors: Depreciation is non-cash, so a rental often shows a tax loss while cash-flowing — sheltering income. Rental losses are passive: they offset passive income freely, and up to $25,000/yr can offset ordinary (W-2) income if you actively participate and your MAGI is under $100k (phasing out to $0 by $150k); unused losses carry forward. On sale, claimed depreciation is recaptured at up to 25%, and gains may owe capital-gains tax (a 1031 exchange can defer both). Figures are a year-1 estimate at your 24.0% rate — not tax advice; consult a CPA.
Schools (NCES district)
- District
- Lake
- NCES district ID
- 1201050
- Math proficiency
- 49% ▼ -7.00%
- Reading proficiency
- 50% ▼ -4.00%
- Median HH income
- $46,632
- Composite
- 42.05/100
- National rank
- #3327
- State rank
- #37 of 73 in FL
Livability — Leesburg
- Score
- 62/100
- State rank
- #751
- US rank
- #16429
Category grades
Schools grade is shown separately in the Schools card above.
Census & demographics
- County
- Lake County · 364,602 people
- City population
- 70,232
- Metro
- Orlando-Kissimmee-Sanford, FL
- Population (ZIP)
- 22,137
- Household income
- $54,147
- Rent vs Own
- Severe rent burden
- 406.0
Population outlook (Lake County) Hauer SSP2
- Today (2025)
- 386,640 people
- By 2030
- 417,107 · +7.9%
- By 2040
- 476,676 · +23.3%
- By 2050
- 531,296 · +37.4%
- By 2075
- 648,303 · +67.7%
- By 2100
- 698,530 · +80.7%
Race, ethnicity, and origin ACS 2023
- Neighborhood character
- Predominantly White (79%)
- Race & ethnicity
- White 79% Hispanic / Latino 12% Two or more races 7% Black 5% Asian 1%
- Hispanic origin (detail)
- Mexican 3% Puerto Rican 6%
- Common ancestry
- Romanian 4% Lithuanian 3% Slovak 2%
- Foreign-born
- 5% · Canada, South Korea
- Languages at home
- 88% English-only · Spanish 9% German/W. Germanic 1% Tagalog/Filipino 1%
Political lean MEDSL · Lake
- 2024 margin
- Strong R (+24.7) · D 37.3% · R 62.0%
- 2008→2024 swing
- -11.2pp toward R · 2008: -13.5pp · 2024: -24.7pp
- All cycles
- 2024: R+24.7 2020: R+20.0 2016: R+23.1 2012: R+17.1 2008: R+13.5
Not yet ingested
- Civics
- —
Market trends
- HPI YoY
- ▼ -61.07%
- Current HPI
- 273.6616
- Rent YoY
- —
- Metro
- Orlando-Kissimmee-Sanford, FL
- State GDP YoY
- ▲ 3.28%
- F500 in state
- 36
Industry mix (Fortune 500 HQ in FL)
| Industry | F500 HQs | Revenue |
|---|---|---|
| Industrial Technology | 2 | $29B |
|
||
| Insurance | 2 | $17B |
|
||
| Retail | 1 | $60B |
|
||
| Technology Distribution | 1 | $58B |
|
||
| Homebuilding | 1 | $35B |
|
||
| Technology Manufacturing | 1 | $35B |
|
||
Price history
-20.1% since first listed7 events — show timeline
- 2026-05-02 Relisted — Stellar MLS as Distributed by MLS Grid
- 2026-02-28 Listing Removed — Stellar MLS as Distributed by MLS Grid
- 2026-02-17 Price Changed $99,900 Stellar MLS as Distributed by MLS Grid
- 2025-10-01 Listed $113,000 Stellar MLS as Distributed by MLS Grid
- 2025-06-30 Listing Removed — Stellar MLS as Distributed by MLS Grid
- 2025-04-07 Price Changed $115,000 Stellar MLS as Distributed by MLS Grid
- 2024-12-21 Listed $125,000 Stellar MLS as Distributed by MLS Grid
Property tax history
+6.6%/yrLatest (2025): $1,115 · +2.8% YoY. Source: county tax records.
Cash-flow waterfall
monthlySold comps — $/sqft
last 12 mo · ≤1 miLoading sold comps…