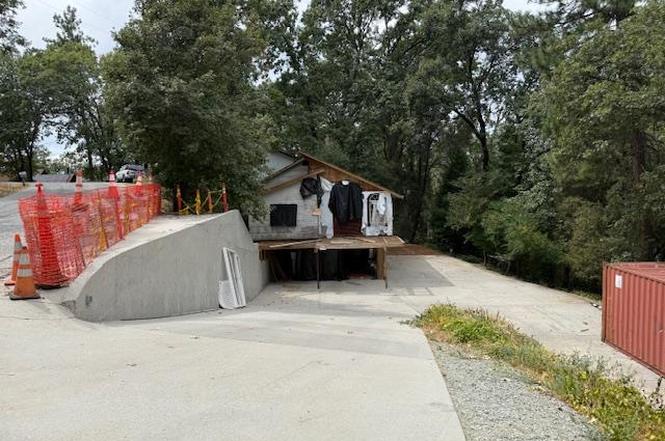
16069 Shannon Way · Grass Valley, CA
Flood risk 1/10 · Minimal
- FEMA flood zone
- X (unshaded)
- Chance of flooding over 30 yrs
- 0.0%
- Est. flood insurance / yr
- $507 – $1,088
Fire risk 9/10 · Severe
- Est. fire insurance / yr
- $659 – $1,223
Heat risk 5/10 · Moderate
- Hot days now (above 96°F)
- 7 days/yr
- Hot days in 30 yrs
- 15 days/yr
Wind risk 1/10 · Minimal
- Chance of severe wind over 30 yrs
- —
Air-quality risk 10/10 · Severe
- Unhealthy air days now
- 33 days/yr
- Unhealthy air days in 30 yrs
- 40 days/yr
Risk factors via First Street. Map © Google.
Why this score? — see what drove the B grade
The composite is a weighted blend of 9 inputs, each scored 0–100. Each bar is that input's sub-score; the figure is the points it added to the 100-point composite (weight × sub-score).
- Cash flow +28.2/30.0
- ARV discount +15.0/15.0
- DSCR +10.0/10.0
- 1% rule +6.8/10.0
- Schools +3.8/10.0
- Livability +3.7/5.0
- Rent growth +2.5/5.0
- Condition / age +2.5/5.0
- Appreciation +0.0/10.0
$210,000
🖨 Deal sheet 📄 Offer letter ✓ Due diligence
Listing remarks
Home is a fixer and requires Court Approval. Enter at your own risk.
Key facts
- 0.41 acre lot
- 2 garage spots
- Listed 75 days
Property features AI
Finance
- Other: Property located in Echo Ridge Trail subdivision, Nevada City, CA (16069 Shannon Way)
- HOA & community: No homeowners association; Not a senior community
Exterior
- Parking: Covered, enclosed garage with interior access and garage facing side; 2-car garage; Guest parking available; Paved driveway with varying slope (downslope and upslope)
- Utilities: Internet available; Electric: 220 volts (see remarks/other); Sewer: septic system; Water: meter on site, water district service, and well; Irrigation: see remarks
- Home design: Single family residence (custom/semi-custom, ranchette/country style); Fixer condition
- Construction: Composition roof (see remarks)
- Exterior features: Flag lot; No fencing; No private pool or spa
Interior
- Kitchen: Kitchen and family room combo; Dining space in kitchen
- Bedrooms: 4 bedrooms total; Master bedroom with closet and walk-in closet
- Flooring: Flooring: see remarks
- Bathrooms: 3 full bathrooms
- Heating & cooling: Cooling: see remarks/other; Heating: none listed (see remarks)
- Interior features: Two-story layout; Kitchen open to family room; Family room with attached deck and views; Dining area open to family room and kitchen; Main level includes living room, dining room, family room, kitchen, master bedroom, full bath and street entrance; Lower level includes bedroom(s) and garage
- Laundry & utility: Laundry features: see remarks
Neighborhood map
What this means for you Summary
Snapshot
- This is a 4-bed/3.0-bath single-family listed at $210k.
Deal economics
- At list price, monthly cash flow is $669 ($8k/yr) — positive.
- The deal already cash-flows at list — no discount required.
- Meets the 1% rule at list price ($2k rent vs $210k).
- Recommended offer: $197k (6.0% below list) — sets the bar for market timing.
- Cap rate 10.1% vs local median 2.0% in Grass Valley — top-decile yield for the area; either an underpriced asset or a hidden risk that comps aren't pricing in. Stress-test before assuming the spread holds.
Location & tenants
- Location reads 74/100 on livability (#134 in CA, #4,710 nationally) — a middle-class / working-renter tenant base. Strengths: amenities A+, commute A+, health & safety A+; Watch: employment D+, crime F, cost of living F.
- Nevada Joint Union High (town): math 25% / reading 61% proficiency, ranked #201 of 517 in CA (top 39%) — families likely to look elsewhere, expect single-tenant / working-renter base with shorter leases.
- Market conditions: 269 active listings in the ZIP; 1 comparable units currently listed for rent nearby; solid renter incomes; 215 units permitted in Nevada County in 2024 (0 in 5+ unit buildings).
- This rent runs 34% of the median local income ($87k/yr) — at the standard rent-burdened threshold; future hikes will face affordability resistance.
Forward outlook
- Local home prices are declining (-3.0%/yr); year-one equity from $1k of loan paydown is wiped out by about $6k of value loss. Plan a longer hold.
- Nevada County population projected at -14% by 2050 — secular population decline; favor cash flow + early exit over multi-decade hold.
- At projected returns (-3.0% appreciation + 3.0% rent growth), your $59k cash investment doubles in ~9 years — after that, you're playing with house money.
Negotiation context
- It's been on market 76 days — a 6% lower offer ($197k) is reasonable based on typical stale-listing flexibility.
Risks & watch-outs
- Climate carrying-cost: severe wildfire risk; extreme-heat days projected 7→15/yr by 2055 (HVAC capex compounding) — expect insurance premiums to compound above CPI over the hold.
Questions for the listing agent
- It's been on market 76 days. Have you received any prior offers? Is the seller open to a 6% concession, seller financing, or rate buy-down credit?
- Why hasn't it sold? Are there any deal-killer items the seller is aware of (foundation, flood, title, zoning, code violations)?
- Is there a deadline driving the sale (1031 exchange, divorce, estate, relocation)? That informs how much negotiation room exists.
- Crime grade is F in this area — have there been break-ins, vandalism, or insurance claims at this property in the last 3 years? What carrier currently insures it and at what premium?
- What's the average days-on-market for RENTAL listings here right now (not sales)? A rising rental-DOM trend means longer vacancies and softer asking-rent achievability than the comps imply.
- What's the recent tenant-quality profile in this submarket — average credit score on applications, eviction rate, late-payment / NSF rate, and stable-employment percentage? A property-management company in the area should have these aggregated.
- How much new for-sale + rental construction is in the pipeline within 1–3 miles? Heavy new supply typically softens prices + rents 12–24 months out; constrained supply supports both.
Investment metrics
- 1% rule
- 1.18% ✓
- Cap rate
- 10.12%
- Cash-on-cash
- 13.66%
- DSCR
- 1.61
- GRM
- 7.1
CMA / ARV
- ARV (on-the-fly)
- $364,230
- Comps found
- 3
Show comp detail 3 sales within ~0.75 mi
| Address | Dist | Beds/Ba | Sqft | Sold | Price | $/sf | Match |
|---|---|---|---|---|---|---|---|
| 15461 Shannon Way | 0.26mi | 3/2.0 (-1) | 1,316 (+3%) | 20mo | $375,000 | $285 | 57 |
| 11548 Ridge Rd | 0.44mi | 3/1.0 (-1) | 1,292 (+1%) | 18mo | $255,000 | $197 | 49 |
| 319 Vistamont Dr | 0.46mi | 3/2.0 (-1) | 1,398 (+9%) | 23mo | $470,000 | $336 | 35 |
Match score weights: distance 35% · size 25% · config 20% · recency 20%. Top-matched comps best support the ARV.
Projected returns pro-forma
-3.0% appreciation · 3.0% rent growth · sell at horizon
- IRR
- 3.8%
- Equity multiple
- 1.15×
- Total profit
- $8,527
- Equity at exit
- $31,312
- IRR
- 13.3%
- Equity multiple
- 2.06×
- Total profit
- $62,052
- Equity at exit
- $18,157
Cash invested: $58,800 (down + closing). Projections, not guarantees.
Landlord ↔ Tenant lean methodology
- Overall (STATE)
- 18 Strongly Tenant-Friendly
- State California
- 18 Strongly Tenant-Friendly · D+13
- County
- — inherits STATE
- City
- — inherits STATE
ZIP-level market 95959
- Active inventory
- 269
- Price-to-rent
- 7.1×
Monthly cashflow live
- Estimated rent
- $2,481 medium interval (Pro) →
- Mortgage (P&I)
- −$1,101
- Tax from tax record
- −$102 /mo · $1,224/yr
- Insurance
- −$88
- HOA
- −$0
- Vacancy / Maint / Mgmt
- −$521
- Net cashflow
- $669
Break-even live
UW: 25.0% down · 7.5% · 30yr · 1.5% tax · 5.0% vac · 8.0% maint · 8.0% mgmt
Financing live
Cash to close
- Down payment
- $52,500
- Closing costs
- $6,300
- Reserves months
- —
- Total cash needed
- —
Loan-product check · same deal, 3 products live
Conventional
25% down · 7.5% · 30yr
- Down + closing
- —
- Monthly P&I
- —
- Monthly cashflow
- —
- DSCR
- —
- Eligible?
- —
Personal DTI + credit; lowest rate.
DSCR
20% down · 8.5% · 30yr
- Down + closing
- —
- Monthly P&I
- —
- Monthly cashflow
- —
- DSCR
- —
- Eligible?
- —
No personal income docs; deal must DSCR.
Hard money
10% down · 12.0% · 12mo
- Down + closing
- —
- Monthly P&I
- —
- Monthly cashflow
- —
- DSCR
- —
- Eligible?
- —
Short-term bridge; refi at stabilization.
Rent comps 1 comps
| Address | Beds | Baths | Sqft | Rent | $/sqft | DOM | Units | Dist |
|---|---|---|---|---|---|---|---|---|
| 126 W Berryhill Dr Grass Valley, CA | 1.0–3.0 | 1.0–2.0 | 797 | $2,325 | $2.92 | 1d | 7 | 1.37mi |
Listing history 17 events
-
2026-06-19days on market $210,000 Active 76 DOM
-
2026-06-18days on market $210,000 Active 75 DOM
-
2026-06-17days on market $210,000 Active 74 DOM
-
2026-06-16days on market $210,000 Active 73 DOM
-
2026-06-15days on market $210,000 Active 72 DOM
-
2026-06-14days on market $210,000 Active 70 DOM
-
2026-06-13days on market $210,000 Active 69 DOM
-
2026-06-10days on market $210,000 Active 67 DOM
-
2026-06-09days on market $210,000 Active 66 DOM
-
2026-06-08days on market $210,000 Active 65 DOM
-
2026-06-07days on market $210,000 Active 64 DOM
-
2026-06-05days on market $210,000 Active 61 DOM
-
2026-06-03days on market $210,000 Active 60 DOM
-
2026-06-02days on market $210,000 Active 59 DOM
-
2026-06-01days on market $210,000 Active 58 DOM
-
2026-05-31days on market $210,000 Active 57 DOM
-
2026-05-30days on market $210,000 Active 56 DOM
ⓘ Source: listings_history table (triggers on properties + properties_extension) + one-shot
backfill from property_details.listing_events for pre-trigger history.
Tax reassessment forecast CA · Resets to sale price
- Current annual tax
- $1,224 · $102/mo
- Projected year-2 tax
- $1,596 · $133/mo
- Expected delta
- +$372/yr (+$31/mo · 30.4%)
ⓘ Screening estimate from a state-policy table — verify with the county assessor before closing.
Climate risk First Street
- Flood 1/10 Low FEMA zone X (unshaded) · 0% chance over 30 yrs
- Wildfire 9/10 Extreme
- Heat 5/10 Major 7 d/yr ≥96°F today · 15 d/yr by 30 yrs out
- Wind 1/10 Low
- Air quality 10/10 Extreme 33 unhealthy d/yr today · 40 by 30 yrs out
Nearby sold comps map
Loading sold comps map…
Walkable amenities ~0.75 mi
Loading nearby amenities…
Taxation est. · year 1
- Rental income
- $29,770
- − Mortgage interest
- −$11,763
- − Property taxes
- −$1,224
- − Insurance
- −$1,050
- − Repairs & maintenance
- −$2,382
- − Management
- −$2,382
- − Depreciation
- −$6,109
- Taxable income
- $4,861
- Est. tax owed @ 24.0%
- −$1,167
- After-tax cash flow
- $6,863/yr
For passive investors: Depreciation is non-cash, so a rental often shows a tax loss while cash-flowing — sheltering income. Rental losses are passive: they offset passive income freely, and up to $25,000/yr can offset ordinary (W-2) income if you actively participate and your MAGI is under $100k (phasing out to $0 by $150k); unused losses carry forward. On sale, claimed depreciation is recaptured at up to 25%, and gains may owe capital-gains tax (a 1031 exchange can defer both). Figures are a year-1 estimate at your 24.0% rate — not tax advice; consult a CPA.
Schools (NCES district)
- District
- Nevada Joint Union High
- NCES district ID
- 0626880
- Math proficiency
- 25% ▼ -14.00%
- Reading proficiency
- 61% ▼ -7.00%
- Median HH income
- $57,336
- Composite
- 37.53/100
- National rank
- #4393
- State rank
- #201 of 517 in CA
Livability — Grass Valley
- Score
- 74/100
- State rank
- #134
- US rank
- #4710
Category grades
Schools grade is shown separately in the Schools card above.
Census & demographics
- County
- Nevada County · 85,339 people
- City population
- 48,022
- Metro
- Truckee-Grass Valley, CA
- Population (ZIP)
- 17,683
- Household income
- $86,524
- Rent vs Own
- Severe rent burden
- 413.0
Population outlook (Nevada County) Hauer SSP2
- Today (2025)
- 98,490 people
- By 2030
- 97,295 · -1.2%
- By 2040
- 92,041 · -6.5%
- By 2050
- 85,164 · -13.5%
- By 2075
- 68,436 · -30.5%
- By 2100
- 49,536 · -49.7%
Race, ethnicity, and origin ACS 2023
- Neighborhood character
- Predominantly White (81%)
- Race & ethnicity
- White 81% Two or more races 10% Hispanic / Latino 8% Asian 3%
- Hispanic origin (detail)
- Mexican 5%
- Common ancestry
- Slovak 4% Italian 2% Romanian 2%
- Foreign-born
- 8% · Canada, Vietnam
- Languages at home
- 94% English-only · Spanish 3% German/W. Germanic 1% Other Asian/Pacific 1%
Political lean MEDSL · Nevada
- 2024 margin
- D (+12.2) · D 54.4% · R 42.1% · Other 3.5%
- 2008→2024 swing
- +6.9pp toward D · 2008: 5.3pp · 2024: 12.2pp
- All cycles
- 2024: D+12.2 2020: D+14.8 2016: D+4.5 2012: R+4.7 2008: D+5.3
Not yet ingested
- Civics
- —
Market trends
- HPI YoY
- ▼ -238.68%
- Current HPI
- 209.775
- Rent YoY
- —
- Metro
- Truckee-Grass Valley, CA
- State GDP YoY
- ▲ 3.21%
- F500 in state
- 116
Industry mix (Fortune 500 HQ in CA)
| Industry | F500 HQs | Revenue |
|---|---|---|
| Technology | 27 | $1,492B |
|
||
| Financial Services | 3 | $174B |
|
||
| Retail | 3 | $44B |
|
||
| Insurance | 3 | $26B |
|
||
| Media / Entertainment | 2 | $115B |
|
||
| Pharmaceuticals / Biotech | 2 | $62B |
|
||
Property tax history
+2.3%/yrLatest (2025): $1,224 · +2.4% YoY. Source: county tax records.
Cash-flow waterfall
monthlySold comps — $/sqft
last 12 mo · ≤1 miLoading sold comps…