4053 NE 213th Ter · East Williston, FL
Flood risk 1/10 · Minimal
- FEMA flood zone
- X (unshaded)
- Chance of flooding over 30 yrs
- 0.0%
- Est. flood insurance / yr
- $507 – $1,088
Fire risk 7/10 · Major
- Est. fire insurance / yr
- $947 – $1,759
Heat risk 8/10 · Major
- Hot days now (above 107°F)
- 7 days/yr
- Hot days in 30 yrs
- 22 days/yr
Wind risk 9/10 · Severe
- Chance of severe wind over 30 yrs
- 99.0%
Air-quality risk 3/10 · Minor
- Unhealthy air days now
- 4 days/yr
- Unhealthy air days in 30 yrs
- 4 days/yr
Risk factors via First Street. Map © Google.
Why this score? — see what drove the C+ grade
The composite is a weighted blend of 9 inputs, each scored 0–100. Each bar is that input's sub-score; the figure is the points it added to the 100-point composite (weight × sub-score).
- Cash flow +27.8/30.0
- DSCR +9.8/10.0
- ARV discount +7.5/15.0
- 1% rule +7.2/10.0
- Schools +3.6/10.0
- Livability +2.8/5.0
- Rent growth +2.5/5.0
- Condition / age +2.5/5.0
- Appreciation +0.0/10.0
$135,000
🖨 Deal sheet 📄 Offer letter ✓ Due diligence
Listing remarks MLS
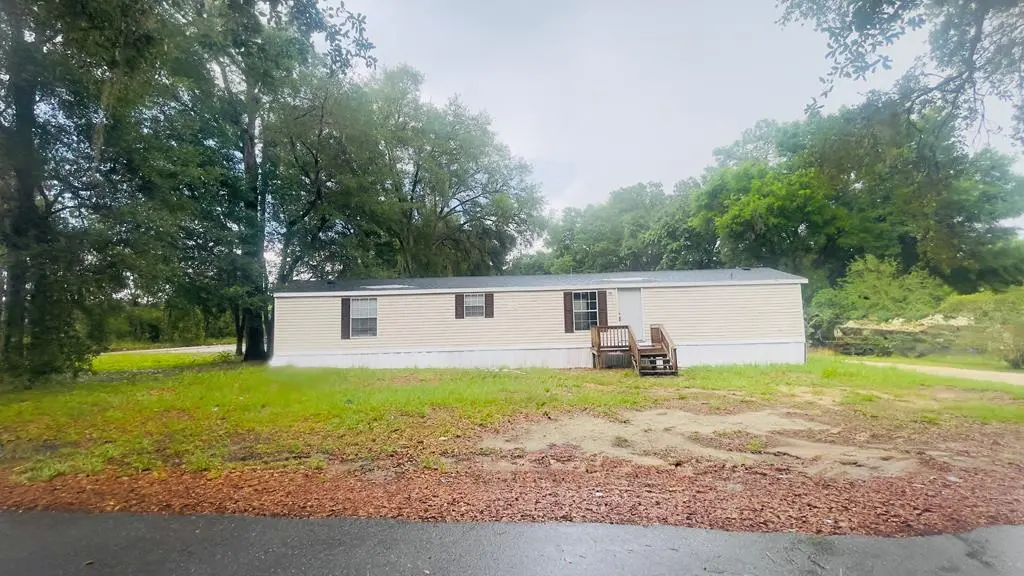
3 bedroom, 2 bath manufactured home situated on a corner lot. New roof installation in progress and new luxury vinyl plank flooring recently installed. The home features a split bedroom floor plan and an inside laundry room. Conveniently located near shopping, schools, and city amenities. Great opportunity for investors looking for rental units that are move-in ready. Call now to schedule your showing!
Key facts
- Corner unit
- Inside laundry room
- Corner lot
Tags
Property features AI
Finance
- Other: Located in the Pine Hurst development
- HOA & community: No HOA/association
Exterior
- Utilities: Public water; Public sewer; Electricity connected
- Home design: Manufactured home (single wide); One level; North-facing
- Construction: Vinyl siding with frame construction; Shingle roof; Pillar/post/pier foundation; Built as a manufactured single wide
- Exterior features: Cleared lot; Public maintained paved/asphalt road access
Interior
- Kitchen: Dishwasher; Range hood; Refrigerator; Exhaust fan
- Bedrooms: 3 bedrooms
- Bathrooms: 2 full bathrooms
- Heating & cooling: Central heating (electric); Central air conditioning
- Interior features: Ceiling fans; Open floorplan; Split bedroom layout; Thermostat
- Laundry & utility: Inside laundry room; Electric water heater
Neighborhood map
What this means for you Summary
Snapshot
- This is a 3-bed/2.0-bath manufactured listed at $135k.
Deal economics
- At list price, monthly cash flow is $410 ($5k/yr) — positive.
- The deal already cash-flows at list — no discount required.
- Meets the 1% rule at list price ($2k rent vs $135k).
- Recommended offer: $133k (1.5% below list) — sets the bar for market timing.
Location & tenants
- Location reads 55/100 on livability (#877 in FL) — a working-class tenant base; expect higher turnover. Strengths: cost of living A+, crime A, housing B; Watch: health & safety D, amenities F, commute F.
- Levy (rural): math 45% / reading 43% proficiency, ranked #54 of 73 in FL (top 74%) — families likely to look elsewhere, expect single-tenant / working-renter base with shorter leases; 62% free/reduced lunch — lower-income household profile, screen leases tightly.
- Zoned schools: Williston Elementary School (math 53% / reading 52%, grade C-, #976 of 2,144 statewide, top 46%, 488 students, 71% FRL); Williston Middle High School (math 44% / reading 36%, grade F, #296 of 667 statewide, top 45%, 1,119 students, 60% FRL) — zoned schools at 66% FRL track the district average.
- Market conditions: 358 active listings in the ZIP; 1 comparable units currently listed for rent nearby; 199 units permitted in Levy County in 2024 (0 in 5+ unit buildings).
Forward outlook
- Local home prices are declining (-3.0%/yr); year-one equity from $933 of loan paydown is wiped out by about $4k of value loss. Plan a longer hold.
- Levy County population projected at -28% by 2050 — secular population decline; favor cash flow + early exit over multi-decade hold.
- At projected returns (-3.0% appreciation + 3.0% rent growth), your $38k cash investment doubles in ~9 years — after that, you're playing with house money.
Negotiation context
- It's been on market 20 days — a 2% lower offer ($133k) is reasonable based on typical stale-listing flexibility.
- 3 sale attempts since 4y ago with the ask held roughly flat each time — persistent listings suggest the price (not the market) is what's stuck; bring a comps-based counter.
- Current owner paid $65k; list at $135k implies a 108% gain — meaningful room to come down on a strong offer.
Risks & watch-outs
- Climate carrying-cost: severe wind risk, 99% chance of damaging wind over 30y; major wildfire risk; extreme-heat days projected 7→22/yr by 2055 (HVAC capex compounding) — expect insurance premiums to compound above CPI over the hold.
Questions for the listing agent
- Is there a deadline driving the sale (1031 exchange, divorce, estate, relocation)? That informs how much negotiation room exists.
- Schools are F-rated, which usually means shorter tenancies and higher turnover. Who's the typical renter profile here, and what's been the actual vacancy rate?
- What's the average days-on-market for RENTAL listings here right now (not sales)? A rising rental-DOM trend means longer vacancies and softer asking-rent achievability than the comps imply.
- What's the recent tenant-quality profile in this submarket — average credit score on applications, eviction rate, late-payment / NSF rate, and stable-employment percentage? A property-management company in the area should have these aggregated.
- How much new for-sale + rental construction is in the pipeline within 1–3 miles? Heavy new supply typically softens prices + rents 12–24 months out; constrained supply supports both.
Investment metrics
- 1% rule
- 1.22% ✓
- Cap rate
- 9.94%
- Cash-on-cash
- 13.01%
- DSCR
- 1.58
- GRM
- 6.8
CMA / ARV
No comps found within radius.
Projected returns pro-forma
-3.0% appreciation · 3.0% rent growth · sell at horizon
- IRR
- 2.9%
- Equity multiple
- 1.11×
- Total profit
- $4,227
- Equity at exit
- $20,129
- IRR
- 12.5%
- Equity multiple
- 1.99×
- Total profit
- $37,294
- Equity at exit
- $11,672
Cash invested: $37,800 (down + closing). Projections, not guarantees.
Landlord ↔ Tenant lean methodology
- Overall (STATE)
- 87 Strongly Landlord-Friendly
- State Florida
- 87 Strongly Landlord-Friendly · R+3
- County
- — inherits STATE
- City
- — inherits STATE
ZIP-level market 32696
- Home prices YoY
- -6.2%
- Active inventory
- 358
- Price-to-rent
- 6.8×
Monthly cashflow live
- Estimated rent
- $1,650 medium interval (Pro) →
- Mortgage (P&I)
- −$708
- Tax from tax record
- −$129 /mo · $1,554/yr
- Insurance
- −$56
- HOA
- −$0
- Vacancy / Maint / Mgmt
- −$346
- Net cashflow
- $410
Break-even live
UW: 25.0% down · 7.5% · 30yr · 1.5% tax · 5.0% vac · 8.0% maint · 8.0% mgmt
Financing live
Cash to close
- Down payment
- $33,750
- Closing costs
- $4,050
- Reserves months
- —
- Total cash needed
- —
Loan-product check · same deal, 3 products live
Conventional
25% down · 7.5% · 30yr
- Down + closing
- —
- Monthly P&I
- —
- Monthly cashflow
- —
- DSCR
- —
- Eligible?
- —
Personal DTI + credit; lowest rate.
DSCR
20% down · 8.5% · 30yr
- Down + closing
- —
- Monthly P&I
- —
- Monthly cashflow
- —
- DSCR
- —
- Eligible?
- —
No personal income docs; deal must DSCR.
Hard money
10% down · 12.0% · 12mo
- Down + closing
- —
- Monthly P&I
- —
- Monthly cashflow
- —
- DSCR
- —
- Eligible?
- —
Short-term bridge; refi at stabilization.
Rent comps 1 comps
| Address | Beds | Baths | Sqft | Rent | $/sqft | DOM | Units | Dist |
|---|---|---|---|---|---|---|---|---|
| 305 SE 5th Ter Williston, FL | 2.0 | 1.5 | 1000 | $1,650 | $1.65 | 13d | 1 | 1.49mi |
Listing history 17 events
-
2026-06-18days on market $135,000 Active 20 DOM
-
2026-06-17days on market $135,000 Active 19 DOM
-
2026-06-16days on market $135,000 Active 18 DOM
-
2026-06-15days on market $135,000 Active 17 DOM
-
2026-06-14days on market $135,000 Active 15 DOM
-
2026-06-13days on market $135,000 Active 14 DOM
-
2026-06-10days on market $135,000 Active 12 DOM
-
2026-06-09days on market $135,000 Active 11 DOM
-
2026-06-08days on market $135,000 Active 10 DOM
-
2026-06-07days on market $135,000 Active 9 DOM
-
2026-06-05days on market $135,000 Active 6 DOM
-
2026-06-03days on market $135,000 Active 5 DOM
-
2026-06-02days on market $135,000 Active 4 DOM
-
2026-06-01days on market $135,000 Active 3 DOM
-
2026-05-31days on market $135,000 Active 2 DOM
-
2026-05-30remarks 406-char remark
Show marketing remark (405 chars)
3 bedroom, 2 bath manufactured home situated on a corner lot. New roof installation in progress and new luxury vinyl plank flooring recently installed. The home features a split bedroom floor plan and an inside laundry room. Conveniently located near shopping, schools, and city amenities. Great opportunity for investors looking for rental units that are move-in ready. Call now to schedule your showing!
-
2026-05-30$135,000 Active 1 DOM
Show marketing remark (405 chars)
3 bedroom, 2 bath manufactured home situated on a corner lot. New roof installation in progress and new luxury vinyl plank flooring recently installed. The home features a split bedroom floor plan and an inside laundry room. Conveniently located near shopping, schools, and city amenities. Great opportunity for investors looking for rental units that are move-in ready. Call now to schedule your showing!
ⓘ Source: listings_history table (triggers on properties + properties_extension) + one-shot
backfill from property_details.listing_events for pre-trigger history.
Tax reassessment forecast FL · Resets to sale price
- Current annual tax
- $1,554 · $129/mo
- Projected year-2 tax
- $1,554 · $129/mo
- Expected delta
- $0/yr ($0/mo · 0.0%)
ⓘ Screening estimate from a state-policy table — verify with the county assessor before closing.
Climate risk First Street
- Flood 1/10 Low FEMA zone X (unshaded) · 0% chance over 30 yrs
- Wildfire 7/10 Severe
- Heat 8/10 Severe 7 d/yr ≥107°F today · 22 d/yr by 30 yrs out
- Wind 9/10 Extreme 99% chance of damaging wind over 30 yrs
- Air quality 3/10 Moderate 4 unhealthy d/yr today · 4 by 30 yrs out
Nearby sold comps map
Loading sold comps map…
Walkable amenities ~0.75 mi
Loading nearby amenities…
Taxation est. · year 1
- Rental income
- $19,800
- − Mortgage interest
- −$7,562
- − Property taxes
- −$1,554
- − Insurance
- −$675
- − Repairs & maintenance
- −$1,584
- − Management
- −$1,584
- − Depreciation
- −$3,927
- Taxable income
- $2,914
- Est. tax owed @ 24.0%
- −$699
- After-tax cash flow
- $4,219/yr
For passive investors: Depreciation is non-cash, so a rental often shows a tax loss while cash-flowing — sheltering income. Rental losses are passive: they offset passive income freely, and up to $25,000/yr can offset ordinary (W-2) income if you actively participate and your MAGI is under $100k (phasing out to $0 by $150k); unused losses carry forward. On sale, claimed depreciation is recaptured at up to 25%, and gains may owe capital-gains tax (a 1031 exchange can defer both). Figures are a year-1 estimate at your 24.0% rate — not tax advice; consult a CPA.
Schools (NCES district)
- District
- Levy
- NCES district ID
- 1201140
- Math proficiency
- 45% ▼ -8.00%
- Reading proficiency
- 43% ▼ -3.00%
- Median HH income
- $35,254
- Composite
- 36.42/100
- National rank
- #4673
- State rank
- #54 of 73 in FL
Livability — East Williston
- Score
- 55/100
- State rank
- #877
- US rank
- #23180
Category grades
Schools grade is shown separately in the Schools card above.
Census & demographics
- Census place
- East Williston, FL
- Population (ZIP)
- 14,532
Population outlook (Levy County) Hauer SSP2
- Today (2025)
- 36,536 people
- By 2030
- 34,498 · -5.6%
- By 2040
- 30,294 · -17.1%
- By 2050
- 26,368 · -27.8%
- By 2075
- 19,003 · -48.0%
- By 2100
- 13,169 · -64.0%
Race, ethnicity, and origin ACS 2023
- Neighborhood character
- Predominantly White (69%)
- Race & ethnicity
- White 69% Hispanic / Latino 13% Black 13% Two or more races 7%
- Hispanic origin (detail)
- Mexican 3% Puerto Rican 4% Cuban 2%
- Common ancestry
- Slovak 4% Iranian 2% Lithuanian 1%
- Foreign-born
- 6% · Canada, China
- Languages at home
- 89% English-only · Spanish 10% Chinese 1%
Political lean MEDSL · Levy
- 2024 margin
- Solid R (+50.3) · D 24.6% · R 74.8%
- 2008→2024 swing
- -23.3pp toward R · 2008: -26.9pp · 2024: -50.3pp
- All cycles
- 2024: R+50.3 2020: R+45.6 2016: R+44.8 2012: R+32.2 2008: R+26.9
Not yet ingested
- Civics
- —
Market trends
- HPI YoY
- ▼ -21.99%
- Current HPI
- 335.7751
- Rent YoY
- —
- Metro
- —
- State GDP YoY
- ▲ 3.28%
- F500 in state
- 36
Industry mix (Fortune 500 HQ in FL)
| Industry | F500 HQs | Revenue |
|---|---|---|
| Industrial Technology | 2 | $29B |
|
||
| Insurance | 2 | $17B |
|
||
| Retail | 1 | $60B |
|
||
| Technology Distribution | 1 | $58B |
|
||
| Homebuilding | 1 | $35B |
|
||
| Technology Manufacturing | 1 | $35B |
|
||
Price history
+80.2% since first listed4 events — show timeline
- 2026-05-30 Listed $135,000 DGLMLS
- 2026-05-29 Listed $135,000 Stellar MLS as Distributed by MLS Grid
- 2023-02-17 Sold (Public Records) $65,000 Public Records
- 2022-11-13 Listed $74,900 Stellar MLS as Distributed by MLS Grid
Property tax history
+14.8%/yrLatest (2025): $1,554 · +16.4% YoY. Source: county tax records.
Cash-flow waterfall
monthlySold comps — $/sqft
last 12 mo · ≤1 miLoading sold comps…