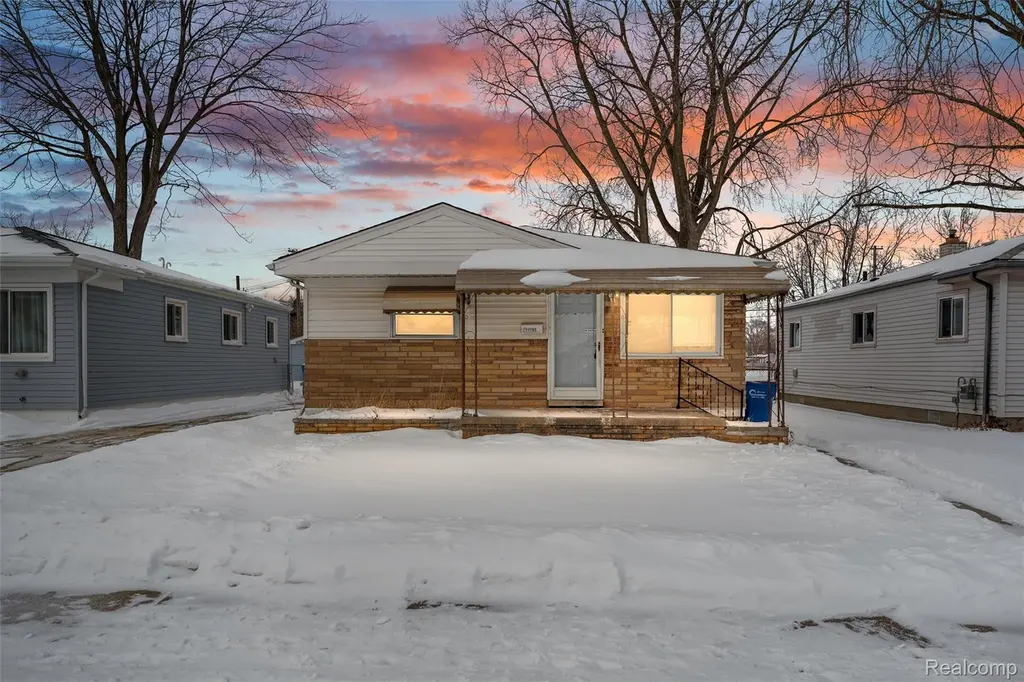
13335 Charlotte Ave · Warren, MI
Flood risk 1/10 · Minimal
- FEMA flood zone
- X (unshaded)
- Chance of flooding over 30 yrs
- 0.0%
- Est. flood insurance / yr
- $507 – $1,088
Fire risk 1/10 · Minimal
- Est. fire insurance / yr
- $784 – $1,456
Heat risk 3/10 · Minor
- Hot days now (above 96°F)
- 7 days/yr
- Hot days in 30 yrs
- 14 days/yr
Wind risk 1/10 · Minimal
- Chance of severe wind over 30 yrs
- —
Air-quality risk 3/10 · Minor
- Unhealthy air days now
- 3 days/yr
- Unhealthy air days in 30 yrs
- 4 days/yr
Risk factors via First Street. Map © Google.
Why this score? — see what drove the B grade
The composite is a weighted blend of 9 inputs, each scored 0–100. Each bar is that input's sub-score; the figure is the points it added to the 100-point composite (weight × sub-score).
- Cash flow +28.6/30.0
- ARV discount +14.8/15.0
- DSCR +10.0/10.0
- 1% rule +9.1/10.0
- Livability +3.7/5.0
- Rent growth +3.2/5.0
- Condition / age +2.5/5.0
- Schools +1.0/10.0
- Appreciation +0.0/10.0
$99,000
🖨 Deal sheet 📄 Offer letter ✓ Due diligence
Listing remarks MLS
Charming three bedroom ranch with detached garage in Warren, MI ready for it's next owner to make it their own! This home has solid bones, a functional layout and just the right amount of opportunity for someone looking to add their personal touches. With minor rehab needed it's the perfect chance to build equity while creating a space that truly feels like home! Whether you're a first time buyer, downsizing or looking for your next investment, this property is full of potential and possibilities. BATVAI.
Key facts
- 5,227 sq ft lot
- 2 garage spots
- Built 1958
Neighborhood map
What this means for you Summary
Snapshot
- This is a 3-bed/1.0-bath single-family listed at $99k.
Deal economics
- At list price, monthly cash flow is $325 ($4k/yr) — positive.
- The deal already cash-flows at list — no discount required.
- Meets the 1% rule at list price ($1k rent vs $99k).
- Cap rate 10.2% vs local median 5.3% in Warren — top-decile yield for the area; either an underpriced asset or a hidden risk that comps aren't pricing in. Stress-test before assuming the spread holds.
Location & tenants
- Location reads 74/100 on livability (#171 in MI, #4,491 nationally) — a middle-class / working-renter tenant base. Strengths: commute A+, cost of living A+, housing A+; Watch: schools D, amenities D, employment D.
- Van Dyke Public Schools (urban): math 7% / reading 19% proficiency, ranked #512 of 540 in MI (top 95%) — low school quality limits family demand, transient renter base, plan for 1-2y turnover; 80% free/reduced lunch — lower-income household profile, screen leases tightly.
- Market conditions: Rents rising (+2.9%/yr); 160 active listings in the ZIP; 34 comparable units currently listed for rent nearby; rentals at typical pace (median 18d on market — plan ~3-4 weeks tenant-placement turnaround); 1,321 units permitted in Macomb County in 2024 (86 in 5+ unit buildings).
- This rent runs 32% of the median local income ($52k/yr) — at the standard rent-burdened threshold; future hikes will face affordability resistance.
Forward outlook
- Local home prices are declining (-3.0%/yr); year-one equity from $684 of loan paydown is wiped out by about $3k of value loss. Plan a longer hold.
- Macomb County population projected at +9% by 2050 — modest demand growth; plan on rents tracking national, not racing it.
- At projected returns (-3.0% appreciation + 2.9% rent growth), your $28k cash investment doubles in ~9 years — after that, you're playing with house money.
Negotiation context
- Only 13 days on market — expect competitive offers; lowballing is unlikely to land.
- 13 sale attempts since 16y ago; this cycle's ask has dropped $16k (14%) from the opening price — seller is motivated, your offer sets the floor, not the list.
- Current owner paid $52k; list at $99k implies a 92% gain — meaningful room to come down on a strong offer.
Risks & watch-outs
- Watch-outs: property tax is 2.7% of price; built in 1958 — expect roof / HVAC / electrical / plumbing capex.
Questions for the listing agent
- Built in 1958 — when were the roof, HVAC, electrical panel, plumbing, and water heater last replaced?
- Property tax is high relative to price — has the assessment been appealed recently, and will the sale trigger a re-assessment?
- Is there a deadline driving the sale (1031 exchange, divorce, estate, relocation)? That informs how much negotiation room exists.
- Schools are D-rated, which usually means shorter tenancies and higher turnover. Who's the typical renter profile here, and what's been the actual vacancy rate?
- Crime grade is D in this area — have there been break-ins, vandalism, or insurance claims at this property in the last 3 years? What carrier currently insures it and at what premium?
- What's the average days-on-market for RENTAL listings here right now (not sales)? A rising rental-DOM trend means longer vacancies and softer asking-rent achievability than the comps imply.
- What's the recent tenant-quality profile in this submarket — average credit score on applications, eviction rate, late-payment / NSF rate, and stable-employment percentage? A property-management company in the area should have these aggregated.
- How much new for-sale + rental construction is in the pipeline within 1–3 miles? Heavy new supply typically softens prices + rents 12–24 months out; constrained supply supports both.
Investment metrics
- 1% rule
- 1.41% ✓
- Cap rate
- 10.23%
- Cash-on-cash
- 14.07%
- DSCR
- 1.63
- GRM
- 5.9
CMA / ARV
- ARV (median comp)
- $118,144
- List price
- $99,000
- Delta
- -2.66%
- Verdict
- FAIR
- Comps
- 20 within 1.0 mi
Show comp detail 12 sales within ~0.75 mi
| Address | Dist | Beds/Ba | Sqft | Sold | Price | $/sf | Match |
|---|---|---|---|---|---|---|---|
| 13459 Toepfer Rd | 0.08mi | 3/1.5 | 1,160 (+2%) | 5mo | $80,000 | $69 | 88 |
| 13440 Charlotte Ave | 0.06mi | 3/1.0 | 1,238 (+8%) | 3mo | $88,000 | $71 | 81 |
| 13308 Couwlier Ave | 0.15mi | 4/1.5 (+1) | 1,183 (+4%) | 1mo | $108,500 | $92 | 80 |
| 22844 Heussner Ave | 0.36mi | 3/1.0 | 1,176 (+3%) | 6mo | $67,000 | $57 | 74 |
| 13138 Couwlier Ave | 0.16mi | 2/1.0 (-1) | 1,056 (-8%) | 2mo | $119,900 | $114 | 73 |
| 22625 Oaklane St | 0.28mi | 4/1.0 (+1) | 1,050 (-8%) | 3mo | $133,000 | $127 | 66 |
| 22513 Heussner Ave | 0.23mi | 3/2.0 | 1,260 (+10%) | 3mo | $177,500 | $141 | 66 |
| 21022 Helle Ave | 0.65mi | 3/1.0 | 1,120 (-2%) | 2mo | $135,000 | $121 | 65 |
| 13049 Georgiana Ave | 0.47mi | 4/1.0 (+1) | 1,164 (+2%) | 7mo | $117,000 | $101 | 64 |
| 20577 Fairport St | 0.64mi | 3/1.0 | 1,078 (-6%) | 1mo | $65,000 | $60 | 60 |
| 20561 Pelkey St | 0.64mi | 3/1.0 | 1,038 (-9%) | 3mo | $43,000 | $41 | 52 |
| 12443 Georgiana Ave | 0.63mi | 2/1.0 (-1) | 1,050 (-8%) | 5mo | $94,900 | $90 | 48 |
Match score weights: distance 35% · size 25% · config 20% · recency 20%. Top-matched comps best support the ARV.
Projected returns pro-forma
-3.0% appreciation · 2.94% rent growth · sell at horizon
- IRR
- 4.3%
- Equity multiple
- 1.17×
- Total profit
- $4,649
- Equity at exit
- $14,761
- IRR
- 13.8%
- Equity multiple
- 2.11×
- Total profit
- $30,676
- Equity at exit
- $8,560
Cash invested: $27,720 (down + closing). Projections, not guarantees.
Landlord ↔ Tenant lean methodology
- Overall (STATE)
- 62 Landlord-Friendly
- State Michigan
- 62 Landlord-Friendly · EVEN
- County
- — inherits STATE
- City
- — inherits STATE
ZIP-level market 48089
- Rents YoY
- 2.9%
- Active inventory
- 160
- Price-to-rent
- 5.9×
Monthly cashflow live
- Estimated rent
- $1,398 high interval (Pro) →
- Mortgage (P&I)
- −$519
- Tax from tax record
- −$219 /mo · $2,625/yr
- Insurance
- −$41
- HOA
- −$0
- Vacancy / Maint / Mgmt
- −$294
- Net cashflow
- $325
Break-even live
UW: 25.0% down · 7.5% · 30yr · 1.5% tax · 5.0% vac · 8.0% maint · 8.0% mgmt
Financing live
Cash to close
- Down payment
- $24,750
- Closing costs
- $2,970
- Reserves months
- —
- Total cash needed
- —
Loan-product check · same deal, 3 products live
Conventional
25% down · 7.5% · 30yr
- Down + closing
- —
- Monthly P&I
- —
- Monthly cashflow
- —
- DSCR
- —
- Eligible?
- —
Personal DTI + credit; lowest rate.
DSCR
20% down · 8.5% · 30yr
- Down + closing
- —
- Monthly P&I
- —
- Monthly cashflow
- —
- DSCR
- —
- Eligible?
- —
No personal income docs; deal must DSCR.
Hard money
10% down · 12.0% · 12mo
- Down + closing
- —
- Monthly P&I
- —
- Monthly cashflow
- —
- DSCR
- —
- Eligible?
- —
Short-term bridge; refi at stabilization.
Rent comps 34 comps
| Address | Beds | Baths | Sqft | Rent | $/sqft | DOM | Units | Dist |
|---|---|---|---|---|---|---|---|---|
| 13050 Couwlier Ave Warren, MI | 3.0 | 1.0 | 850 | $1,350 | $1.59 | 24d | 1 | 0.21mi |
| 22852 Sharrow Ave Warren, MI | 3.0 | 1.0 | 1000 | $1,400 | $1.40 | 5d | 1 | 0.34mi |
| 13501 Vernon Ave Warren, MI | 2.0 | 1.0 | 850 | $1,300 | $1.53 | 24d | 1 | 0.43mi |
| 12846 Georgiana Ave Warren, MI | 3.0 | 1.0 | 912 | $1,300 | $1.43 | 24d | 1 | 0.54mi |
| 12807 Coleen Ave Warren, MI | 3.0 | 1.0 | 1080 | $1,250 | $1.16 | 24d | 1 | 0.58mi |
| 20242 Hickory St Detroit, MI | 3.0 | 1.0 | 747 | $1,300 | $1.74 | 11d | 1 | 0.80mi |
| 13693 Edmore Dr Detroit, MI | 3.0 | 1.5 | 1269 | $1,550 | $1.22 | 11d | 1 | 0.81mi |
| 20227 Pelkey St Detroit, MI | 3.0 | 1.0 | 968 | $1,350 | $1.39 | 17d | 1 | 0.82mi |
| 20553 Hamburg St Detroit, MI | 3.0 | 1.0 | 1074 | $1,300 | $1.21 | 3d | 1 | 0.82mi |
| 20296 Waltham St Detroit, MI | 3.0 | 1.5 | 986 | $1,300 | $1.32 | 17d | 1 | 0.82mi |
| 20215 Schoenherr St Unit 1 Detroit, MI | 2.0 | 1.0 | 1000 | $1,200 | $1.20 | 17d | 1 | 0.84mi |
| 14068 Carlisle St Detroit, MI | 3.0 | 1.0 | 1020 | $1,300 | $1.27 | 24d | 1 | 0.84mi |
| 14134 Collingham Dr Detroit, MI | 3.0 | 1.5 | 1300 | $1,350 | $1.04 | 43d | 1 | 0.93mi |
| 20027 Alcoy St Detroit, MI | 3.0 | 1.0 | 1000 | $1,349 | $1.35 | 17d | 1 | 0.94mi |
| 20091 Barlow St Detroit, MI | 3.0 | 1.0 | 930 | $1,300 | $1.40 | 17d | 1 | 0.98mi |
| 20290 Annott St Detroit, MI | 3.0 | 1.0 | 1300 | $1,250 | $0.96 | 17d | 1 | 1.04mi |
| 11319 Chalmers Ave Warren, MI | 3.0 | 1.0 | 975 | $1,500 | $1.54 | 24d | 1 | 1.12mi |
| 11359 Maxwell Ave Unit 11359 Warren, MI | 2.0 | 1.0 | 900 | $1,000 | $1.11 | 3d | 1 | 1.12mi |
| 11377 Sherman Ave Warren, MI | 3.0 | 1.0 | 1200 | $1,400 | $1.17 | 24d | 1 | 1.13mi |
| 11331 Continental Ave Warren, MI | 2.0 | 1.0 | 765 | $1,250 | $1.63 | 24d | 1 | 1.23mi |
| 11332 Republic Ave Warren, MI | 3.0 | 1.0 | 1140 | $1,500 | $1.32 | 24d | 1 | 1.24mi |
| 19610 Westphalia St Detroit, MI | 3.0 | 1.0 | 1200 | $1,595 | $1.33 | 17d | 1 | 1.25mi |
| 11228 Sherman Ave Warren, MI | 2.0 | 1.0 | 1000 | $1,200 | $1.20 | 12d | 1 | 1.26mi |
| 11076 Hudson Ave Warren, MI | 3.0 | 1.0 | 936 | $1,395 | $1.49 | 3d | 1 | 1.28mi |
| 11099 Dodge Ave Warren, MI | 2.0 | 1.0 | 1190 | $1,150 | $0.97 | 20d | 1 | 1.31mi |
| 19419 Westphalia St Detroit, MI | 3.0 | 1.0 | 1293 | $1,325 | $1.02 | 17d | 1 | 1.38mi |
| 13669 Pfent St Detroit, MI | 3.0 | 2.0 | 1031 | $1,374 | $1.33 | 17d | 1 | 1.41mi |
| 8640 Chalmers Ave Warren, MI | 3.0 | 1.0 | 804 | $1,423 | $1.77 | 24d | 1 | 1.46mi |
| 11076 Essex Ave Warren, MI | 4.0 | 1.0 | 1072 | $1,400 | $1.31 | 43d | 1 | 1.46mi |
| 8632 Studebaker Ave Warren, MI | 3.0 | 1.0 | 761 | $1,300 | $1.71 | 3d | 1 | 1.47mi |
| 19220 Alcoy St Detroit, MI | 3.0 | 1.0 | 1023 | $1,350 | $1.32 | 17d | 1 | 1.48mi |
| 8693 Paige Ave Warren, MI | 3.0 | 1.0 | 900 | $1,300 | $1.44 | 24d | 1 | 1.49mi |
| 8707 Continental Ave Warren, MI | 3.0 | 1.0 | 1100 | $1,200 | $1.09 | 5d | 1 | 1.49mi |
| 8707 Continental Ave Warren, MI | 3.0 | 1.0 | 968 | $1,200 | $1.24 | 17d | 1 | 1.49mi |
Listing history 47 events
-
2026-06-18days on market $99,000 Active 13 DOM
-
2026-06-17days on market $99,000 Active 12 DOM
-
2026-06-16days on market $99,000 Active 11 DOM
-
2026-06-15days on market $99,000 Active 10 DOM
-
2026-06-13days on market $99,000 Active 8 DOM
-
2026-06-13days on market $99,000 Active 7 DOM
-
2026-06-09days on market $99,000 Active 4 DOM
-
2026-06-08days on market $99,000 Active 3 DOM
-
2026-06-07pricedays on market $99,000 Active 2 DOM
-
2026-06-02days on market $115,000 Active 120 DOM
-
2026-06-01days on market $115,000 Active 119 DOM
-
2026-05-31days on market $115,000 Active 118 DOM
-
2026-02-02$115,000 Active 512-char remark
Show marketing remark (510 chars)
Charming three bedroom ranch with detached garage in Warren, MI ready for it's next owner to make it their own! This home has solid bones, a functional layout and just the right amount of opportunity for someone looking to add their personal touches. With minor rehab needed it's the perfect chance to build equity while creating a space that truly feels like home! Whether you're a first time buyer, downsizing or looking for your next investment, this property is full of potential and possibilities. BATVAI.
-
2026-02-02$115,000 Active 510-char remark
Show marketing remark (510 chars)
Charming three bedroom ranch with detached garage in Warren, MI ready for it's next owner to make it their own! This home has solid bones, a functional layout and just the right amount of opportunity for someone looking to add their personal touches. With minor rehab needed it's the perfect chance to build equity while creating a space that truly feels like home! Whether you're a first time buyer, downsizing or looking for your next investment, this property is full of potential and possibilities. BATVAI.
-
2024-02-05status Active
-
2024-02-05historical
-
2023-07-26status Pending
-
2023-07-26status Pending
-
2023-07-24historical
-
2023-05-09$129,900 Active
-
2023-05-09$129,900 Active
-
2022-02-03price $1,300
-
2017-12-28soldstatus $51,500
-
2017-12-12soldstatus $51,500 Sold
-
2017-12-12soldstatus $51,500 Closed
-
2017-11-07status Pending
-
2017-11-06status Pending
-
2017-11-06$55,000 Active
-
2017-11-06$55,000 Active
-
2017-11-01historical
-
2017-11-01historical
-
2017-10-09price $59,900
-
2017-10-08price $59,900
-
2017-08-29$65,000 Active
-
2017-08-29$65,000 Active
-
2017-08-28historical
-
2017-08-27historical
-
2017-04-05price $65,000
-
2017-04-04price $65,000
-
2017-03-29$75,000 Active
-
2017-03-29$75,000 Active
-
2011-02-09soldstatus $10,000
-
2011-02-09soldstatus $10,000
-
2010-12-30historical
-
2010-12-24$7,500
-
2010-12-24$9,000
-
2006-09-25soldstatus $90,000
ⓘ Source: listings_history table (triggers on properties + properties_extension) + one-shot
backfill from property_details.listing_events for pre-trigger history.
Tax reassessment forecast MI · Partial reset (capped growth)
- Current annual tax
- $2,625 · $219/mo
- Projected year-2 tax
- $2,625 · $219/mo
- Expected delta
- $0/yr ($0/mo · 0.0%)
ⓘ Screening estimate from a state-policy table — verify with the county assessor before closing.
Climate risk First Street
- Flood 1/10 Low FEMA zone X (unshaded) · 0% chance over 30 yrs
- Wildfire 1/10 Low
- Heat 3/10 Moderate 7 d/yr ≥96°F today · 14 d/yr by 30 yrs out
- Wind 1/10 Low
- Air quality 3/10 Moderate 3 unhealthy d/yr today · 4 by 30 yrs out
Nearby sold comps map
Loading sold comps map…
Walkable amenities ~0.75 mi
Loading nearby amenities…
Taxation est. · year 1
- Rental income
- $16,771
- − Mortgage interest
- −$5,546
- − Property taxes
- −$2,625
- − Insurance
- −$495
- − Repairs & maintenance
- −$1,342
- − Management
- −$1,342
- − Depreciation
- −$2,880
- Taxable income
- $2,542
- Est. tax owed @ 24.0%
- −$610
- After-tax cash flow
- $3,289/yr
For passive investors: Depreciation is non-cash, so a rental often shows a tax loss while cash-flowing — sheltering income. Rental losses are passive: they offset passive income freely, and up to $25,000/yr can offset ordinary (W-2) income if you actively participate and your MAGI is under $100k (phasing out to $0 by $150k); unused losses carry forward. On sale, claimed depreciation is recaptured at up to 25%, and gains may owe capital-gains tax (a 1031 exchange can defer both). Figures are a year-1 estimate at your 24.0% rate — not tax advice; consult a CPA.
Schools (NCES district)
- District
- Van Dyke Public Schools
- NCES district ID
- 2634680
- Math proficiency
- 7% ▼ -11.00%
- Reading proficiency
- 19% ▼ -5.00%
- Median HH income
- $33,231
- Composite
- 10.46/100
- National rank
- #9784
- State rank
- #512 of 540 in MI
Livability — Warren
- Score
- 74/100
- State rank
- #171
- US rank
- #4491
Category grades
Schools grade is shown separately in the Schools card above.
Census & demographics
- Census place
- Warren, MI
- County
- Macomb County · 638,552 people
- City population
- 114,937
- Metro
- Detroit-Warren-Dearborn, MI
- Population (ZIP)
- 31,853
- Household income
- $52,366
- Rent vs Own
- Severe rent burden
- 1754.0
Population outlook (Macomb County) Hauer SSP2
- Today (2025)
- 925,296 people
- By 2030
- 948,226 · +2.5%
- By 2040
- 983,961 · +6.3%
- By 2050
- 1,010,200 · +9.2%
- By 2075
- 1,076,222 · +16.3%
- By 2100
- 1,077,065 · +16.4%
Race, ethnicity, and origin ACS 2023
- Neighborhood character
- Diverse neighborhood (Simpson 0.61)
- Race & ethnicity
- White 53% Black 31% Asian 7% Two or more races 6% Hispanic / Latino 3%
- Common ancestry
- Romanian 11% Lithuanian 3% Slovak 2%
- Foreign-born
- 5% · Canada
- Languages at home
- 92% English-only · Other Asian/Pacific 3% Other Indo-European 2% Arabic 1%
Political lean MEDSL · Macomb
- 2024 margin
- R (+13.7) · D 42.2% · R 55.9% · Other 1.9%
- 2008→2024 swing
- -22.3pp toward R · 2008: 8.6pp · 2024: -13.7pp
- All cycles
- 2024: R+13.7 2020: R+8.1 2016: R+11.6 2012: D+4.0 2008: D+8.6
Not yet ingested
- Civics
- —
Market trends
- HPI YoY
- ▼ -211.46%
- Current HPI
- 154.8325
- Rent YoY
- ▲ 2.94%
- Metro
- Detroit-Warren-Dearborn, MI
- State GDP YoY
- ▲ 1.37%
- F500 in state
- 28
Industry mix (Fortune 500 HQ in MI)
| Industry | F500 HQs | Revenue |
|---|---|---|
| Automotive Parts | 3 | $48B |
|
||
| Automotive | 2 | $372B |
|
||
| Chemicals | 1 | $45B |
|
||
| Automotive Retail | 1 | $29B |
|
||
| Healthcare / Medical Devices | 1 | $23B |
|
||
| Automotive Technology | 1 | $20B |
|
||
Price history
+27.8% since first listed35 events — show timeline
- 2026-02-02 Listed $115,000 REALCOMP
- 2026-02-02 Listed $115,000 MiRealSource-MiMLS
- 2024-02-05 Relisted — REALCOMP
- 2024-02-05 Listing Removed — REALCOMP
- 2023-07-26 Pending — MiRealSource-MiMLS
- 2023-07-26 Pending — REALCOMP
- 2023-07-24 Listing Removed — MiRealSource-MiMLS
- 2023-05-09 Listed $129,900 MiRealSource-MiMLS
- 2023-05-09 Listed $129,900 REALCOMP
- 2022-02-03 Price Changed $1,300 RENT.
- 2017-12-28 Sold (Public Records) $51,500 Public Records
- 2017-12-12 Sold (MLS) $51,500 MiRealSource-MiMLS
- 2017-12-12 Sold (MLS) $51,500 REALCOMP
- 2017-11-07 Pending — MiRealSource-MiMLS
- 2017-11-06 Pending — REALCOMP
- 2017-11-06 Listed $55,000 MiRealSource-MiMLS
- 2017-11-06 Listed $55,000 REALCOMP
- 2017-11-01 Listing Removed — MiRealSource-MiMLS
- 2017-11-01 Listing Removed — REALCOMP
- 2017-10-09 Price Changed $59,900 MiRealSource-MiMLS
- 2017-10-08 Price Changed $59,900 REALCOMP
- 2017-08-29 Listed $65,000 MiRealSource-MiMLS
- 2017-08-29 Listed $65,000 REALCOMP
- 2017-08-28 Listing Removed — REALCOMP
- 2017-08-27 Listing Removed — MiRealSource-MiMLS
- 2017-04-05 Price Changed $65,000 MiRealSource-MiMLS
- 2017-04-04 Price Changed $65,000 REALCOMP
- 2017-03-29 Listed $75,000 MiRealSource-MiMLS
- 2017-03-29 Listed $75,000 REALCOMP
- 2011-02-09 Sold (MLS) $10,000 REALCOMP
- 2011-02-09 Sold (MLS) $10,000 MiRealSource-MiMLS
- 2010-12-30 Listing Removed — MiRealSource-MiMLS
- 2010-12-24 Listed $9,000 REALCOMP
- 2010-12-24 Listed $7,500 MiRealSource-MiMLS
- 2006-09-25 Sold (Public Records) $90,000 Public Records
Property tax history
+7.1%/yrLatest (2025): $2,625 · +2.6% YoY. Source: county tax records.
Cash-flow waterfall
monthlySold comps — $/sqft
last 12 mo · ≤1 miLoading sold comps…