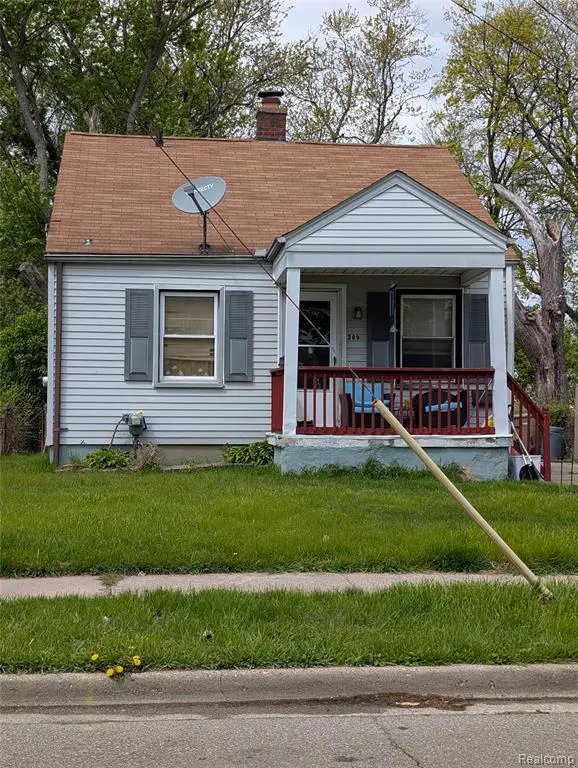
309 Michigan Ave · Pontiac, MI
Flood risk 1/10 · Minimal
- FEMA flood zone
- X (unshaded)
- Chance of flooding over 30 yrs
- 0.0%
- Est. flood insurance / yr
- $473 – $860
Fire risk 1/10 · Minimal
- Est. fire insurance / yr
- $784 – $1,456
Heat risk 2/10 · Minimal
- Hot days now (above 96°F)
- 7 days/yr
- Hot days in 30 yrs
- 15 days/yr
Wind risk 2/10 · Minimal
- Chance of severe wind over 30 yrs
- —
Air-quality risk 3/10 · Minor
- Unhealthy air days now
- 2 days/yr
- Unhealthy air days in 30 yrs
- 4 days/yr
Risk factors via First Street. Map © Google.
Why this score? — see what drove the C+ grade
The composite is a weighted blend of 9 inputs, each scored 0–100. Each bar is that input's sub-score; the figure is the points it added to the 100-point composite (weight × sub-score).
- Cash flow +28.9/30.0
- DSCR +10.0/10.0
- ARV discount +7.7/15.0
- 1% rule +7.3/10.0
- Livability +3.2/5.0
- Rent growth +2.5/5.0
- Condition / age +2.5/5.0
- Schools +1.0/10.0
- Appreciation +0.0/10.0
$105,000
🖨 Deal sheet (PDF) 📄 Offer letter ✓ Due diligence
Listing remarks MLS
Attention Invetors * * * Rental Property For Sale! Immediate Cash Flow! Perfect for DSCR Loans. Add it to your portfolio and hit the gound running. Located on Pontiac's East Side, it's close to highway access, gas stations, grocery stores, restaurants, and other shopping. Also in close proximity to Downtown Pontiac, and Downtown Auburn Hills, Parks, and Recreation. If you're in the market, this is a great opportunity that you don't want to let pass you by. IDRBNG, BTVAI. Don't wait. Submit your offer ASAP. No showings without accepted offer. Please do not disturb tenants.
Key facts
- Immediate cash flow
- Close to restaurants
- Close to shopping
Tags
Property features AI
Finance
- Other: Pets allowed
Exterior
- Parking: Detached 1-car garage
- Utilities: Sewer available; Circuit breaker electrical
- Home design: Single-family residence; One story; Ground-level entry with steps; Vinyl siding
- Construction: Asphalt roof; Block foundation
- Exterior features: Covered porch; Paved road
Interior
- Kitchen: Gas water heater
- Bedrooms: Total rooms: 5
- Bathrooms: 1 full bathroom
- Heating & cooling: Forced air heating (natural gas); Ceiling fan(s); No central air
- Interior features: High speed internet; Unfurnished
- Laundry & utility: Washer hookup; Gas dryer hookup
Neighborhood map
What this means for you Summary
Snapshot
- This is a 2-bed/1.0-bath single-family listed at $105k.
Deal economics
- At list price, monthly cash flow is $355 ($4k/yr) — positive.
- The deal already cash-flows at list — no discount required.
- Meets the 1% rule at list price ($1k rent vs $105k).
- Recommended offer: $102k (3.0% below list) — sets the bar for market timing.
- Cap rate 10.3% vs local median 5.4% in Pontiac — top-decile yield for the area; either an underpriced asset or a hidden risk that comps aren't pricing in. Stress-test before assuming the spread holds.
Location & tenants
- Location reads 64/100 on livability (#499 in MI) — a middle-class / working-renter tenant base. Strengths: commute A+, cost of living A+, housing A+; Watch: health & safety D, crime F, amenities F.
- Pontiac City School District (urban): math 8% / reading 17% proficiency, ranked #514 of 540 in MI (top 95%) — low school quality limits family demand, transient renter base, plan for 1-2y turnover; 81% free/reduced lunch — lower-income household profile, screen leases tightly.
- Zoned schools: Whitman Elementary School (math 8% / reading 8%, grade F, #1,300 of 1,397 statewide, top 94%, 601 students, 81% FRL); Pontiac Middle School (math 8% / reading 23%, grade F, #450 of 493 statewide, top 91%, 729 students, 81% FRL); Pontiac High School (math 12% / reading 27%, grade F, #622 of 713 statewide, top 88%, 935 students, 75% FRL) — zoned schools at 79% FRL track the district average.
- Market conditions: 90 active listings in the ZIP; 22 comparable units currently listed for rent nearby; rentals at typical pace (median 26d on market — plan ~3-4 weeks tenant-placement turnaround); 2,614 units permitted in Oakland County in 2024 (721 in 5+ unit buildings).
Forward outlook
- Local home prices are declining (-3.0%/yr); year-one equity from $726 of loan paydown is wiped out by about $3k of value loss. Plan a longer hold.
- Oakland County population projected at +10% by 2050 — modest demand growth; plan on rents tracking national, not racing it.
- At projected returns (-3.0% appreciation + 3.0% rent growth), your $29k cash investment doubles in ~9 years — after that, you're playing with house money.
Negotiation context
- It's been on market 51 days — a 3% lower offer ($102k) is reasonable based on typical stale-listing flexibility.
- 3 sale attempts since 25y ago with the ask held roughly flat each time — persistent listings suggest the price (not the market) is what's stuck; bring a comps-based counter.
- Current owner paid $20k; list at $105k implies a 422% gain — meaningful room to come down on a strong offer.
Risks & watch-outs
- Watch-outs: built in 1940 — expect roof / HVAC / electrical / plumbing capex.
Questions for the listing agent
- It's been on market 51 days. Have you received any prior offers? Is the seller open to a 3% concession, seller financing, or rate buy-down credit?
- Built in 1940 — when were the roof, HVAC, electrical panel, plumbing, and water heater last replaced?
- Is there a deadline driving the sale (1031 exchange, divorce, estate, relocation)? That informs how much negotiation room exists.
- Schools are F-rated, which usually means shorter tenancies and higher turnover. Who's the typical renter profile here, and what's been the actual vacancy rate?
- Crime grade is F in this area — have there been break-ins, vandalism, or insurance claims at this property in the last 3 years? What carrier currently insures it and at what premium?
- What's the average days-on-market for RENTAL listings here right now (not sales)? A rising rental-DOM trend means longer vacancies and softer asking-rent achievability than the comps imply.
- What's the recent tenant-quality profile in this submarket — average credit score on applications, eviction rate, late-payment / NSF rate, and stable-employment percentage? A property-management company in the area should have these aggregated.
- How much new for-sale + rental construction is in the pipeline within 1–3 miles? Heavy new supply typically softens prices + rents 12–24 months out; constrained supply supports both.
Investment metrics
- 1% rule
- 1.23% ✓
- Cap rate
- 10.34%
- Cash-on-cash
- 14.47%
- DSCR
- 1.64
- GRM
- 6.7
CMA / ARV
- ARV (median comp)
- $105,531
- List price
- $105,000
- Delta
- -0.50%
- Verdict
- FAIR
- Comps
- 20 within 1.0 mi
Show comp detail 12 sales within ~0.75 mi
| Address | Dist | Beds/Ba | Sqft | Sold | Price | $/sf | Match |
|---|---|---|---|---|---|---|---|
| 291 Michigan Ave | 0.03mi | 2/1.5 | 1,400 (-4%) | 5mo | $108,000 | $77 | 86 |
| 23 Martin Luther King JR Blvd N | 0.17mi | 3/1.5 (+1) | 1,412 (-3%) | 13mo | $205,000 | $145 | 70 |
| 32 S Marshall St | 0.28mi | 3/1.0 (+1) | 1,491 (+3%) | 11mo | $81,000 | $54 | 68 |
| 116 Raymond St | 0.32mi | 3/1.5 (+1) | 1,511 (+4%) | 9mo | $225,000 | $149 | 64 |
| 103 N Roselawn St | 0.42mi | 3/2.0 (+1) | 1,487 (+2%) | 10mo | $105,000 | $71 | 59 |
| 55 N Roselawn Street St | 0.43mi | 3/2.5 (+1) | 1,400 (-4%) | 8mo | $180,000 | $129 | 56 |
| 53 N Roselawn St | 0.43mi | 3/2.5 (+1) | 1,400 (-4%) | 8mo | $180,000 | $129 | 56 |
| 427 Valencia Dr | 0.62mi | 3/1.5 (+1) | 1,449 (-0%) | 16mo | $185,000 | $128 | 51 |
| 81 Monterey St | 0.65mi | 2/1.5 | 1,240 (-14%) | 3mo | $135,000 | $109 | 41 |
| 228 S Marshall St | 0.64mi | 3/1.0 (+1) | 1,606 (+11%) | 16mo | $135,500 | $84 | 34 |
| 75 S Jessie St | 0.57mi | 3/1.0 (+1) | 1,240 (-14%) | 14mo | $115,000 | $93 | 33 |
| 127 Victory Dr | 0.66mi | 3/2.0 (+1) | 1,610 (+11%) | 13mo | $153,000 | $95 | 31 |
Match score weights: distance 35% · size 25% · config 20% · recency 20%. Top-matched comps best support the ARV.
Projected returns pro-forma
-3.0% appreciation · 3.0% rent growth · sell at horizon
- IRR
- 4.9%
- Equity multiple
- 1.19×
- Total profit
- $5,551
- Equity at exit
- $15,656
- IRR
- 14.3%
- Equity multiple
- 2.15×
- Total profit
- $33,850
- Equity at exit
- $9,078
Cash invested: $29,400 (down + closing). Projections, not guarantees.
Landlord ↔ Tenant lean methodology
- Overall (STATE)
- 62 Landlord-Friendly
- State Michigan
- 62 Landlord-Friendly · EVEN
- County
- — inherits STATE
- City
- — inherits STATE
ZIP-level market 48342
- Home prices YoY
- -33.8%
- Active inventory
- 90
- Price-to-rent
- 6.7×
Monthly cashflow live
- Estimated rent
- $1,297 high interval (Pro) →
- Mortgage (P&I)
- −$551
- Tax from tax record
- −$75 /mo · $904/yr
- Insurance
- −$44
- HOA
- −$0
- Vacancy / Maint / Mgmt
- −$272
- Net cashflow
- $355
Break-even live
Sensitivity live
| Price | -10% $414 | -5% $384 | +0% $355 | +5% $325 | +10% $295 |
|---|---|---|---|---|---|
| Rent | -10% $252 | -5% $303 | +0% $355 | +5% $406 | +10% $457 |
| Rate | -1.0pp $407 | -0.5pp $381 | base $355 | +0.5pp $327 | +1.0pp $300 |
UW: 25.0% down · 7.5% · 30yr · 1.5% tax · 5.0% vac · 8.0% maint · 8.0% mgmt
Financing live
Cash to close
- Down payment
- $26,250
- Closing costs
- $3,150
- Reserves months
- —
- Total cash needed
- —
Loan-product check · same deal, 3 products live
Conventional
25% down · 7.5% · 30yr
- Down + closing
- —
- Monthly P&I
- —
- Monthly cashflow
- —
- DSCR
- —
- Eligible?
- —
Personal DTI + credit; lowest rate.
DSCR
20% down · 8.5% · 30yr
- Down + closing
- —
- Monthly P&I
- —
- Monthly cashflow
- —
- DSCR
- —
- Eligible?
- —
No personal income docs; deal must DSCR.
Hard money
10% down · 12.0% · 12mo
- Down + closing
- —
- Monthly P&I
- —
- Monthly cashflow
- —
- DSCR
- —
- Eligible?
- —
Short-term bridge; refi at stabilization.
Rent comps 22 comps
| Address | Beds | Baths | Sqft | Rent | $/sqft | DOM | Units | Dist |
|---|---|---|---|---|---|---|---|---|
| 68 N Shirley St Pontiac, MI | 3.0 | 1.0 | 950 | $1,395 | $1.47 | 19d | 1 | 0.33mi |
| 38 N Shirley St Pontiac, MI | 3.0 | 1.0 | 1174 | $1,425 | $1.21 | 45d | 1 | 0.34mi |
| 90 Martin Luther King Jr Blvd S Pontiac, MI | 2.0 | 1.0 | 900 | $1,000 | $1.11 | 45d | 1 | 0.38mi |
| 16 Victory Dr Unit 18 Pontiac, MI | 2.0 | 1.0 | 1114 | $1,150 | $1.03 | 26d | 1 | 0.46mi |
| 16 Victory Dr Unit 18 Pontiac, MI | 2.0 | 1.0 | 1118 | $1,150 | $1.03 | 45d | 1 | 0.46mi |
| 128 S Edith St Pontiac, MI | 2.0–3.0 | 2.0 | 1155 | $1,384 | $1.20 | 19d | 1 | 0.48mi |
| 4000 Winston Dr Pontiac, MI | 2.0 | 1.5 | 952 | $1,182 | $1.24 | 1d | 1 | 0.74mi |
| 188 Vernon Dr Pontiac, MI | 3.0 | 1.0 | 1100 | $1,500 | $1.36 | 26d | 1 | 0.79mi |
| 20 Frank St Pontiac, MI | 1.0 | 1.0 | 995 | $800 | $0.80 | 19d | 1 | 0.87mi |
| 49 Oakhill St Pontiac, MI | 3.0 | 1.0 | 1200 | $1,575 | $1.31 | 26d | 1 | 0.90mi |
| 672 Linda Vista Dr Pontiac, MI | 3.0 | 1.0 | 900 | $1,500 | $1.67 | 5d | 1 | 0.95mi |
| 1173 Featherstone Rd Pontiac, MI | 3.0 | 1.5 | 970 | $1,495 | $1.54 | 26d | 1 | 0.96mi |
| 264 Nelson St Pontiac, MI | 3.0 | 1.0 | 1478 | $1,590 | $1.08 | 45d | 1 | 1.08mi |
| 35 N Saginaw St Pontiac, MI | 1.0 | 1.0 | 1000 | $1,350 | $1.35 | 45d | 1 | 1.13mi |
| 35 N Saginaw St Unit 2 Pontiac, MI | 1.0 | 1.0 | 1000 | $1,350 | $1.35 | 45d | 1 | 1.13mi |
| 957 Perry St Pontiac, MI | 1.0–3.0 | 1.0 | 835 | $974 | $1.17 | 45d | 1 | 1.19mi |
| 750 Scottwood St Pontiac, MI | 3.0 | 1.0 | 920 | $1,395 | $1.52 | 14d | 1 | 1.23mi |
| 5 Carter St Pontiac, MI | 1.0 | 1.0 | 880 | $1,034 | $1.18 | 6d | 1 | 1.28mi |
| 65 Whitfield St Pontiac, MI | 3.0 | 1.0 | 924 | $1,175 | $1.27 | 45d | 1 | 1.31mi |
| 489 Central Ave Pontiac, MI | 2.0 | 1.0 | 1140 | $1,195 | $1.05 | 6d | 1 | 1.33mi |
| 442 Central Ave Pontiac, MI | 2.0 | 1.0 | 1500 | $1,250 | $0.83 | 18d | 1 | 1.35mi |
| 442 Central Ave Unit 1 Pontiac, MI | 2.0 | 1.0 | 1500 | $1,500 | $1.00 | 6d | 1 | 1.35mi |
Listing history 23 events
-
2026-06-21days on market $105,000 Active 51 DOM
-
2026-06-18days on market $105,000 Active 48 DOM
-
2026-06-17days on market $105,000 Active 47 DOM
-
2026-06-16days on market $105,000 Active 46 DOM
-
2026-06-15days on market $105,000 Active 45 DOM
-
2026-06-13days on market $105,000 Active 43 DOM
-
2026-06-13days on market $105,000 Active 42 DOM
-
2026-06-09days on market $105,000 Active 39 DOM
-
2026-06-08days on market $105,000 Active 38 DOM
-
2026-06-07days on market $105,000 Active 37 DOM
-
2026-06-04days on market $105,000 Active 34 DOM
-
2026-06-03days on market $105,000 Active 33 DOM
-
2026-06-02days on market $105,000 Active 32 DOM
-
2026-06-01days on market $105,000 Active 31 DOM
-
2026-05-31days on market $105,000 Active 30 DOM
-
2026-05-19price $105,000 582-char remark
Show marketing remark (582 chars)
Attention Invetors * * * Rental Property For Sale! Immediate Cash Flow! Perfect for DSCR Loans. Add it to your portfolio and hit the gound running. Located on Pontiac's East Side, it's close to highway access, gas stations, grocery stores, restaurants, and other shopping. Also in close proximity to Downtown Pontiac, and Downtown Auburn Hills, Parks, and Recreation. If you're in the market, this is a great opportunity that you don't want to let pass you by. IDRBNG, BTVAI. Don't wait. Submit your offer ASAP. No showings without accepted offer. Please do not disturb tenants.
-
2026-05-18price $105,000 582-char remark
-
2026-04-30$110,000 Active 582-char remark
Show marketing remark (582 chars)
Attention Invetors * * * Rental Property For Sale! Immediate Cash Flow! Perfect for DSCR Loans. Add it to your portfolio and hit the gound running. Located on Pontiac's East Side, it's close to highway access, gas stations, grocery stores, restaurants, and other shopping. Also in close proximity to Downtown Pontiac, and Downtown Auburn Hills, Parks, and Recreation. If you're in the market, this is a great opportunity that you don't want to let pass you by. IDRBNG, BTVAI. Don't wait. Submit your offer ASAP. No showings without accepted offer. Please do not disturb tenants.
-
2001-04-23soldstatus $20,100
Show marketing remark (300 chars)
HUD CASE# 261-550993. FHA INSURED FINANCING AVAILABLE W/ CONDITIONS. INSP. / CERT. ROOF/SYSTEMS AT BUYERS EXPENSE TO ENSURE COMPLETE SYSTEM FUNCTIONAL- ITY. HOME SOLD AS-IS -HUD WILL MAKE NO REPAIRS. ELECTRONIC BIDDING VIA PHONE OR INTERNET ONLY! GO TO WWW. MCBREO. COM FOR INFO. COOP COMM. UP TO 5%.
-
2001-03-02$20,000
Show marketing remark (300 chars)
HUD CASE# 261-550993. FHA INSURED FINANCING AVAILABLE W/ CONDITIONS. INSP. / CERT. ROOF/SYSTEMS AT BUYERS EXPENSE TO ENSURE COMPLETE SYSTEM FUNCTIONAL- ITY. HOME SOLD AS-IS -HUD WILL MAKE NO REPAIRS. ELECTRONIC BIDDING VIA PHONE OR INTERNET ONLY! GO TO WWW. MCBREO. COM FOR INFO. COOP COMM. UP TO 5%.
-
1990-10-15soldstatus $36,000
-
1971-08-05soldstatus $16,300
ⓘ Source: listings_history table (triggers on properties + properties_extension) + one-shot
backfill from property_details.listing_events for pre-trigger history.
Tax reassessment forecast MI · Partial reset (capped growth)
- Current annual tax
- $904 · $75/mo
- Projected year-2 tax
- $1,260 · $105/mo
- Expected delta
- +$357/yr (+$30/mo · 39.4%)
ⓘ Screening estimate from a state-policy table — verify with the county assessor before closing.
Climate risk First Street
- Flood 1/10 Low FEMA zone X (unshaded) · 0% chance over 30 yrs
- Wildfire 1/10 Low
- Heat 2/10 Low 7 d/yr ≥96°F today · 15 d/yr by 30 yrs out
- Wind 2/10 Low
- Air quality 3/10 Moderate 2 unhealthy d/yr today · 4 by 30 yrs out
Nearby sold comps map
Loading sold comps map…
Walkable amenities ~0.75 mi
Loading nearby amenities…
Taxation est. · year 1
- Rental income
- $15,558
- − Mortgage interest
- −$5,882
- − Property taxes
- −$904
- − Insurance
- −$525
- − Repairs & maintenance
- −$1,245
- − Management
- −$1,245
- − Depreciation
- −$3,055
- Taxable income
- $2,704
- Est. tax owed @ 24.0%
- −$649
- After-tax cash flow
- $3,606/yr
For passive investors: Depreciation is non-cash, so a rental often shows a tax loss while cash-flowing — sheltering income. Rental losses are passive: they offset passive income freely, and up to $25,000/yr can offset ordinary (W-2) income if you actively participate and your MAGI is under $100k (phasing out to $0 by $150k); unused losses carry forward. On sale, claimed depreciation is recaptured at up to 25%, and gains may owe capital-gains tax (a 1031 exchange can defer both). Figures are a year-1 estimate at your 24.0% rate — not tax advice; consult a CPA.
Schools (NCES district)
- District
- Pontiac City School District
- NCES district ID
- 2628740
- Math proficiency
- 8% ▼ -5.00%
- Reading proficiency
- 17% ▼ -3.00%
- Median HH income
- $33,888
- Composite
- 10.12/100
- National rank
- #9802
- State rank
- #514 of 540 in MI
Livability — Pontiac
- Score
- 64/100
- State rank
- #499
- US rank
- #14703
Category grades
Schools grade is shown separately in the Schools card above.
Census & demographics
- Census place
- Pontiac, MI
- City population
- 44,593
- Population (ZIP)
- 17,227
Population outlook (Oakland County) Hauer SSP2
- Today (2025)
- 1,335,747 people
- By 2030
- 1,375,100 · +2.9%
- By 2040
- 1,435,385 · +7.5%
- By 2050
- 1,469,250 · +10.0%
- By 2075
- 1,531,946 · +14.7%
- By 2100
- 1,450,485 · +8.6%
Race, ethnicity, and origin ACS 2023
- Neighborhood character
- Diverse neighborhood (Simpson 0.62)
- Race & ethnicity
- Black 57% Hispanic / Latino 19% White 13% Two or more races 13% Asian 4%
- Hispanic origin (detail)
- Mexican 11% Puerto Rican 2%
- Common ancestry
- Romanian 1% Lithuanian 1% Italian 1%
- Foreign-born
- 10% · Canada, Vietnam
- Languages at home
- 79% English-only · Spanish 15% Other Asian/Pacific 4% Other Indo-European 1%
Political lean MEDSL · Oakland
- 2024 margin
- D (+10.6) · D 54.4% · R 43.8% · Other 1.9%
- 2008→2024 swing
- -3.9pp toward R · 2008: 14.5pp · 2024: 10.6pp
- All cycles
- 2024: D+10.6 2020: D+14.1 2016: D+8.1 2012: D+8.1 2008: D+14.5
Not yet ingested
- Civics
- —
Market trends
- HPI YoY
- ▼ -109.18%
- Current HPI
- 214.3258
- Rent YoY
- —
- Metro
- —
- State GDP YoY
- ▲ 1.37%
- F500 in state
- 28
Industry mix (Fortune 500 HQ in MI)
| Industry | F500 HQs | Revenue |
|---|---|---|
| Automotive Parts | 3 | $48B |
|
||
| Automotive | 2 | $372B |
|
||
| Chemicals | 1 | $45B |
|
||
| Automotive Retail | 1 | $29B |
|
||
| Healthcare / Medical Devices | 1 | $23B |
|
||
| Automotive Technology | 1 | $20B |
|
||
Price history
+544.2% since first listed8 events — show timeline
- 2026-05-19 Price Changed $105,000 MiRealSource-MiMLS
- 2026-05-18 Price Changed $105,000 REALCOMP
- 2026-04-30 Listed $110,000 REALCOMP
- 2026-04-30 Listed $110,000 MiRealSource-MiMLS
- 2001-04-23 Sold (MLS) $20,100 MiRealSource-MiMLS
- 2001-03-02 Listed $20,000 MiRealSource-MiMLS
- 1990-10-15 Sold (Public Records) $36,000 Public Records
- 1971-08-05 Sold (Public Records) $16,300 Public Records
Property tax history
+1.9%/yrLatest (2025): $904 · +2.7% YoY. Source: county tax records.
Cash-flow waterfall
monthlySold comps — $/sqft
last 12 mo · ≤1 miLoading sold comps…