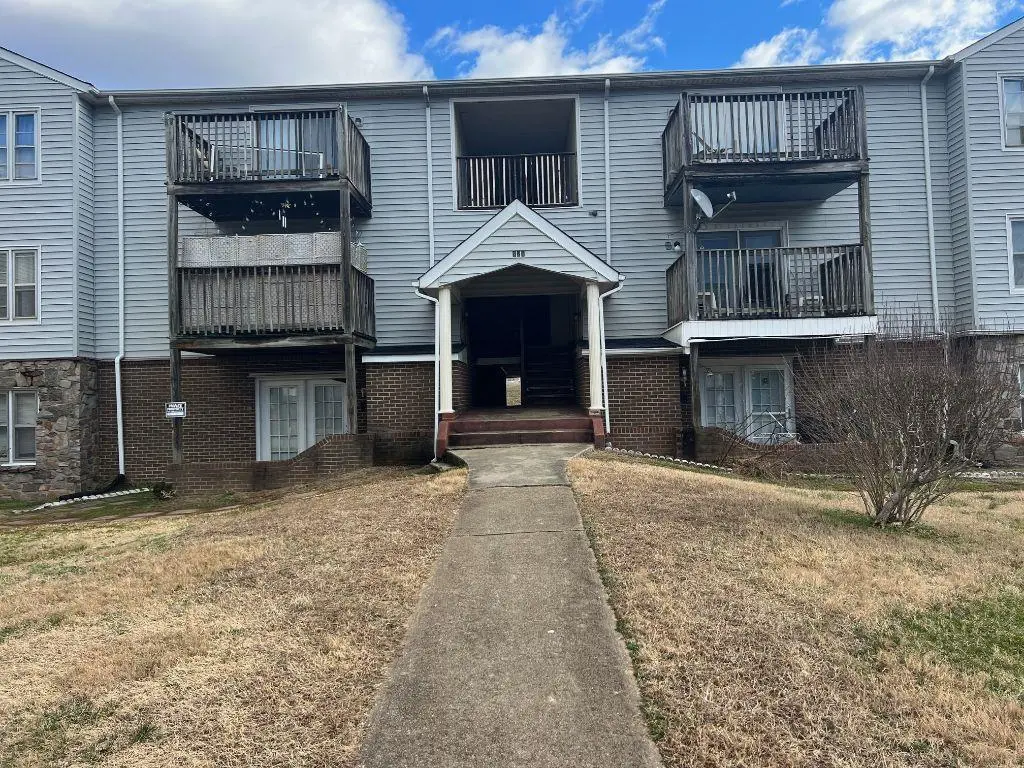
225 H Seminole Trl · Danville, VA
Flood risk No data
- FEMA flood zone
- —
- Chance of flooding over 30 yrs
- —
- Est. flood insurance / yr
- —
Fire risk No data
- Est. fire insurance / yr
- —
Heat risk No data
- Hot days now (above threshold)
- —
- Hot days in 30 yrs
- —
Wind risk No data
- Chance of severe wind over 30 yrs
- —
Air-quality risk No data
- Unhealthy air days now
- —
- Unhealthy air days in 30 yrs
- —
Risk factors via First Street. Map © Google.
Why this score? — see what drove the B- grade
The composite is a weighted blend of 9 inputs, each scored 0–100. Each bar is that input's sub-score; the figure is the points it added to the 100-point composite (weight × sub-score).
- Cash flow +30.0/30.0
- DSCR +10.0/10.0
- 1% rule +7.9/10.0
- ARV discount +7.5/15.0
- Livability +3.9/5.0
- Schools +3.0/10.0
- Rent growth +2.5/5.0
- Condition / age +2.5/5.0
- Appreciation +0.0/10.0
$105,000
🖨 Deal sheet 📄 Offer letter ✓ Due diligence
Listing remarks MLS
This 3 bedroom 2 bathroom unit has been remodeled with New LVP flooring and Carpet throughout, fresh paint, new light fixtures and new door handles. There is a living room with a deck leading outside, nice kitchen with lots of cabinets and a dining room. All appliances convey. These units make great investment properties to rent out for a great return on your investment or make great owner occupied units. This is a move in ready unit.
Key facts
- Deck leading outside
- New door handles
- New light fixtures
Tags
Neighborhood map
What this means for you Summary
Snapshot
- This is a 3-bed/2.0-bath other listed at $105k.
Deal economics
- At list price, monthly cash flow is $452 ($5k/yr) — positive.
- The deal already cash-flows at list — no discount required.
- Meets the 1% rule at list price ($1k rent vs $105k).
- Recommended offer: $92k (12.0% below list) — sets the bar for market timing.
- Cap rate 11.5% vs local median 5.3% in Danville — top-decile yield for the area; either an underpriced asset or a hidden risk that comps aren't pricing in. Stress-test before assuming the spread holds.
Location & tenants
- Location reads 77/100 on livability (#91 in VA, #2,952 nationally) — a middle-class / working-renter tenant base. Strengths: cost of living A+, housing A+, health & safety A+; Watch: amenities D+, crime D-, commute F.
- Danville City Public School District (town): math 30% / reading 44% proficiency, ranked #128 of 131 in VA (top 98%) — families likely to look elsewhere, expect single-tenant / working-renter base with shorter leases; 71% free/reduced lunch — lower-income household profile, screen leases tightly.
- Market conditions: 211 active listings in the ZIP; 6 comparable units currently listed for rent nearby; rentals lingering (median 44d on market — plan ~5-8 weeks vacancy on turnover, expect pricing pressure); 83% of comp listings sitting > 30 days — soft ceiling on asking rent; 54 units permitted in Danville city in 2024 (40 in 5+ unit buildings).
- This rent runs 34% of the median local income ($48k/yr) — at the standard rent-burdened threshold; future hikes will face affordability resistance.
Forward outlook
- Local home prices are declining (-3.0%/yr); year-one equity from $726 of loan paydown is wiped out by about $3k of value loss. Plan a longer hold.
- Danville County population projected to shrink 7% by 2050 — rents likely to lag national; underwrite the cash flow, not the appreciation.
- At projected returns (-3.0% appreciation + 3.0% rent growth), your $29k cash investment doubles in ~7 years — after that, you're playing with house money.
Negotiation context
- It's been on market 574 days — a 12% lower offer ($92k) is reasonable based on typical stale-listing flexibility.
- 4 sale attempts since 8y ago with the ask held roughly flat each time — persistent listings suggest the price (not the market) is what's stuck; bring a comps-based counter.
- Current owner paid $66k; list at $105k implies a 59% gain — meaningful room to come down on a strong offer.
Questions for the listing agent
- It's been on market 574 days. Have you received any prior offers? Is the seller open to a 12% concession, seller financing, or rate buy-down credit?
- Built in 1975 — when were the roof, HVAC, electrical panel, plumbing, and water heater last replaced?
- Why hasn't it sold? Are there any deal-killer items the seller is aware of (foundation, flood, title, zoning, code violations)?
- Is there a deadline driving the sale (1031 exchange, divorce, estate, relocation)? That informs how much negotiation room exists.
- Schools are B-rated — typically a magnet for longer-tenancy family renters. What's the average tenant stay here, and is there a school-zone premium baked into asking?
- Crime grade is D in this area — have there been break-ins, vandalism, or insurance claims at this property in the last 3 years? What carrier currently insures it and at what premium?
- What's the average days-on-market for RENTAL listings here right now (not sales)? A rising rental-DOM trend means longer vacancies and softer asking-rent achievability than the comps imply.
- What's the recent tenant-quality profile in this submarket — average credit score on applications, eviction rate, late-payment / NSF rate, and stable-employment percentage? A property-management company in the area should have these aggregated.
- How much new for-sale + rental construction is in the pipeline within 1–3 miles? Heavy new supply typically softens prices + rents 12–24 months out; constrained supply supports both.
Investment metrics
- 1% rule
- 1.29% ✓
- Cap rate
- 11.46%
- Cash-on-cash
- 18.45%
- DSCR
- 1.82
- GRM
- 6.5
CMA / ARV
- ARV (median comp)
- $69,925
- List price
- $105,000
- Delta
- 50.16%
- Verdict
- OVERPRICED
- Comps
- 19 within 1.0 mi
Projected returns pro-forma
-3.0% appreciation · 3.0% rent growth · sell at horizon
- IRR
- 10.1%
- Equity multiple
- 1.40×
- Total profit
- $11,732
- Equity at exit
- $15,656
- IRR
- 19.2%
- Equity multiple
- 2.60×
- Total profit
- $47,106
- Equity at exit
- $9,078
Cash invested: $29,400 (down + closing). Projections, not guarantees.
Landlord ↔ Tenant lean methodology
- Overall (STATE)
- 55 Moderately Landlord-Leaning
- State Virginia
- 55 Moderately Landlord-Leaning · D+2
- County
- — inherits STATE
- City
- — inherits STATE
ZIP-level market 24540
- Home prices YoY
- -20.0%
- Active inventory
- 211
- Price-to-rent
- 6.5×
Monthly cashflow live
- Estimated rent
- $1,355 high interval (Pro) →
- Mortgage (P&I)
- −$551
- Tax from tax record
- −$24 /mo · $286/yr
- Insurance
- −$44
- HOA
- −$0
- Vacancy / Maint / Mgmt
- −$285
- Net cashflow
- $452
Break-even live
UW: 25.0% down · 7.5% · 30yr · 1.5% tax · 5.0% vac · 8.0% maint · 8.0% mgmt
Financing live
Cash to close
- Down payment
- $26,250
- Closing costs
- $3,150
- Reserves months
- —
- Total cash needed
- —
Loan-product check · same deal, 3 products live
Conventional
25% down · 7.5% · 30yr
- Down + closing
- —
- Monthly P&I
- —
- Monthly cashflow
- —
- DSCR
- —
- Eligible?
- —
Personal DTI + credit; lowest rate.
DSCR
20% down · 8.5% · 30yr
- Down + closing
- —
- Monthly P&I
- —
- Monthly cashflow
- —
- DSCR
- —
- Eligible?
- —
No personal income docs; deal must DSCR.
Hard money
10% down · 12.0% · 12mo
- Down + closing
- —
- Monthly P&I
- —
- Monthly cashflow
- —
- DSCR
- —
- Eligible?
- —
Short-term bridge; refi at stabilization.
Rent comps 6 comps
| Address | Beds | Baths | Sqft | Rent | $/sqft | DOM | Units | Dist |
|---|---|---|---|---|---|---|---|---|
| 713 Springfield Rd Unit K Danville, VA | 3.0 | 2.0 | 1200 | $1,200 | $1.00 | 43d | 1 | 0.14mi |
| 248 Lakeside Dr Danville, VA | 3.0 | 1.5 | 1134 | $2,200 | $1.94 | 43d | 1 | 0.77mi |
| 357 Terry Ave Danville, VA | 3.0 | 1.0 | 900 | $1,165 | $1.29 | 43d | 1 | 0.81mi |
| 119 Crosland Ave Danville, VA | 2.0 | 1.5 | 776 | $910 | $1.17 | 21d | 1 | 1.05mi |
| 117 Ida St Danville, VA | 3.0 | 1.0 | 925 | $1,163 | $1.26 | 43d | 1 | 1.10mi |
| 1300 Franklin Tpke Danville, VA | 2.0 | 1.5 | 1000 | $1,265 | $1.26 | 43d | 1 | 1.35mi |
Listing history 27 events
-
2026-06-19days on market $105,000 Active 574 DOM
-
2026-06-18days on market $105,000 Active 573 DOM
-
2026-06-17days on market $105,000 Active 572 DOM
-
2026-06-16days on market $105,000 Active 571 DOM
-
2026-06-15days on market $105,000 Active 570 DOM
-
2026-06-14days on market $105,000 Active 568 DOM
-
2026-06-13days on market $105,000 Active 567 DOM
-
2026-06-10days on market $105,000 Active 565 DOM
-
2026-06-09days on market $105,000 Active 564 DOM
-
2026-06-08days on market $105,000 Active 563 DOM
-
2026-06-07days on market $105,000 Active 562 DOM
-
2026-06-05days on market $105,000 Active 559 DOM
-
2026-06-02days on market $105,000 Active 557 DOM
-
2026-06-01days on market $105,000 Active 556 DOM
-
2026-05-31days on market $105,000 Active 555 DOM
-
2026-05-30days on market $105,000 Active 554 DOM
-
2025-10-08status Active 438-char remark
Show marketing remark (438 chars)
This 3 bedroom 2 bathroom unit has been remodeled with New LVP flooring and Carpet throughout, fresh paint, new light fixtures and new door handles. There is a living room with a deck leading outside, nice kitchen with lots of cabinets and a dining room. All appliances convey. These units make great investment properties to rent out for a great return on your investment or make great owner occupied units. This is a move in ready unit.
-
2025-05-18historical Active Under Contract 438-char remark
Show marketing remark (438 chars)
This 3 bedroom 2 bathroom unit has been remodeled with New LVP flooring and Carpet throughout, fresh paint, new light fixtures and new door handles. There is a living room with a deck leading outside, nice kitchen with lots of cabinets and a dining room. All appliances convey. These units make great investment properties to rent out for a great return on your investment or make great owner occupied units. This is a move in ready unit.
-
2024-11-22$105,000 Active 438-char remark
Show marketing remark (438 chars)
This 3 bedroom 2 bathroom unit has been remodeled with New LVP flooring and Carpet throughout, fresh paint, new light fixtures and new door handles. There is a living room with a deck leading outside, nice kitchen with lots of cabinets and a dining room. All appliances convey. These units make great investment properties to rent out for a great return on your investment or make great owner occupied units. This is a move in ready unit.
-
2023-03-13soldstatus $66,000
-
2023-03-10soldstatus $66,000 Closed 196-char remark
Show marketing remark (196 chars)
* Showings start Monday 1/30 * Over 1200 sq. Nicely maintained Condo, new counter tops, new HVAC system, updated bath and kitchen offering, 3 bedroom 2 bath Condo in Cabin Creek. Tenant occupied.
-
2023-01-24$50,000 Active 196-char remark
Show marketing remark (196 chars)
* Showings start Monday 1/30 * Over 1200 sq. Nicely maintained Condo, new counter tops, new HVAC system, updated bath and kitchen offering, 3 bedroom 2 bath Condo in Cabin Creek. Tenant occupied.
-
2019-12-23soldstatus $23,000
-
2019-01-25soldstatus $18,500
-
2019-01-25soldstatus $18,500
-
2018-12-27$20,000
-
2004-05-04soldstatus $39,000
ⓘ Source: listings_history table (triggers on properties + properties_extension) + one-shot
backfill from property_details.listing_events for pre-trigger history.
Tax reassessment forecast VA · Resets to sale price
- Current annual tax
- $286 · $24/mo
- Projected year-2 tax
- $861 · $72/mo
- Expected delta
- +$575/yr (+$48/mo · 200.7%)
ⓘ Screening estimate from a state-policy table — verify with the county assessor before closing.
Nearby sold comps map
Loading sold comps map…
Walkable amenities ~0.75 mi
Loading nearby amenities…
Taxation est. · year 1
- Rental income
- $16,258
- − Mortgage interest
- −$5,882
- − Property taxes
- −$286
- − Insurance
- −$525
- − Repairs & maintenance
- −$1,301
- − Management
- −$1,301
- − Depreciation
- −$3,055
- Taxable income
- $3,909
- Est. tax owed @ 24.0%
- −$938
- After-tax cash flow
- $4,487/yr
For passive investors: Depreciation is non-cash, so a rental often shows a tax loss while cash-flowing — sheltering income. Rental losses are passive: they offset passive income freely, and up to $25,000/yr can offset ordinary (W-2) income if you actively participate and your MAGI is under $100k (phasing out to $0 by $150k); unused losses carry forward. On sale, claimed depreciation is recaptured at up to 25%, and gains may owe capital-gains tax (a 1031 exchange can defer both). Figures are a year-1 estimate at your 24.0% rate — not tax advice; consult a CPA.
Schools (NCES district)
- District
- Danville City Public School District
- NCES district ID
- 5101110
- Math proficiency
- 30% ▼ -22.00%
- Reading proficiency
- 44% ▼ -8.00%
- Median HH income
- $31,952
- Composite
- 30.23/100
- National rank
- #6298
- State rank
- #128 of 131 in VA
Livability — Danville
- Score
- 77/100
- State rank
- #91
- US rank
- #2952
Category grades
Schools grade is shown separately in the Schools card above.
Census & demographics
- Census place
- Danville, VA
- County
- Danville City · 59,055 people
- City population
- 59,055
- Metro
- Danville, VA
- Population (ZIP)
- 31,013
- Household income
- $47,924
- Rent vs Own
- Severe rent burden
- 1170.0
Population outlook (Danville County) Hauer SSP2
- Today (2025)
- 40,989 people
- By 2030
- 40,432 · -1.4%
- By 2040
- 39,255 · -4.2%
- By 2050
- 38,035 · -7.2%
- By 2075
- 35,612 · -13.1%
- By 2100
- 30,365 · -25.9%
Race, ethnicity, and origin ACS 2023
- Neighborhood character
- Diverse neighborhood (Simpson 0.57)
- Race & ethnicity
- White 50% Black 42% Two or more races 5% Hispanic / Latino 4%
- Common ancestry
- Slovak 1% Lithuanian 1% Serbian 1%
- Foreign-born
- 2% · Canada
- Languages at home
- 97% English-only · Spanish 2%
Political lean MEDSL · Danville
- 2024 margin
- Strong D (+21.1) · D 60.1% · R 39.0%
- 2008→2024 swing
- +1.9pp toward D · 2008: 19.1pp · 2024: 21.1pp
- All cycles
- 2024: D+21.1 2020: D+22.1 2016: D+19.9 2012: D+22.1 2008: D+19.1
Not yet ingested
- Civics
- —
Market trends
- HPI YoY
- ▼ -58.79%
- Current HPI
- 235.1746
- Rent YoY
- —
- Metro
- Danville, VA
- State GDP YoY
- ▲ 2.40%
- F500 in state
- 50
Industry mix (Fortune 500 HQ in VA)
| Industry | F500 HQs | Revenue |
|---|---|---|
| Aerospace / Defense | 4 | $236B |
|
||
| Technology / Defense | 3 | $32B |
|
||
| Financial Services | 2 | $176B |
|
||
| Utilities | 2 | $27B |
|
||
| Insurance | 2 | $25B |
|
||
| Technology | 2 | $15B |
|
||
Price history
+169.2% since first listed11 events — show timeline
- 2025-10-08 Relisted — DRRAR
- 2025-05-18 Contingent — DRRAR
- 2024-11-22 Listed $105,000 DRRAR
- 2023-03-13 Sold (Public Records) $66,000 Public Records
- 2023-03-10 Sold (MLS) $66,000 DRRAR
- 2023-01-24 Listed $50,000 DRRAR
- 2019-12-23 Sold (Public Records) $23,000 Public Records
- 2019-01-25 Sold (Public Records) $18,500 Public Records
- 2019-01-25 Sold (MLS) $18,500 DRRAR
- 2018-12-27 Listed $20,000 DRRAR
- 2004-05-04 Sold (Public Records) $39,000 Public Records
Property tax history
+1.1%/yrLatest (2025): $286 · +0.0% YoY. Source: county tax records.
Cash-flow waterfall
monthlySold comps — $/sqft
last 12 mo · ≤1 miLoading sold comps…