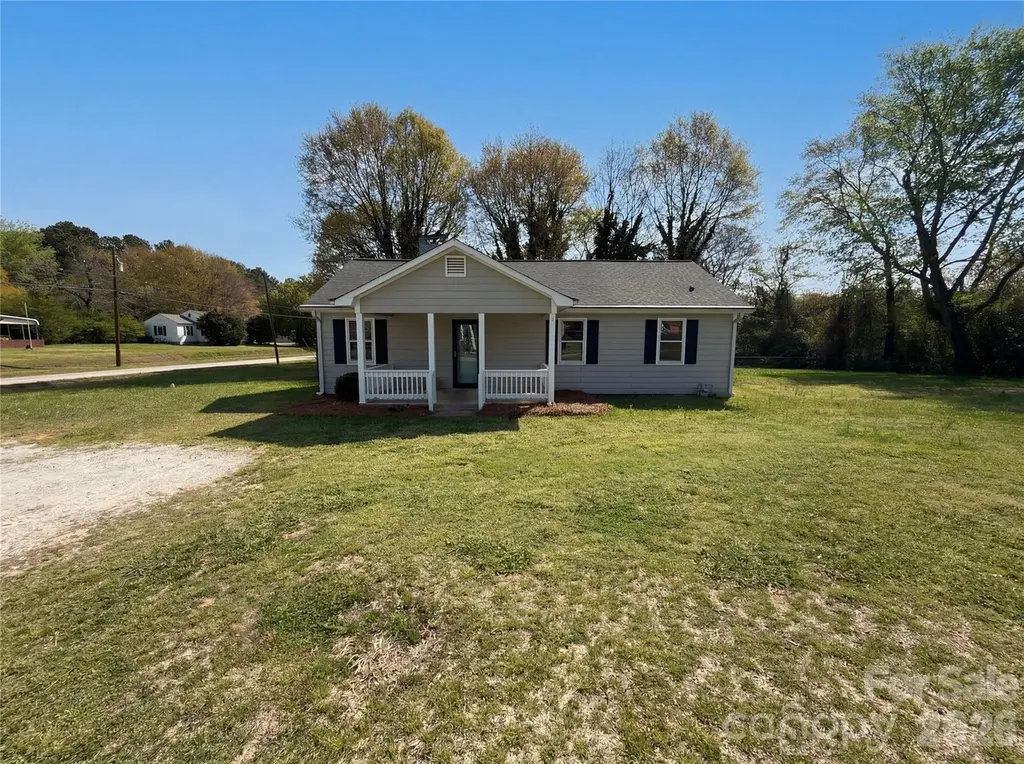
1114 Grace Ave · Irwin, SC
Flood risk 1/10 · Minimal
- FEMA flood zone
- X (unshaded)
- Chance of flooding over 30 yrs
- 0.0%
- Est. flood insurance / yr
- $507 – $1,088
Fire risk 4/10 · Minor
- Est. fire insurance / yr
- $783 – $1,453
Heat risk 6/10 · Moderate
- Hot days now (above 106°F)
- 7 days/yr
- Hot days in 30 yrs
- 16 days/yr
Wind risk 6/10 · Moderate
- Chance of severe wind over 30 yrs
- 40.0%
Air-quality risk 2/10 · Minimal
- Unhealthy air days now
- 2 days/yr
- Unhealthy air days in 30 yrs
- 2 days/yr
Risk factors via First Street. Map © Google.
Why this score? — see what drove the C grade
The composite is a weighted blend of 9 inputs, each scored 0–100. Each bar is that input's sub-score; the figure is the points it added to the 100-point composite (weight × sub-score).
- Cash flow +20.1/30.0
- ARV discount +14.0/15.0
- DSCR +6.4/10.0
- 1% rule +4.0/10.0
- Schools +3.7/10.0
- Livability +2.8/5.0
- Rent growth +2.5/5.0
- Condition / age +2.5/5.0
- Appreciation +0.0/10.0
$195,000
🖨 Deal sheet (PDF) 📄 Offer letter ✓ Due diligence
Listing remarks
Discover the potential of this charming 3-bedroom, 1-bath cottage in the heart of Lancaster! Situated on a spacious lot, this 1948 home offers a great opportunity for first-time buyers to build equity or for investors seeking their next project. The property features a functional layout with classic character, ready for your personal touch. Conveniently located just minutes from local dining, shopping, and downtown amenities. Whether you're searching for a cozy home or a renovation opportunity, 1114 Grace Ave is full of possibilities.
Key facts
- Spacious lot
- Functional layout
- Conveniently located
Tags
Property features AI
Finance
- Other: Zoned MDR
- HOA & community: No HOA
Exterior
- Parking: Driveway
- Utilities: City water; Public sewer
- Home design: Single-family residence; Residential property; One-story; Entry/main level living
- Construction: Site-built construction; Aluminum and vinyl exterior; Crawl space foundation; Built on one level
- Exterior features: Gravel and paved road access; Publicly maintained road
Interior
- Kitchen: Electric oven; Electric range; Refrigerator
- Bedrooms: 3 bedrooms on the main level
- Bathrooms: 1 full bathroom on the main level
- Heating & cooling: Central heating; Central air conditioning
- Interior features: Fireplace; 2 total rooms
- Laundry & utility: Mud room laundry
Neighborhood map
What this means for you Summary
Snapshot
- This is a 3-bed/1.0-bath single-family listed at $195k.
Deal economics
- At list price, monthly cash flow is $242 ($3k/yr) — positive.
- The deal already cash-flows at list — no discount required.
- To meet the 1% rule (rent ≥ 1% of price), the offer needs to be $176k (9.6% below list).
- Recommended offer: $176k (9.6% below list) — sets the bar for 1% rule.
Location & tenants
- Location reads 56/100 on livability (#292 in SC) — a working-class tenant base; expect higher turnover. Strengths: cost of living A+, housing A+, crime A-; Watch: schools F, amenities F, commute F.
- Lancaster 01 (rural): math 41% / reading 47% proficiency, ranked #26 of 80 in SC (top 32%) — families likely to look elsewhere, expect single-tenant / working-renter base with shorter leases.
- Market conditions: 685 active listings in the ZIP; 2 comparable units currently listed for rent nearby; 976 units permitted in Lancaster County in 2024 (0 in 5+ unit buildings).
- This rent runs 34% of the median local income ($63k/yr) — at the standard rent-burdened threshold; future hikes will face affordability resistance.
Forward outlook
- Local home prices are declining (-3.0%/yr); year-one equity from $1k of loan paydown is wiped out by about $6k of value loss. Plan a longer hold.
- Lancaster County population projected at +40% by 2050 — long-run rental-demand tailwind backs the buy-and-hold thesis.
Negotiation context
- Only 14 days on market — expect competitive offers; lowballing is unlikely to land.
- 2 sale attempts with the ask held roughly flat each time — persistent listings suggest the price (not the market) is what's stuck; bring a comps-based counter.
Risks & watch-outs
- Watch-outs: built in 1948 — expect roof / HVAC / electrical / plumbing capex.
- Climate carrying-cost: major wind risk, 40% chance of damaging wind over 30y; extreme-heat days projected 7→16/yr by 2055 (HVAC capex compounding) — expect insurance premiums to compound above CPI over the hold.
Questions for the listing agent
- Built in 1948 — when were the roof, HVAC, electrical panel, plumbing, and water heater last replaced?
- Is there a deadline driving the sale (1031 exchange, divorce, estate, relocation)? That informs how much negotiation room exists.
- Schools are F-rated, which usually means shorter tenancies and higher turnover. Who's the typical renter profile here, and what's been the actual vacancy rate?
- What's the average days-on-market for RENTAL listings here right now (not sales)? A rising rental-DOM trend means longer vacancies and softer asking-rent achievability than the comps imply.
- What's the recent tenant-quality profile in this submarket — average credit score on applications, eviction rate, late-payment / NSF rate, and stable-employment percentage? A property-management company in the area should have these aggregated.
- How much new for-sale + rental construction is in the pipeline within 1–3 miles? Heavy new supply typically softens prices + rents 12–24 months out; constrained supply supports both.
Investment metrics
- 1% rule
- 0.90% ✗
- Cap rate
- 7.78%
- Cash-on-cash
- 5.33%
- DSCR
- 1.24
- GRM
- 9.2
CMA / ARV
- ARV (on-the-fly)
- $227,698
- Comps found
- 12
Show comp detail 12 sales within ~0.75 mi
| Address | Dist | Beds/Ba | Sqft | Sold | Price | $/sf | Match |
|---|---|---|---|---|---|---|---|
| 951 Confederate Ave | 0.19mi | 3/2.0 | 1,250 (-1%) | 2mo | $240,000 | $192 | 84 |
| 1055 Laurel Ave | 0.08mi | 3/2.0 | 1,294 (+3%) | 12mo | $245,000 | $189 | 78 |
| 1048 Old Thompson Ave | 0.23mi | 3/1.0 | 1,161 (-8%) | 1mo | $186,000 | $160 | 75 |
| 1015 Grace Ave | 0.24mi | 2/2.0 (-1) | 1,283 (+2%) | 9mo | $212,000 | $165 | 69 |
| 1227 Laurel Ave | 0.34mi | 3/2.0 | 1,345 (+7%) | 3mo | $190,000 | $141 | 66 |
| 949 Grace Ave | 0.39mi | 3/1.0 | 1,115 (-11%) | 13mo | $135,000 | $121 | 52 |
| 1115 Old Thompson Ave | 0.29mi | 2/2.0 (-1) | 1,118 (-11%) | 12mo | $270,000 | $242 | 49 |
| 1652 Pinewood Ave | 0.74mi | 3/2.0 | 1,296 (+3%) | 12mo | $225,500 | $174 | 47 |
| 1140 Confederate Ave #11 | 0.44mi | 3/1.5 | 1,106 (-12%) | 17mo | $165,000 | $149 | 43 |
| 1192 Hampton Grace Ave | 0.51mi | 3/2.0 | 1,438 (+14%) | 9mo | $260,000 | $181 | 41 |
| 1397 Grace Ave | 0.66mi | 2/1.0 (-1) | 1,077 (-14%) | 6mo | $201,000 | $187 | 35 |
| 1459 Erwin St | 0.66mi | 2/2.0 (-1) | 1,144 (-9%) | 15mo | $219,900 | $192 | 32 |
Match score weights: distance 35% · size 25% · config 20% · recency 20%. Top-matched comps best support the ARV.
Projected returns pro-forma
-3.0% appreciation · 3.0% rent growth · sell at horizon
- IRR
- -8.1%
- Equity multiple
- 0.70×
- Total profit
- $-16,253
- Equity at exit
- $29,075
- IRR
- 1.4%
- Equity multiple
- 1.10×
- Total profit
- $5,345
- Equity at exit
- $16,860
Cash invested: $54,600 (down + closing). Projections, not guarantees.
Landlord ↔ Tenant lean methodology
- Overall (STATE)
- 90 Strongly Landlord-Friendly
- State South Carolina
- 90 Strongly Landlord-Friendly · R+6
- County
- — inherits STATE
- City
- — inherits STATE
ZIP-level market 29720
- Home prices YoY
- -28.2%
- Active inventory
- 685
- Price-to-rent
- 9.2×
Monthly cashflow live
- Estimated rent
- $1,764 medium interval (Pro) →
- Mortgage (P&I)
- −$1,023
- Tax from tax record
- −$47 /mo · $565/yr
- Insurance
- −$81
- HOA
- −$0
- Lot rent
- −$0
- Vacancy / Maint / Mgmt
- −$370
- Net cashflow
- $242
Break-even live
Sensitivity live
| Price | -10% $353 | -5% $298 | +0% $242 | +5% $187 | +10% $132 |
|---|---|---|---|---|---|
| Rent | -10% $103 | -5% $173 | +0% $242 | +5% $312 | +10% $382 |
| Rate | -1.0pp $341 | -0.5pp $292 | base $242 | +0.5pp $192 | +1.0pp $140 |
UW: 25.0% down · 7.5% · 30yr · 1.5% tax · 5.0% vac · 8.0% maint · 8.0% mgmt
Financing live
Cash to close
- Down payment
- $48,750
- Closing costs
- $5,850
- Reserves months
- —
- Total cash needed
- —
Loan-product check · same deal, 3 products live
Conventional
25% down · 7.5% · 30yr
- Down + closing
- —
- Monthly P&I
- —
- Monthly cashflow
- —
- DSCR
- —
- Eligible?
- —
Personal DTI + credit; lowest rate.
DSCR
20% down · 8.5% · 30yr
- Down + closing
- —
- Monthly P&I
- —
- Monthly cashflow
- —
- DSCR
- —
- Eligible?
- —
No personal income docs; deal must DSCR.
Hard money
10% down · 12.0% · 12mo
- Down + closing
- —
- Monthly P&I
- —
- Monthly cashflow
- —
- DSCR
- —
- Eligible?
- —
Short-term bridge; refi at stabilization.
Rent comps 2 comps
| Address | Beds | Baths | Sqft | Rent | $/sqft | DOM | Units | Dist |
|---|---|---|---|---|---|---|---|---|
| 1080 Grace Ave Lancaster, SC | 3.0 | 1.0 | 1292 | $1,800 | $1.39 | 0d | 1 | 0.06mi |
| 1208 Grace Ave Lancaster, SC | 2.0 | 1.0 | 1344 | $1,200 | $0.89 | 0d | 1 | 0.24mi |
Listing history 6 events
-
2026-04-28status Pending
-
2026-04-21status Active
-
2026-04-10status Pending
-
2026-04-03$195,000 Active
-
2026-03-10soldstatus $195,077
-
2006-07-28soldstatus $82,000
ⓘ Source: listings_history table (triggers on properties + properties_extension) + one-shot
backfill from property_details.listing_events for pre-trigger history.
Tax reassessment forecast SC · Resets to sale price
- Current annual tax
- $565 · $47/mo
- Projected year-2 tax
- $1,112 · $93/mo
- Expected delta
- +$547/yr (+$46/mo · 96.7%)
ⓘ Screening estimate from a state-policy table — verify with the county assessor before closing.
Climate risk First Street
- Flood 1/10 Low FEMA zone X (unshaded) · 0% chance over 30 yrs
- Wildfire 4/10 Moderate
- Heat 6/10 Major 7 d/yr ≥106°F today · 16 d/yr by 30 yrs out
- Wind 6/10 Major 40% chance of damaging wind over 30 yrs
- Air quality 2/10 Low 2 unhealthy d/yr today · 2 by 30 yrs out
Nearby sold comps map
Loading sold comps map…
Walkable amenities ~0.75 mi
Loading nearby amenities…
Taxation est. · year 1
- Rental income
- $21,165
- − Mortgage interest
- −$10,923
- − Property taxes
- −$565
- − Insurance
- −$975
- − Repairs & maintenance
- −$1,693
- − Management
- −$1,693
- − Depreciation
- −$5,673
- Taxable loss
- −$357
- Est. tax savings @ 24.0%
- +$86
- After-tax cash flow
- $2,995/yr
For passive investors: Depreciation is non-cash, so a rental often shows a tax loss while cash-flowing — sheltering income. Rental losses are passive: they offset passive income freely, and up to $25,000/yr can offset ordinary (W-2) income if you actively participate and your MAGI is under $100k (phasing out to $0 by $150k); unused losses carry forward. On sale, claimed depreciation is recaptured at up to 25%, and gains may owe capital-gains tax (a 1031 exchange can defer both). Figures are a year-1 estimate at your 24.0% rate — not tax advice; consult a CPA.
Schools (NCES district)
- District
- Lancaster 01
- NCES district ID
- 4502580
- Math proficiency
- 41% ▼ -7.00%
- Reading proficiency
- 47% ▼ -1.00%
- Median HH income
- $44,165
- Composite
- 37.23/100
- National rank
- #4462
- State rank
- #26 of 80 in SC
Livability — Irwin
- Score
- 56/100
- State rank
- #292
- US rank
- #22667
Category grades
Schools grade is shown separately in the Schools card above.
Census & demographics
- Census place
- Irwin, SC
- County
- Lancaster County · 91,213 people
- Metro
- Charlotte-Concord-Gastonia, NC-SC
- Population (ZIP)
- 53,584
- Household income
- $62,969
- Rent vs Own
- Severe rent burden
- 1158.0
Population outlook (Lancaster County) Hauer SSP2
- Today (2025)
- 105,572 people
- By 2030
- 114,865 · +8.8%
- By 2040
- 132,268 · +25.3%
- By 2050
- 148,252 · +40.4%
- By 2075
- 182,540 · +72.9%
- By 2100
- 202,237 · +91.6%
Race, ethnicity, and origin ACS 2023
- Neighborhood character
- Majority White (62%)
- Race & ethnicity
- White 62% Black 26% Hispanic / Latino 8% Two or more races 5%
- Hispanic origin (detail)
- Mexican 4%
- Common ancestry
- Slovak 3% Serbian 2% Romanian 1%
- Foreign-born
- 6% · Canada
- Languages at home
- 91% English-only · Spanish 7% Other Indo-European 1%
Political lean MEDSL · Lancaster
- 2024 margin
- Strong R (+24.8) · D 37.0% · R 61.8% · Other 1.2%
- 2008→2024 swing
- -9.9pp toward R · 2008: -14.9pp · 2024: -24.8pp
- All cycles
- 2024: R+24.8 2020: R+22.8 2016: R+25.5 2012: R+18.0 2008: R+14.9
Not yet ingested
- Civics
- —
Market trends
- HPI YoY
- ▼ -95.90%
- Current HPI
- 244.328
- Rent YoY
- —
- Metro
- Charlotte-Concord-Gastonia, NC-SC
- State GDP YoY
- ▲ 4.51%
- F500 in state
- 2
Industry mix (Fortune 500 HQ in SC)
| Industry | F500 HQs | Revenue |
|---|---|---|
| Packaging | 1 | $7B |
|
||
Price history
+137.8% since first listed6 events — show timeline
- 2026-04-28 Pending — CANOPYMLS as Distributed by MLS Grid
- 2026-04-21 Relisted — CANOPYMLS as Distributed by MLS Grid
- 2026-04-10 Pending — CANOPYMLS as Distributed by MLS Grid
- 2026-04-03 Listed $195,000 CANOPYMLS as Distributed by MLS Grid
- 2026-03-10 Sold (Public Records) $195,077 Public Records
- 2006-07-28 Sold (Public Records) $82,000 Public Records
Property tax history
+2.6%/yrLatest (2025): $565 · +9.2% YoY. Source: county tax records.
Cash-flow waterfall
monthlySold comps — $/sqft
last 12 mo · ≤1 miLoading sold comps…