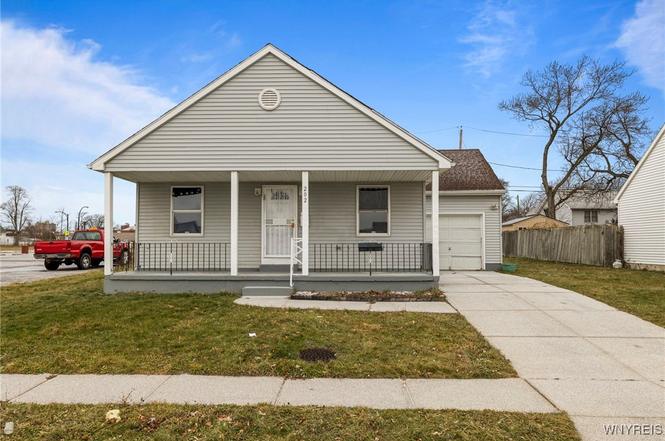
202 Purdy St · Buffalo, NY
Flood risk 1/10 · Minimal
- FEMA flood zone
- X (unshaded)
- Chance of flooding over 30 yrs
- 0.0%
- Est. flood insurance / yr
- $473 – $860
Fire risk 1/10 · Minimal
- Est. fire insurance / yr
- $691 – $1,283
Heat risk 3/10 · Minor
- Hot days now (above 91°F)
- 7 days/yr
- Hot days in 30 yrs
- 15 days/yr
Wind risk 1/10 · Minimal
- Chance of severe wind over 30 yrs
- —
Air-quality risk 4/10 · Minor
- Unhealthy air days now
- 4 days/yr
- Unhealthy air days in 30 yrs
- 9 days/yr
Risk factors via First Street. Map © Google.
Why this score? — see what drove the F grade
The composite is a weighted blend of 9 inputs, each scored 0–100. Each bar is that input's sub-score; the figure is the points it added to the 100-point composite (weight × sub-score).
- Cash flow +12.7/30.0
- Livability +3.9/5.0
- DSCR +3.8/10.0
- 1% rule +3.6/10.0
- Schools +3.3/10.0
- Rent growth +2.5/5.0
- Condition / age +2.5/5.0
- ARV discount +0.0/15.0
- Appreciation +0.0/10.0
$199,900
🖨 Deal sheet 📄 Offer letter ✓ Due diligence
Listing remarks
Welcome to 202 Purdy St, Buffalo, NY 14208. This well laid out home was built in 1993 and offers 3 bedrooms and 1 full bathroom with a comfortable living room, formal dining area, and a functional kitchen. The property features a full basement providing ample storage or additional potential living space, along with an attached car garage for added convenience. A solid opportunity for owner occupants or investors looking to add value. Conveniently located near shopping, dining, and major routes. Don’t miss the chance to make this property your own.
Key facts
- Attached car garage
- Full basement
- 6,300 sq ft lot
Tags
Neighborhood map
What this means for you Summary
Snapshot
- This is a 3-bed/1.0-bath single-family listed at $200k.
Deal economics
- At list price, monthly cash flow is $-20 ($-242/yr) — negative.
- To cash-flow at today's rent, offer at most $197k (1.5% below list).
- To meet the 1% rule (rent ≥ 1% of price), the offer needs to be $172k (13.8% below list).
- Recommended offer: $172k (13.8% below list) — sets the bar for 1% rule.
- Cap rate 6.2% vs local median 8.0% in Buffalo — below-typical yield; the buyer is paying a premium for something (appreciation thesis, condition, location) that the cap rate doesn't capture.
Location & tenants
- Location reads 77/100 on livability (#195 in NY, #3,011 nationally) — a middle-class / working-renter tenant base. Strengths: commute A+, housing A+, health & safety A+; Watch: crime F, employment D-.
- Buffalo City School District (urban): math 41% / reading 40% proficiency, ranked #535 of 590 in NY (top 91%) — families likely to look elsewhere, expect single-tenant / working-renter base with shorter leases; 75% free/reduced lunch — lower-income household profile, screen leases tightly.
- Market conditions: 54 active listings in the ZIP; 40 comparable units currently listed for rent nearby; rentals at typical pace (median 24d on market — plan ~3-4 weeks tenant-placement turnaround); 40% of comp listings sitting > 30 days — soft ceiling on asking rent; 1,244 units permitted in Erie County in 2024 (563 in 5+ unit buildings).
- This rent runs 43% of the median local income ($48k/yr) — at the standard rent-burdened threshold; future hikes will face affordability resistance.
Forward outlook
- Local home prices are declining (-3.0%/yr); year-one equity from $1k of loan paydown is wiped out by about $6k of value loss. Plan a longer hold.
Negotiation context
- It's been on market 117 days — a 9% lower offer ($182k) is reasonable based on typical stale-listing flexibility.
- 2 sale attempts since 2y ago with the ask held roughly flat each time — persistent listings suggest the price (not the market) is what's stuck; bring a comps-based counter.
- Current owner paid $80k; list at $200k implies a 150% gain — meaningful room to come down on a strong offer.
Questions for the listing agent
- What do current leases actually rent for vs. the listed asking? Can we see a recent rent roll and the last 12 months of T-12 income?
- It's been on market 117 days. Have you received any prior offers? Is the seller open to a 14% concession, seller financing, or rate buy-down credit?
- Why hasn't it sold? Are there any deal-killer items the seller is aware of (foundation, flood, title, zoning, code violations)?
- Is there a deadline driving the sale (1031 exchange, divorce, estate, relocation)? That informs how much negotiation room exists.
- Crime grade is F in this area — have there been break-ins, vandalism, or insurance claims at this property in the last 3 years? What carrier currently insures it and at what premium?
- The area grade is low — what's the realistic commute time and amenity access for the typical tenant pool here? Any planned neighborhood developments (good or bad) we should know about?
- What's the average days-on-market for RENTAL listings here right now (not sales)? A rising rental-DOM trend means longer vacancies and softer asking-rent achievability than the comps imply.
- What's the recent tenant-quality profile in this submarket — average credit score on applications, eviction rate, late-payment / NSF rate, and stable-employment percentage? A property-management company in the area should have these aggregated.
- How much new for-sale + rental construction is in the pipeline within 1–3 miles? Heavy new supply typically softens prices + rents 12–24 months out; constrained supply supports both.
Investment metrics
- 1% rule
- 0.86% ✗
- Cap rate
- 6.17%
- Cash-on-cash
- -0.43%
- DSCR
- 0.98
- GRM
- 9.7
CMA / ARV
- ARV (on-the-fly)
- $143,960
- Comps found
- 7
Show comp detail 7 sales within ~0.75 mi
| Address | Dist | Beds/Ba | Sqft | Sold | Price | $/sf | Match |
|---|---|---|---|---|---|---|---|
| 71 Chester St | 0.12mi | 3/1.5 | 1,300 (+7%) | 2mo | $250,000 | $192 | 80 |
| 119 Purdy St | 0.16mi | 4/2.0 (+1) | 1,269 (+4%) | 18mo | $150,000 | $118 | 62 |
| 86 Verplanck St | 0.16mi | 4/1.5 (+1) | 1,258 (+3%) | 22mo | $115,000 | $91 | 62 |
| 378 Northland Ave | 0.61mi | 3/2.0 | 1,183 (-3%) | 9mo | $125,000 | $106 | 55 |
| 1319 Michigan Ave | 0.52mi | 3/1.5 | 1,301 (+7%) | 22mo | $155,000 | $119 | 44 |
| 1274 Michigan Ave | 0.61mi | 3/1.5 | 1,152 (-6%) | 23mo | $213,000 | $185 | 41 |
| 352 Florida St | 0.64mi | 3/2.0 | 1,150 (-6%) | 23mo | $70,000 | $61 | 38 |
Match score weights: distance 35% · size 25% · config 20% · recency 20%. Top-matched comps best support the ARV.
Projected returns pro-forma
-3.0% appreciation · 3.0% rent growth · sell at horizon
- IRR
- -17.0%
- Equity multiple
- 0.40×
- Total profit
- $-33,648
- Equity at exit
- $29,806
- IRR
- -8.9%
- Equity multiple
- 0.45×
- Total profit
- $-30,845
- Equity at exit
- $17,284
Cash invested: $55,972 (down + closing). Projections, not guarantees.
Landlord ↔ Tenant lean methodology
- Overall (STATE)
- 15 Strongly Tenant-Friendly
- State New York
- 15 Strongly Tenant-Friendly · D+10
- County
- — inherits STATE
- City
- — inherits STATE
ZIP-level market 14208
- Home prices YoY
- -3.4%
- Active inventory
- 54
- Price-to-rent
- 9.7×
Monthly cashflow live
- Estimated rent
- $1,723 high interval (Pro) →
- Mortgage (P&I)
- −$1,048
- Tax est. 1.5%
- −$250 /mo · $2,998/yr
- Insurance
- −$83
- HOA
- −$0
- Vacancy / Maint / Mgmt
- −$362
- Net cashflow
- $-20
Break-even live
UW: 25.0% down · 7.5% · 30yr · 1.5% tax · 5.0% vac · 8.0% maint · 8.0% mgmt
Financing live
Cash to close
- Down payment
- $49,975
- Closing costs
- $5,997
- Reserves months
- —
- Total cash needed
- —
Loan-product check · same deal, 3 products live
Conventional
25% down · 7.5% · 30yr
- Down + closing
- —
- Monthly P&I
- —
- Monthly cashflow
- —
- DSCR
- —
- Eligible?
- —
Personal DTI + credit; lowest rate.
DSCR
20% down · 8.5% · 30yr
- Down + closing
- —
- Monthly P&I
- —
- Monthly cashflow
- —
- DSCR
- —
- Eligible?
- —
No personal income docs; deal must DSCR.
Hard money
10% down · 12.0% · 12mo
- Down + closing
- —
- Monthly P&I
- —
- Monthly cashflow
- —
- DSCR
- —
- Eligible?
- —
Short-term bridge; refi at stabilization.
Rent comps 40 comps
| Address | Beds | Baths | Sqft | Rent | $/sqft | DOM | Units | Dist |
|---|---|---|---|---|---|---|---|---|
| 76 Chester St Unit 1 Buffalo, NY | 3.0 | 1.0 | 1100 | $1,000 | $0.91 | 14d | 1 | 0.13mi |
| 102 Florida St Buffalo, NY | 3.0 | 1.0 | 1296 | $1,650 | $1.27 | 43d | 1 | 0.32mi |
| 1786 Main St Unit 103 Buffalo, NY | 2.0 | 1.5 | 1110 | $1,677 | $1.51 | 43d | 1 | 0.37mi |
| 1786 Main St Unit 104 Buffalo, NY | 2.0 | 2.0 | 1256 | $1,875 | $1.49 | 43d | 1 | 0.37mi |
| 104 Butler Ave Buffalo, NY | 3.0 | 1.0 | 1000 | $1,400 | $1.40 | 43d | 1 | 0.45mi |
| 19 E Utica St Unit 203 Buffalo, NY | 2.0 | 1.0 | 850 | $1,300 | $1.53 | 14d | 1 | 0.53mi |
| 238 Oxford Ave Unit Upper Buffalo, NY | 3.0 | 1.0 | 1100 | $1,600 | $1.45 | 23d | 1 | 0.54mi |
| 1165 Delaware Ave Buffalo, NY | 1.0–2.0 | 1.0 | 658 | $1,250 | $1.90 | 43d | 1 | 0.59mi |
| 184 Butler Ave Unit 1545840P Buffalo, NY | 4.0 | 1.0 | 1496 | $3,226 | $2.16 | 14d | 1 | 0.59mi |
| 179 Donaldson Rd Buffalo, NY | 3.0 | 1.0 | 1152 | $1,350 | $1.17 | 3d | 1 | 0.60mi |
| 1310 Delaware Ave Buffalo, NY | 2.0 | 1.0 | 684 | $1,275 | $1.86 | 43d | 1 | 0.65mi |
| 88 W Utica St Unit 1 Buffalo, NY | 3.0 | 2.0 | 990 | $2,150 | $2.17 | 2d | 1 | 0.72mi |
| 88 W Utica St Unit 1 Buffalo, NY | 3.0 | 2.0 | 990 | $2,150 | $2.17 | 14d | 1 | 0.72mi |
| 1040 Delaware Ave Buffalo, NY | 1.0–2.0 | 1.0 | 687 | $1,500 | $2.18 | 3d | 4 | 0.75mi |
| 1145 Michigan Ave Buffalo, NY | 2.0 | 1.0–2.0 | 655 | $2,049 | $3.13 | 43d | 1 | 0.84mi |
| 75 Inwood Pl Unit Lower Buffalo, NY | 2.0 | 1.0 | 1175 | $1,550 | $1.32 | 43d | 1 | 0.86mi |
| 916 Delaware Ave Buffalo, NY | 2.0 | 1.0 | 750 | $1,625 | $2.17 | 3d | 9 | 0.88mi |
| 121 Humboldt Pkwy Unit B Buffalo, NY | 2.0 | 1.0 | 1265 | $1,750 | $1.38 | 43d | 1 | 0.89mi |
| 117 Humboldt Pkwy Unit B Buffalo, NY | 2.0 | 1.0 | 840 | $1,850 | $2.20 | 43d | 1 | 0.90mi |
| 117 Humboldt Pkwy Unit A Buffalo, NY | 3.0 | 1.0 | 1105 | $2,300 | $2.08 | 43d | 1 | 0.90mi |
| 1155 Main St Buffalo, NY | 2.0 | 1.0–2.0 | 592 | $2,300 | $3.88 | 43d | 1 | 0.90mi |
| 107 Humboldt Pkwy Unit A Buffalo, NY | 2.0 | 1.0 | 1172 | $1,995 | $1.70 | 43d | 1 | 0.91mi |
| 1560 Delaware Ave Unit 1 Buffalo, NY | 3.0 | 1.0 | 1000 | $2,800 | $2.80 | 23d | 1 | 0.91mi |
| 2 Agassiz Cir Unit B Buffalo, NY | 2.0 | 1.0 | 983 | $2,050 | $2.09 | 23d | 1 | 0.94mi |
| 2 Agassiz Cir Unit A Buffalo, NY | 2.0 | 1.0 | 1076 | $2,150 | $2.00 | 23d | 1 | 0.94mi |
| 685 Auburn Ave Unit 2 Buffalo, NY | 3.0 | 1.0 | 1200 | $1,750 | $1.46 | 14d | 1 | 0.94mi |
| 685 Auburn Ave Buffalo, NY | 2.0 | 1.0 | 1200 | $1,600 | $1.33 | 44d | 1 | 0.94mi |
| 888 Delaware Ave Buffalo, NY | 2.0 | 1.0–2.0 | 899 | $2,440 | $2.71 | 23d | 1 | 0.95mi |
| 1152 Main St Apt 3 Buffalo, NY | 3.0 | 1.0 | 1000 | $2,400 | $2.40 | 14d | 1 | 0.95mi |
| 130 Linwood Ave Buffalo, NY | 2.0 | 1.0 | 900 | $1,900 | $2.11 | 23d | 1 | 0.97mi |
| 664 Auburn Ave Unit 2 Buffalo, NY | 2.0 | 1.0 | 900 | $2,200 | $2.44 | 43d | 1 | 0.98mi |
| 408 Winslow Ave Unit 2 Buffalo, NY | 3.0 | 1.0 | 1000 | $1,050 | $1.05 | 14d | 1 | 1.00mi |
| 825 Forest Ave Unit 1 Buffalo, NY | 3.0 | 1.0 | 1200 | $1,700 | $1.42 | 3d | 1 | 1.00mi |
| 825 Forest Ave Buffalo, NY | 3.0 | 1.0 | 1200 | $2,000 | $1.67 | 23d | 1 | 1.00mi |
| 569 Elmwood Ave Buffalo, NY | 2.0 | 1.0 | 1500 | $1,750 | $1.17 | 11d | 1 | 1.03mi |
| 305 W Utica St Unit B302 Buffalo, NY | 2.0 | 2.0 | 1180 | $2,060 | $1.75 | 14d | 1 | 1.11mi |
| 484 Ashland Ave Unit 9 Buffalo, NY | 2.0 | 1.0 | 800 | $1,250 | $1.56 | 23d | 1 | 1.12mi |
| 19 North St Buffalo, NY | 2.0 | 1.0–2.0 | 1306 | $2,910 | $2.23 | 10d | 7 | 1.14mi |
| 117 Bidwell Pkwy Unit 3 Buffalo, NY | 2.0 | 1.0 | 1192 | $1,500 | $1.26 | 3d | 1 | 1.14mi |
| 1015 Elmwood Ave Unit 3 Buffalo, NY | 2.0 | 2.0 | 1000 | $1,400 | $1.40 | 43d | 1 | 1.17mi |
Listing history 6 events
-
2026-04-26status Pending
-
2025-12-29$199,900 Active
-
2025-01-28historical
-
2024-09-24price $199,900
-
2024-08-30$219,900 Active
-
2005-12-16soldstatus $79,900
ⓘ Source: listings_history table (triggers on properties + properties_extension) + one-shot
backfill from property_details.listing_events for pre-trigger history.
Climate risk First Street
- Flood 1/10 Low FEMA zone X (unshaded) · 0% chance over 30 yrs
- Wildfire 1/10 Low
- Heat 3/10 Moderate 7 d/yr ≥91°F today · 15 d/yr by 30 yrs out
- Wind 1/10 Low
- Air quality 4/10 Moderate 4 unhealthy d/yr today · 9 by 30 yrs out
Nearby sold comps map
Loading sold comps map…
Walkable amenities ~0.75 mi
Loading nearby amenities…
Taxation est. · year 1
- Rental income
- $20,679
- − Mortgage interest
- −$11,198
- − Property taxes
- −$2,998
- − Insurance
- −$1,000
- − Repairs & maintenance
- −$1,654
- − Management
- −$1,654
- − Depreciation
- −$5,815
- Taxable loss
- −$3,641
- Est. tax savings @ 24.0%
- +$874
- After-tax cash flow
- $632/yr
For passive investors: Depreciation is non-cash, so a rental often shows a tax loss while cash-flowing — sheltering income. Rental losses are passive: they offset passive income freely, and up to $25,000/yr can offset ordinary (W-2) income if you actively participate and your MAGI is under $100k (phasing out to $0 by $150k); unused losses carry forward. On sale, claimed depreciation is recaptured at up to 25%, and gains may owe capital-gains tax (a 1031 exchange can defer both). Figures are a year-1 estimate at your 24.0% rate — not tax advice; consult a CPA.
Schools (NCES district)
- District
- Buffalo City School District
- NCES district ID
- 3605850
- Math proficiency
- 41% ▲ 11.00%
- Reading proficiency
- 40% ▲ 7.00%
- Median HH income
- $31,665
- Composite
- 33.17/100
- National rank
- #5544
- State rank
- #535 of 590 in NY
Livability — Buffalo
- Score
- 77/100
- State rank
- #195
- US rank
- #3011
Category grades
Schools grade is shown separately in the Schools card above.
Census & demographics
- Census place
- Buffalo, NY
- County
- Erie County · 714,559 people
- City population
- 440,021
- Metro
- Buffalo-Cheektowaga, NY
- Population (ZIP)
- 12,572
- Household income
- $48,476
- Rent vs Own
- Severe rent burden
- 723.0
Population outlook (Erie County) Hauer SSP2
- Today (2025)
- 933,037 people
- By 2030
- 935,181 · +0.2%
- By 2040
- 928,531 · -0.5%
- By 2050
- 905,725 · -2.9%
- By 2075
- 834,037 · -10.6%
- By 2100
- 708,033 · -24.1%
Race, ethnicity, and origin ACS 2023
- Neighborhood character
- Predominantly Black (72%)
- Race & ethnicity
- Black 72% White 15% Asian 6% Two or more races 4% Hispanic / Latino 3%
- Common ancestry
- Romanian 2% Italian 1% Hispanic 0%
- Foreign-born
- 7% · Canada, South Korea, Philippines
- Languages at home
- 89% English-only · Other Indo-European 3% Spanish 2% French/Haitian/Cajun 1%
Political lean MEDSL · Erie
- 2024 margin
- Lean D (+9.7) · D 54.8% · R 45.2%
- 2008→2024 swing
- -7.9pp toward R · 2008: 17.5pp · 2024: 9.7pp
- All cycles
- 2024: D+9.7 2020: D+14.7 2016: D+4.8 2012: D+15.6 2008: D+17.5
Not yet ingested
- Civics
- —
Market trends
- HPI YoY
- ▼ -16.37%
- Current HPI
- 459.2084
- Rent YoY
- —
- Metro
- Buffalo-Cheektowaga, NY
- State GDP YoY
- ▲ 2.60%
- F500 in state
- 92
Industry mix (Fortune 500 HQ in NY)
| Industry | F500 HQs | Revenue |
|---|---|---|
| Financial Services | 10 | $950B |
|
||
| Consumer Goods | 9 | $162B |
|
||
| Insurance | 4 | $225B |
|
||
| Telecommunications | 2 | $144B |
|
||
| Pharmaceuticals | 2 | $112B |
|
||
| Media / Entertainment | 2 | $69B |
|
||
Price history
+150.2% since first listed6 events — show timeline
- 2026-04-26 Pending — WNYREIS
- 2025-12-29 Listed $199,900 WNYREIS
- 2025-01-28 Listing Removed — WNYREIS
- 2024-09-24 Price Changed $199,900 WNYREIS
- 2024-08-30 Listed $219,900 WNYREIS
- 2005-12-16 Sold (Public Records) $79,900 Public Records
Property tax history
+1.0%/yrLatest (2025): $303 · +0.0% YoY. Source: county tax records.
Cash-flow waterfall
monthlySold comps — $/sqft
last 12 mo · ≤1 miLoading sold comps…