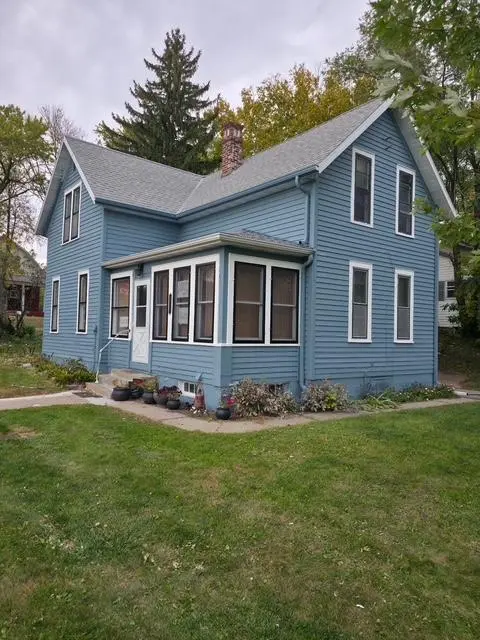
217 1st St NW · Pelican Rapids, MN
Flood risk 1/10 · Minimal
- FEMA flood zone
- —
- Chance of flooding over 30 yrs
- 0.0%
- Est. flood insurance / yr
- —
Fire risk 2/10 · Minimal
- Est. fire insurance / yr
- $888 – $1,650
Heat risk 1/10 · Minimal
- Hot days now (above 95°F)
- 7 days/yr
- Hot days in 30 yrs
- 12 days/yr
Wind risk 2/10 · Minimal
- Chance of severe wind over 30 yrs
- —
Air-quality risk 3/10 · Minor
- Unhealthy air days now
- 2 days/yr
- Unhealthy air days in 30 yrs
- 3 days/yr
Risk factors via First Street. Map © Google.
Why this score? — see what drove the F grade
The composite is a weighted blend of 9 inputs, each scored 0–100. Each bar is that input's sub-score; the figure is the points it added to the 100-point composite (weight × sub-score).
- Cash flow +8.1/30.0
- ARV discount +7.5/15.0
- Schools +4.3/10.0
- Livability +3.9/5.0
- Rent growth +2.5/5.0
- Condition / age +2.5/5.0
- DSCR +2.2/10.0
- 1% rule +1.3/10.0
- Appreciation +0.0/10.0
$220,000
🖨 Deal sheet (PDF) 📄 Offer letter ✓ Due diligence
Listing remarks
This charming older home blends character and comfort with a spacious interior featuring 4 bedrooms and 2 bathrooms. The living room showcases beautiful hardwood flooring, while the dining room and kitchen feature durable laminate wood flooring that adds warmth and style. Situated on a large corner lot, the property provides ample outdoor space for entertaining, gardening, or simply enjoying the large yard. A newer 2-stall garage, built in 2013, adds convenience and functionality. With its combination of charm, space, and a great location, this home is full of potential and ready for its next.
Key facts
- Hardwood flooring
- Newer garage
- Large corner lot
Tags
Property features AI
Exterior
- Parking: Detached or attached 2-car garage (25 x 29); Garage approximately 725 square feet
- Utilities: City water connected; City sewer connected; Electric service (other); Natural gas
- Home design: Residential property; Two levels; Corner lot; Accessible features present
- Construction: Built on poured concrete foundation; Block full basement; Asphalt roof
- Exterior features: Wood exterior
Interior
- Kitchen: Range; Refrigerator; Dishwasher
- Bedrooms: 4 bedrooms
- Bathrooms: Main floor 3/4 bath; Upper level full bath
- Heating & cooling: Forced air heating; No central air
- Interior features: Dryer, Range, Refrigerator, Washer
- Laundry & utility: Washer and Dryer
Neighborhood map
What this means for you Summary
Snapshot
- This is a 4-bed/2.0-bath single-family listed at $220k.
Deal economics
- At list price, monthly cash flow is $-213 ($-3k/yr) — negative.
- To cash-flow at today's rent, offer at most $182k (17.1% below list).
- To meet the 1% rule (rent ≥ 1% of price), the offer needs to be $140k (36.6% below list).
- Recommended offer: $140k (36.6% below list) — sets the bar for 1% rule.
- Cap rate 5.1% vs local median 1.4% in Pelican Rapids — top-decile yield for the area; either an underpriced asset or a hidden risk that comps aren't pricing in. Stress-test before assuming the spread holds.
Location & tenants
- Location reads 78/100 on livability (#114 in MN, #2,581 nationally) — a middle-class / working-renter tenant base. Strengths: crime A+, cost of living A+, housing A+; Watch: amenities F, commute F.
- Pelican Rapids Public School District (rural): math 45% / reading 54% proficiency, ranked #123 of 301 in MN (top 41%) — families likely to look elsewhere, expect single-tenant / working-renter base with shorter leases.
- Zoned schools: Viking Elementary School (math 58% / reading 62%, grade B-, #209 of 857 statewide, top 25%, 460 students, 61% FRL); Pelican Rapids Alt Center Mid-Level (math 10% / reading 10%); Pelican Rapids Secondary (math 32% / reading 47%, grade F, #246 of 471 statewide, top 59%, 405 students, 56% FRL) — zoned schools average 58% FRL vs 39% district-wide (20 pts higher); higher-poverty schools than district average — tighter screening recommended.
- Zoned-school proficiency averages 36% at this address vs 50% district-wide (-13 pts) — the specific schools serving this property underperform the Pelican Rapids Public School District average; the district grade overstates school quality for this exact location.
- Market conditions: 175 active listings in the ZIP; 1 comparable units currently listed for rent nearby; 140 units permitted in Otter Tail County in 2024 (48 in 5+ unit buildings).
Forward outlook
- Local home prices are declining (-3.0%/yr); year-one equity from $2k of loan paydown is wiped out by about $7k of value loss. Plan a longer hold.
Negotiation context
- It's been on market 33 days — a 3% lower offer ($213k) is reasonable based on typical stale-listing flexibility.
Risks & watch-outs
- Watch-outs: built in 1907 — expect roof / HVAC / electrical / plumbing capex.
Questions for the listing agent
- What do current leases actually rent for vs. the listed asking? Can we see a recent rent roll and the last 12 months of T-12 income?
- It's been on market 33 days. Have you received any prior offers? Is the seller open to a 37% concession, seller financing, or rate buy-down credit?
- Built in 1907 — when were the roof, HVAC, electrical panel, plumbing, and water heater last replaced?
- Is there a deadline driving the sale (1031 exchange, divorce, estate, relocation)? That informs how much negotiation room exists.
- The area grade is low — what's the realistic commute time and amenity access for the typical tenant pool here? Any planned neighborhood developments (good or bad) we should know about?
- What's the average days-on-market for RENTAL listings here right now (not sales)? A rising rental-DOM trend means longer vacancies and softer asking-rent achievability than the comps imply.
- What's the recent tenant-quality profile in this submarket — average credit score on applications, eviction rate, late-payment / NSF rate, and stable-employment percentage? A property-management company in the area should have these aggregated.
- How much new for-sale + rental construction is in the pipeline within 1–3 miles? Heavy new supply typically softens prices + rents 12–24 months out; constrained supply supports both.
Investment metrics
- 1% rule
- 0.63% ✗
- Cap rate
- 5.13%
- Cash-on-cash
- -4.15%
- DSCR
- 0.82
- GRM
- 13.1
CMA / ARV
No comps found within radius.
Projected returns pro-forma
-3.0% appreciation · 3.0% rent growth · sell at horizon
- IRR
- -23.4%
- Equity multiple
- 0.20×
- Total profit
- $-49,309
- Equity at exit
- $32,803
- IRR
- -18.3%
- Equity multiple
- 0.01×
- Total profit
- $-60,819
- Equity at exit
- $19,022
Cash invested: $61,600 (down + closing). Projections, not guarantees.
Landlord ↔ Tenant lean methodology
- Overall (STATE)
- 46 Balanced
- State Minnesota
- 46 Balanced · D+2
- County
- — inherits STATE
- City
- — inherits STATE
ZIP-level market 56572
- Home prices YoY
- -14.1%
- Active inventory
- 175
- Price-to-rent
- 13.1×
Monthly cashflow live
- Estimated rent
- $1,395 medium interval (Pro) →
- Mortgage (P&I)
- −$1,154
- Tax from tax record
- −$70 /mo · $834/yr
- Insurance
- −$92
- HOA
- −$0
- Vacancy / Maint / Mgmt
- −$293
- Net cashflow
- $-213
Break-even live
Sensitivity live
| Price | -10% $-88 | -5% $-151 | +0% $-213 | +5% $-275 | +10% $-337 |
|---|---|---|---|---|---|
| Rent | -10% $-323 | -5% $-268 | +0% $-213 | +5% $-158 | +10% $-103 |
| Rate | -1.0pp $-102 | -0.5pp $-157 | base $-213 | +0.5pp $-270 | +1.0pp $-328 |
UW: 25.0% down · 7.5% · 30yr · 1.5% tax · 5.0% vac · 8.0% maint · 8.0% mgmt
Financing live
Cash to close
- Down payment
- $55,000
- Closing costs
- $6,600
- Reserves months
- —
- Total cash needed
- —
Loan-product check · same deal, 3 products live
Conventional
25% down · 7.5% · 30yr
- Down + closing
- —
- Monthly P&I
- —
- Monthly cashflow
- —
- DSCR
- —
- Eligible?
- —
Personal DTI + credit; lowest rate.
DSCR
20% down · 8.5% · 30yr
- Down + closing
- —
- Monthly P&I
- —
- Monthly cashflow
- —
- DSCR
- —
- Eligible?
- —
No personal income docs; deal must DSCR.
Hard money
10% down · 12.0% · 12mo
- Down + closing
- —
- Monthly P&I
- —
- Monthly cashflow
- —
- DSCR
- —
- Eligible?
- —
Short-term bridge; refi at stabilization.
Rent comps 1 comps
| Address | Beds | Baths | Sqft | Rent | $/sqft | DOM | Units | Dist |
|---|---|---|---|---|---|---|---|---|
| 520 NW 3rd St Apt 101 Pelican Rapids, MN | 3.0 | 1.0 | 950 | $1,395 | $1.47 | 23d | 1 | 0.33mi |
Listing history 14 events
-
2026-06-16status $220,000 Pending 33 DOM
-
2026-06-15days on market $220,000 Contingent - Inspection 33 DOM
-
2026-06-14days on market $220,000 Contingent - Inspection 31 DOM
-
2026-06-12days on market $220,000 Contingent - Inspection 30 DOM
-
2026-06-09days on market $220,000 Contingent - Inspection 27 DOM
-
2026-06-08days on market $220,000 Contingent - Inspection 26 DOM
-
2026-06-07days on market $220,000 Contingent - Inspection 25 DOM
-
2026-06-07days on market $220,000 Contingent - Inspection 24 DOM
-
2026-06-04days on market $220,000 Contingent - Inspection 21 DOM
-
2026-06-02days on market $220,000 Contingent - Inspection 20 DOM
-
2026-06-01days on market $220,000 Contingent - Inspection 19 DOM
-
2026-05-31days on market $220,000 Contingent - Inspection 18 DOM
-
2026-05-31days on market $220,000 Contingent - Inspection 17 DOM
-
2026-05-08$220,000 Active 600-char remark
ⓘ Source: listings_history table (triggers on properties + properties_extension) + one-shot
backfill from property_details.listing_events for pre-trigger history.
Tax reassessment forecast MN · Partial reset (capped growth)
- Current annual tax
- $834 · $70/mo
- Projected year-2 tax
- $1,649 · $137/mo
- Expected delta
- +$815/yr (+$68/mo · 97.7%)
ⓘ Screening estimate from a state-policy table — verify with the county assessor before closing.
Climate risk First Street
- Flood 1/10 Low 0% chance over 30 yrs
- Wildfire 2/10 Low
- Heat 1/10 Low 7 d/yr ≥95°F today · 12 d/yr by 30 yrs out
- Wind 2/10 Low
- Air quality 3/10 Moderate 2 unhealthy d/yr today · 3 by 30 yrs out
Nearby sold comps map
Loading sold comps map…
Walkable amenities ~0.75 mi
Loading nearby amenities…
Taxation est. · year 1
- Rental income
- $16,740
- − Mortgage interest
- −$12,323
- − Property taxes
- −$834
- − Insurance
- −$1,100
- − Repairs & maintenance
- −$1,339
- − Management
- −$1,339
- − Depreciation
- −$6,400
- Taxable loss
- −$6,596
- Est. tax savings @ 24.0%
- +$1,583
- After-tax cash flow
- $-971/yr
For passive investors: Depreciation is non-cash, so a rental often shows a tax loss while cash-flowing — sheltering income. Rental losses are passive: they offset passive income freely, and up to $25,000/yr can offset ordinary (W-2) income if you actively participate and your MAGI is under $100k (phasing out to $0 by $150k); unused losses carry forward. On sale, claimed depreciation is recaptured at up to 25%, and gains may owe capital-gains tax (a 1031 exchange can defer both). Figures are a year-1 estimate at your 24.0% rate — not tax advice; consult a CPA.
Schools (NCES district)
- District
- Pelican Rapids Public School District
- NCES district ID
- 2728170
- Math proficiency
- 45% ▼ -11.00%
- Reading proficiency
- 54% ▼ -3.00%
- Median HH income
- $51,933
- Composite
- 42.52/100
- National rank
- #3203
- State rank
- #123 of 301 in MN
Livability — Pelican Rapids
- Score
- 78/100
- State rank
- #114
- US rank
- #2581
Category grades
Schools grade is shown separately in the Schools card above.
Census & demographics
- Census place
- Pelican Rapids, MN
- Population (ZIP)
- 5,900
Population outlook (Otter Tail County) Hauer SSP2
- Today (2025)
- 58,183 people
- By 2030
- 58,267 · +0.1%
- By 2040
- 57,999 · -0.3%
- By 2050
- 57,183 · -1.7%
- By 2075
- 57,638 · -0.9%
- By 2100
- 54,697 · -6.0%
Race, ethnicity, and origin ACS 2023
- Neighborhood character
- Predominantly White (78%)
- Race & ethnicity
- White 78% Hispanic / Latino 13% Two or more races 8% Black 4%
- Hispanic origin (detail)
- Mexican 9% Puerto Rican 1%
- Common ancestry
- Portuguese 30% Scottish 2% Romanian 2%
- Foreign-born
- 9% · Canada
- Languages at home
- 87% English-only · Spanish 7% Russian/Polish/Slavic 1% German/W. Germanic 0%
Political lean MEDSL · Otter Tail
- 2024 margin
- Solid R (+34.2) · D 32.1% · R 66.3% · Other 1.6%
- 2008→2024 swing
- -21.3pp toward R · 2008: -12.9pp · 2024: -34.2pp
- All cycles
- 2024: R+34.2 2020: R+32.5 2016: R+35.9 2012: R+21.2 2008: R+12.9
Not yet ingested
- Civics
- —
Market trends
- HPI YoY
- ▼ -37.55%
- Current HPI
- 229.1081
- Rent YoY
- —
- Metro
- —
- State GDP YoY
- ▲ 2.41%
- F500 in state
- 34
Industry mix (Fortune 500 HQ in MN)
| Industry | F500 HQs | Revenue |
|---|---|---|
| Healthcare | 2 | $407B |
|
||
| Retail | 2 | $150B |
|
||
| Consumer Goods | 2 | $32B |
|
||
| Industrial Machinery | 2 | $6B |
|
||
| Agriculture | 1 | $40B |
|
||
| Healthcare / Medical Devices | 1 | $32B |
|
||
Price history
3 events — show timeline
- 2026-06-15 Pending — NORTHSTARMLS as Distributed by MLS Grid
- 2026-05-29 Contingent — NORTHSTARMLS as Distributed by MLS Grid
- 2026-05-08 Listed $220,000 NORTHSTARMLS as Distributed by MLS Grid
Property tax history
+4.9%/yrLatest (2025): $834 · -15.1% YoY. Source: county tax records.
Cash-flow waterfall
monthlySold comps — $/sqft
last 12 mo · ≤1 miLoading sold comps…