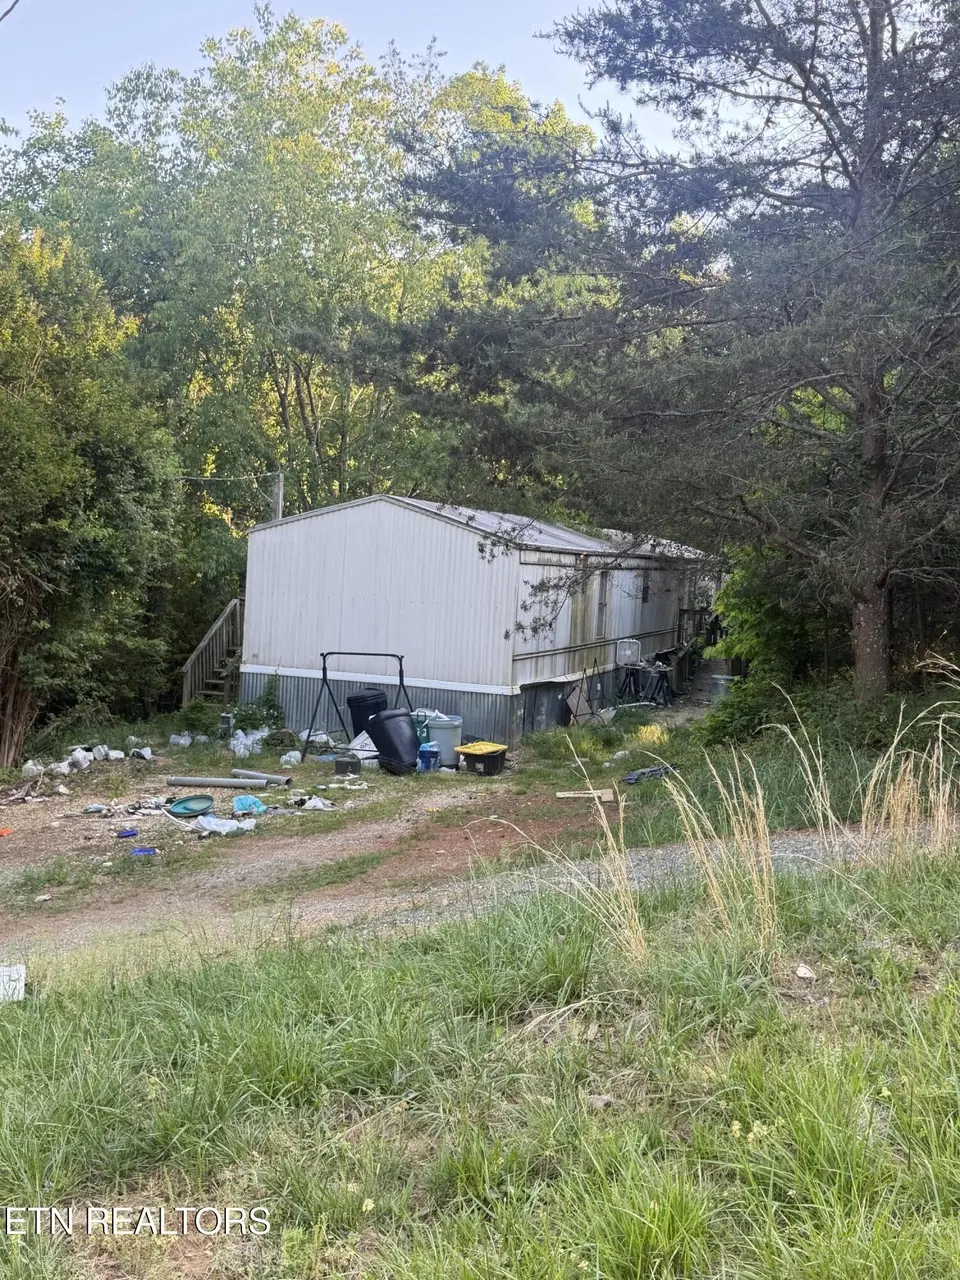
245 Allison Dr · Midtown, TN
Flood risk 1/10 · Minimal
- FEMA flood zone
- X (unshaded)
- Chance of flooding over 30 yrs
- 0.0%
- Est. flood insurance / yr
- $473 – $860
Fire risk 5/10 · Moderate
- Est. fire insurance / yr
- $949 – $1,763
Heat risk 5/10 · Moderate
- Hot days now (above 105°F)
- 7 days/yr
- Hot days in 30 yrs
- 20 days/yr
Wind risk 2/10 · Minimal
- Chance of severe wind over 30 yrs
- 2.0%
Air-quality risk 3/10 · Minor
- Unhealthy air days now
- 2 days/yr
- Unhealthy air days in 30 yrs
- 2 days/yr
Risk factors via First Street. Map © Google.
Why this score? — see what drove the B- grade
The composite is a weighted blend of 9 inputs, each scored 0–100. Each bar is that input's sub-score; the figure is the points it added to the 100-point composite (weight × sub-score).
- Cash flow +30.0/30.0
- 1% rule +10.0/10.0
- DSCR +10.0/10.0
- ARV discount +7.5/15.0
- Livability +2.7/5.0
- Rent growth +2.5/5.0
- Schools +2.5/10.0
- Condition / age +2.5/5.0
- Appreciation +0.0/10.0
$80,000
🖨 Deal sheet 📄 Offer letter ✓ Due diligence
Listing remarks
Amazing opportunity for an investor or someone looking for a project: fix it up and flip it/rent it or fix it and live in it. This singlewide is located in a subdivision with no HOA, situated on 1.65 acre lot. Its under an hour drive to Knoxville and close to Clinch River and Watts Bar Lake. Sold AS IS. Buyer to verify all the information.
Key facts
- 1.65 acre lot
- No hoa
- 1.65 acre lot
Tags
Property features AI
Finance
- HOA & community: Homeowners association present
Exterior
- Parking: RV parking available
- Utilities: Septic tank
- Home design: Detached property; 1,280 building area (per tax records)
- Construction: Aluminum siding and frame construction
- Exterior features: Rolling slope lot; Wooded view
Interior
- Flooring: Laminate flooring
- Bathrooms: 2 full bathrooms
- Heating & cooling: Central electric heating; Central cooling
- Interior features: Seven total rooms; Crawl space basement
Neighborhood map
What this means for you Summary
Snapshot
- This is a 3-bed/2.0-bath manufactured listed at $80k.
Deal economics
- At list price, monthly cash flow is $537 ($6k/yr) — positive.
- The deal already cash-flows at list — no discount required.
- Meets the 1% rule at list price ($1k rent vs $80k).
- Recommended offer: $78k (3.0% below list) — sets the bar for market timing.
Location & tenants
- Location reads 54/100 on livability (#380 in TN) — a working-class tenant base; expect higher turnover. Strengths: cost of living A+, housing B+, crime B; Watch: amenities F, commute F, employment F.
- Roane County (town): math 30% / reading 29% proficiency, ranked #64 of 139 in TN (top 46%) — low school quality limits family demand, transient renter base, plan for 1-2y turnover.
- Zoned schools: Midtown Elementary (math 37% / reading 37%, grade F, #272 of 952 statewide, top 31%, 297 students, 0% FRL); Cherokee Middle School (math 43% / reading 34%, grade F, #49 of 333 statewide, top 15%, 470 students, 0% FRL); Roane County High School (math 2% / reading 42%, grade F, #156 of 332 statewide, top 49%, 652 students, 0% FRL) — zoned schools average 0% FRL vs 50% district-wide (50 pts lower); this property's tenant base skews higher-income than the district average.
- Market conditions: 211 active listings in the ZIP; 2 comparable units currently listed for rent nearby; 229 units permitted in Roane County in 2024 (0 in 5+ unit buildings).
Forward outlook
- Local home prices are declining (-3.0%/yr); year-one equity from $553 of loan paydown is wiped out by about $2k of value loss. Plan a longer hold.
- Roane County population projected at -21% by 2050 — secular population decline; favor cash flow + early exit over multi-decade hold.
- At projected returns (-3.0% appreciation + 3.0% rent growth), your $22k cash investment doubles in ~5 years — after that, you're playing with house money.
Negotiation context
- It's been on market 37 days — a 3% lower offer ($78k) is reasonable based on typical stale-listing flexibility.
Risks & watch-outs
- Climate carrying-cost: moderate wildfire risk; extreme-heat days projected 7→20/yr by 2055 (HVAC capex compounding) — expect insurance premiums to compound above CPI over the hold.
Questions for the listing agent
- It's been on market 37 days. Have you received any prior offers? Is the seller open to a 3% concession, seller financing, or rate buy-down credit?
- Is there a deadline driving the sale (1031 exchange, divorce, estate, relocation)? That informs how much negotiation room exists.
- Schools are F-rated, which usually means shorter tenancies and higher turnover. Who's the typical renter profile here, and what's been the actual vacancy rate?
- What's the average days-on-market for RENTAL listings here right now (not sales)? A rising rental-DOM trend means longer vacancies and softer asking-rent achievability than the comps imply.
- What's the recent tenant-quality profile in this submarket — average credit score on applications, eviction rate, late-payment / NSF rate, and stable-employment percentage? A property-management company in the area should have these aggregated.
- How much new for-sale + rental construction is in the pipeline within 1–3 miles? Heavy new supply typically softens prices + rents 12–24 months out; constrained supply supports both.
Investment metrics
- 1% rule
- 1.59% ✓
- Cap rate
- 14.34%
- Cash-on-cash
- 28.75%
- DSCR
- 2.28
- GRM
- 5.2
CMA / ARV
- ARV (median comp)
- $211,547
- List price
- $80,000
- Delta
- -62.18%
- Verdict
- UNDERPRICED
- Comps
- 2 within 1.0 mi
Show comp detail 2 sales within ~0.75 mi
| Address | Dist | Beds/Ba | Sqft | Sold | Price | $/sf | Match |
|---|---|---|---|---|---|---|---|
| 160 Casey Rd | 0.66mi | 3/2.0 | 1,280 (0%) | 6mo | $177,650 | $139 | 64 |
| 199 Allison Dr | 0.15mi | 3/2.0 | 1,456 (+14%) | 12mo | $245,000 | $168 | 60 |
Match score weights: distance 35% · size 25% · config 20% · recency 20%. Top-matched comps best support the ARV.
Projected returns pro-forma
-3.0% appreciation · 3.0% rent growth · sell at horizon
- IRR
- 23.0%
- Equity multiple
- 1.95×
- Total profit
- $21,178
- Equity at exit
- $11,928
- IRR
- 31.0%
- Equity multiple
- 3.78×
- Total profit
- $62,312
- Equity at exit
- $6,917
Cash invested: $22,400 (down + closing). Projections, not guarantees.
Landlord ↔ Tenant lean methodology
- Overall (STATE)
- 87 Strongly Landlord-Friendly
- State Tennessee
- 87 Strongly Landlord-Friendly · R+13
- County
- — inherits STATE
- City
- — inherits STATE
ZIP-level market 37748
- Home prices YoY
- -11.5%
- Active inventory
- 211
- Price-to-rent
- 5.2×
Monthly cashflow live
- Estimated rent
- $1,271 medium interval (Pro) →
- Mortgage (P&I)
- −$420
- Tax from tax record
- −$15 /mo · $178/yr
- Insurance
- −$33
- HOA
- −$0
- Vacancy / Maint / Mgmt
- −$267
- Net cashflow
- $537
Break-even live
UW: 25.0% down · 7.5% · 30yr · 1.5% tax · 5.0% vac · 8.0% maint · 8.0% mgmt
Financing live
Cash to close
- Down payment
- $20,000
- Closing costs
- $2,400
- Reserves months
- —
- Total cash needed
- —
Loan-product check · same deal, 3 products live
Conventional
25% down · 7.5% · 30yr
- Down + closing
- —
- Monthly P&I
- —
- Monthly cashflow
- —
- DSCR
- —
- Eligible?
- —
Personal DTI + credit; lowest rate.
DSCR
20% down · 8.5% · 30yr
- Down + closing
- —
- Monthly P&I
- —
- Monthly cashflow
- —
- DSCR
- —
- Eligible?
- —
No personal income docs; deal must DSCR.
Hard money
10% down · 12.0% · 12mo
- Down + closing
- —
- Monthly P&I
- —
- Monthly cashflow
- —
- DSCR
- —
- Eligible?
- —
Short-term bridge; refi at stabilization.
Rent comps 2 comps
| Address | Beds | Baths | Sqft | Rent | $/sqft | DOM | Units | Dist |
|---|---|---|---|---|---|---|---|---|
| 238 Midtown Ln Harriman, TN | 1.0–3.0 | 1.0 | 900 | $1,350 | $1.50 | 11d | 3 | 1.25mi |
| 236 Midtown Ln Unit 705 Harriman, TN | 2.0 | 1.0 | 1000 | $1,200 | $1.20 | 43d | 1 | 1.25mi |
Listing history 11 events
-
2026-06-07status $80,000 Pending 37 DOM
-
2026-06-03days on market $80,000 Active 37 DOM
-
2026-06-02days on market $80,000 Active 36 DOM
-
2026-06-01days on market $80,000 Active 35 DOM
-
2026-05-31days on market $80,000 Active 34 DOM
-
2026-05-31days on market $80,000 Active 33 DOM
-
2026-05-07price $100,000 343-char remark
-
2026-04-27$125,000 Active 343-char remark
-
2024-08-16soldstatus $80,000
-
2007-05-04soldstatus $21,000
-
2000-02-28soldstatus $19,000
ⓘ Source: listings_history table (triggers on properties + properties_extension) + one-shot
backfill from property_details.listing_events for pre-trigger history.
Tax reassessment forecast TN · Resets to sale price
- Current annual tax
- $178 · $15/mo
- Projected year-2 tax
- $568 · $47/mo
- Expected delta
- +$390/yr (+$32/mo · 219.1%)
ⓘ Screening estimate from a state-policy table — verify with the county assessor before closing.
Climate risk First Street
- Flood 1/10 Low FEMA zone X (unshaded) · 0% chance over 30 yrs
- Wildfire 5/10 Major
- Heat 5/10 Major 7 d/yr ≥105°F today · 20 d/yr by 30 yrs out
- Wind 2/10 Low 2% chance of damaging wind over 30 yrs
- Air quality 3/10 Moderate 2 unhealthy d/yr today · 2 by 30 yrs out
Nearby sold comps map
Loading sold comps map…
Walkable amenities ~0.75 mi
Loading nearby amenities…
Taxation est. · year 1
- Rental income
- $15,255
- − Mortgage interest
- −$4,481
- − Property taxes
- −$178
- − Insurance
- −$400
- − Repairs & maintenance
- −$1,220
- − Management
- −$1,220
- − Depreciation
- −$2,327
- Taxable income
- $5,427
- Est. tax owed @ 24.0%
- −$1,303
- After-tax cash flow
- $5,136/yr
For passive investors: Depreciation is non-cash, so a rental often shows a tax loss while cash-flowing — sheltering income. Rental losses are passive: they offset passive income freely, and up to $25,000/yr can offset ordinary (W-2) income if you actively participate and your MAGI is under $100k (phasing out to $0 by $150k); unused losses carry forward. On sale, claimed depreciation is recaptured at up to 25%, and gains may owe capital-gains tax (a 1031 exchange can defer both). Figures are a year-1 estimate at your 24.0% rate — not tax advice; consult a CPA.
Schools (NCES district)
- District
- Roane County
- NCES district ID
- 4703590
- Math proficiency
- 30% ▼ -10.00%
- Reading proficiency
- 29% ▼ -7.00%
- Median HH income
- $41,611
- Composite
- 25.0/100
- National rank
- #7557
- State rank
- #64 of 139 in TN
Livability — Midtown
- Score
- 54/100
- State rank
- #380
- US rank
- #24144
Category grades
Schools grade is shown separately in the Schools card above.
Census & demographics
- Population (ZIP)
- 17,021
Population outlook (Roane County) Hauer SSP2
- Today (2025)
- 49,652 people
- By 2030
- 47,648 · -4.0%
- By 2040
- 43,306 · -12.8%
- By 2050
- 39,294 · -20.9%
- By 2075
- 32,318 · -34.9%
- By 2100
- 27,137 · -45.3%
Race, ethnicity, and origin ACS 2023
- Neighborhood character
- Predominantly White (90%)
- Race & ethnicity
- White 90% Two or more races 5% Black 4% Hispanic / Latino 2%
- Common ancestry
- Serbian 3% Slovak 2% Lithuanian 1%
- Foreign-born
- 1%
- Languages at home
- 99% English-only · Spanish 1%
Political lean MEDSL · Roane
- 2024 margin
- Solid R (+54.5) · D 22.1% · R 76.7% · Other 1.2%
- 2008→2024 swing
- -18.3pp toward R · 2008: -36.2pp · 2024: -54.5pp
- All cycles
- 2024: R+54.5 2020: R+50.9 2016: R+51.1 2012: R+41.3 2008: R+36.2
Not yet ingested
- Civics
- —
Market trends
- HPI YoY
- ▼ -39.78%
- Current HPI
- 305.724
- Rent YoY
- —
- Metro
- —
- State GDP YoY
- ▲ 2.78%
- F500 in state
- 22
Industry mix (Fortune 500 HQ in TN)
| Industry | F500 HQs | Revenue |
|---|---|---|
| Healthcare | 3 | $91B |
|
||
| Retail | 3 | $72B |
|
||
| Transportation / Logistics | 1 | $88B |
|
||
| Paper / Packaging | 1 | $19B |
|
||
| Insurance | 1 | $13B |
|
||
| Energy | 1 | $12B |
|
||
Price history
+321.1% since first listed7 events — show timeline
- 2026-06-03 Pending — Knoxville MLS
- 2026-05-29 Price Changed $80,000 Knoxville MLS
- 2026-05-07 Price Changed $100,000 Knoxville MLS
- 2026-04-27 Listed $125,000 Knoxville MLS
- 2024-08-16 Sold (Public Records) $80,000 Public Records
- 2007-05-04 Sold (Public Records) $21,000 Public Records
- 2000-02-28 Sold (Public Records) $19,000 Public Records
Property tax history
+1.6%/yrLatest (2025): $178 · -15.6% YoY. Source: county tax records.
Cash-flow waterfall
monthlySold comps — $/sqft
last 12 mo · ≤1 miLoading sold comps…