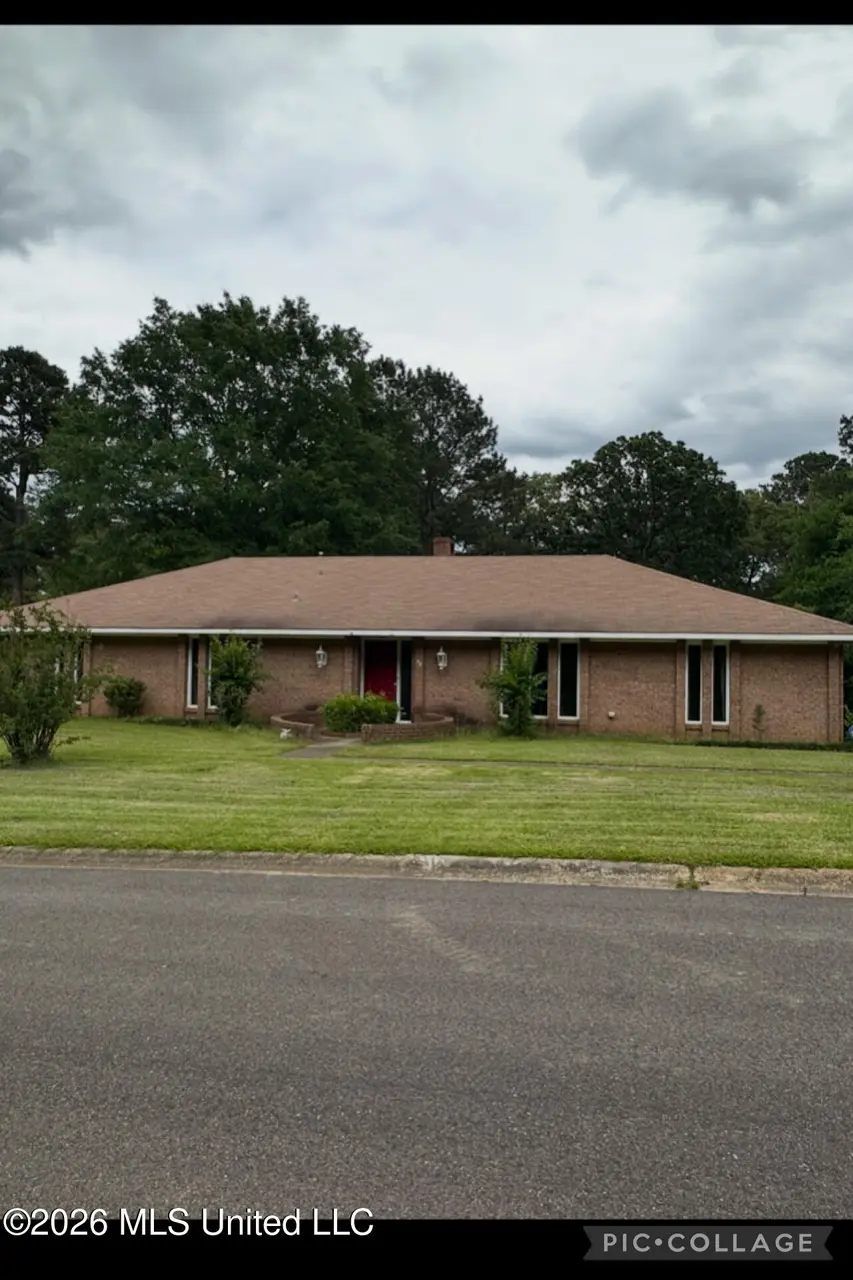
72 Terrapin Dr · Brandon, MS
Flood risk 1/10 · Minimal
- FEMA flood zone
- X (unshaded)
- Chance of flooding over 30 yrs
- 0.0%
- Est. flood insurance / yr
- $507 – $1,088
Fire risk 3/10 · Minor
- Est. fire insurance / yr
- $1,241 – $2,305
Heat risk 7/10 · Major
- Hot days now (above 109°F)
- 7 days/yr
- Hot days in 30 yrs
- 20 days/yr
Wind risk 8/10 · Major
- Chance of severe wind over 30 yrs
- 80.0%
Air-quality risk 2/10 · Minimal
- Unhealthy air days now
- 1 days/yr
- Unhealthy air days in 30 yrs
- 1 days/yr
Risk factors via First Street. Map © Google.
Why this score? — see what drove the C- grade
The composite is a weighted blend of 9 inputs, each scored 0–100. Each bar is that input's sub-score; the figure is the points it added to the 100-point composite (weight × sub-score).
- Cash flow +16.7/30.0
- ARV discount +10.2/15.0
- DSCR +5.2/10.0
- Schools +4.6/10.0
- Rent growth +4.3/5.0
- Livability +4.0/5.0
- 1% rule +3.3/10.0
- Condition / age +2.5/5.0
- Appreciation +0.0/10.0
$270,000
🖨 Deal sheet (PDF) 📄 Offer letter ✓ Due diligence
Listing remarks
Case# 281-372222 HUD homes are sold "As-Is" www. olympusams-at.com www. HUDHomestore. gov for offers visit HUDHomestore
Key facts
- 0.45 acre lot
- 2 parking spots
- Built 1975
Property features AI
Finance
- Other: Lot size approximately 0.45 acre
Exterior
- Parking: Two carport spaces; Driveway with concrete surface
- Utilities: Public water; Public sewer; Electricity available
- Home design: Single-family house; One level
- Construction: Brick construction; Asphalt roof; Slab foundation; Built (year source: public records)
- Exterior features: Back yard fencing; Screened patio/porch; Other exterior features
Interior
- Bathrooms: Two full bathrooms and one half bathroom (3 total)
- Heating & cooling: Heating available (fireplace); Ceiling fans for cooling
- Interior features: Living room fireplace with masonry design; Screened patio/porch; Laundry room
- Laundry & utility: Dedicated laundry room
Neighborhood map
What this means for you Summary
Snapshot
- This is a 4-bed/2.0-bath single-family listed at $270k.
Deal economics
- At list price, monthly cash flow is $167 ($2k/yr) — positive.
- The deal already cash-flows at list — no discount required.
- To meet the 1% rule (rent ≥ 1% of price), the offer needs to be $223k (17.3% below list).
- Recommended offer: $223k (17.3% below list) — sets the bar for 1% rule.
- Cap rate 7.0% vs local median 4.2% in Brandon — top-decile yield for the area; either an underpriced asset or a hidden risk that comps aren't pricing in. Stress-test before assuming the spread holds.
Location & tenants
- Location reads 81/100 on livability (#3 in MS, #1,514 nationally) — a professional / high-income tenant draw. Strengths: crime A+, employment A+, cost of living A+; Watch: amenities F, commute F.
- Rankin County School District (rural): math 56% / reading 48% proficiency, ranked #6 of 130 in MS (top 5%) — acceptable for families but not a draw, mixed tenant base, ~2y average lease.
- Zoned schools: Brandon Elementary School (math 69% / reading 65%, grade B+, #11 of 375 statewide, top 3%, 741 students, 100% FRL); Brandon Middle School (math 67% / reading 49%, grade B, #11 of 179 statewide, top 6%, 1,193 students, 100% FRL); Brandon High School (math 47% / reading 49%, grade D, #27 of 197 statewide, top 13%, 1,648 students, 100% FRL) — zoned schools average 100% FRL vs 35% district-wide (65 pts higher); higher-poverty schools than district average — tighter screening recommended.
- Market conditions: Rents rising fast (+7.1%/yr); 302 active listings in the ZIP; 3 comparable units currently listed for rent nearby; rentals at typical pace (median 15d on market — plan ~3-4 weeks tenant-placement turnaround); solid renter incomes; 343 units permitted in Rankin County in 2024 (0 in 5+ unit buildings).
- This rent runs 30% of the median local income ($89k/yr) — at the standard rent-burdened threshold; future hikes will face affordability resistance.
Forward outlook
- Local home prices are declining (-3.0%/yr); year-one equity from $2k of loan paydown is wiped out by about $8k of value loss. Plan a longer hold.
- Rankin County population projected at +17% by 2050 — long-run rental-demand tailwind backs the buy-and-hold thesis.
Negotiation context
- It's been on market 19 days — a 2% lower offer ($266k) is reasonable based on typical stale-listing flexibility.
Risks & watch-outs
- Climate carrying-cost: severe wind risk, 80% chance of damaging wind over 30y; extreme-heat days projected 7→20/yr by 2055 (HVAC capex compounding) — expect insurance premiums to compound above CPI over the hold.
Questions for the listing agent
- Built in 1975 — when were the roof, HVAC, electrical panel, plumbing, and water heater last replaced?
- Is there a deadline driving the sale (1031 exchange, divorce, estate, relocation)? That informs how much negotiation room exists.
- Schools are A-rated — typically a magnet for longer-tenancy family renters. What's the average tenant stay here, and is there a school-zone premium baked into asking?
- What's the average days-on-market for RENTAL listings here right now (not sales)? A rising rental-DOM trend means longer vacancies and softer asking-rent achievability than the comps imply.
- What's the recent tenant-quality profile in this submarket — average credit score on applications, eviction rate, late-payment / NSF rate, and stable-employment percentage? A property-management company in the area should have these aggregated.
- How much new for-sale + rental construction is in the pipeline within 1–3 miles? Heavy new supply typically softens prices + rents 12–24 months out; constrained supply supports both.
Investment metrics
- 1% rule
- 0.83% ✗
- Cap rate
- 7.04%
- Cash-on-cash
- 2.65%
- DSCR
- 1.12
- GRM
- 10.1
CMA / ARV
- ARV (median comp)
- $286,963
- List price
- $270,000
- Delta
- -5.91%
- Verdict
- FAIR
- Comps
- 20 within 1.0 mi
Show comp detail 12 sales within ~0.75 mi
| Address | Dist | Beds/Ba | Sqft | Sold | Price | $/sf | Match |
|---|---|---|---|---|---|---|---|
| 79 Terrapin Dr | 0.05mi | 4/2.0 | 2,450 (-2%) | 6mo | $309,900 | $126 | 89 |
| 66 Terrapin Dr | 0.09mi | 4/2.0 | 2,391 (-4%) | 4mo | $255,000 | $107 | 86 |
| 69 Terrapin Dr | 0.17mi | 4/2.5 | 2,467 (-1%) | 4mo | $320,000 | $130 | 85 |
| 11 S Terrapin Hill Rd | 0.23mi | 3/3.0 (-1) | 2,411 (-3%) | 8mo | $278,000 | $115 | 68 |
| 69 Summit Ridge Dr | 0.26mi | 4/2.0 | 2,211 (-11%) | 2mo | $274,000 | $124 | 68 |
| 67 Summit Ridge Dr | 0.25mi | 4/2.0 | 2,200 (-12%) | 6mo | $280,000 | $127 | 64 |
| 60 Summit Ridge Dr | 0.26mi | 4/3.0 | 2,250 (-10%) | 7mo | $279,000 | $124 | 62 |
| 30 Stonegate Dr | 0.44mi | 4/2.0 | 2,267 (-9%) | 9mo | $280,000 | $124 | 57 |
| 146 Forest Ridge Dr | 0.55mi | 5/3.0 (+1) | 2,606 (+5%) | 1mo | $312,000 | $120 | 56 |
| 28 Rockford Ct | 0.74mi | 3/2.0 (-1) | 2,480 (-0%) | 5mo | $315,000 | $127 | 56 |
| 141 Post Hill Rd | 0.73mi | 3/2.0 (-1) | 2,312 (-7%) | 8mo | $240,000 | $104 | 42 |
| 26 Woodgate Dr | 0.70mi | 3/2.0 (-1) | 2,801 (+12%) | 3mo | $344,900 | $123 | 39 |
Match score weights: distance 35% · size 25% · config 20% · recency 20%. Top-matched comps best support the ARV.
Projected returns pro-forma
-3.0% appreciation · 7.13% rent growth · sell at horizon
- IRR
- -8.2%
- Equity multiple
- 0.69×
- Total profit
- $-23,571
- Equity at exit
- $40,258
- IRR
- 5.5%
- Equity multiple
- 1.47×
- Total profit
- $35,843
- Equity at exit
- $23,345
Cash invested: $75,600 (down + closing). Projections, not guarantees.
Landlord ↔ Tenant lean methodology
- Overall (STATE)
- 90 Strongly Landlord-Friendly
- State Mississippi
- 90 Strongly Landlord-Friendly · R+11
- County
- — inherits STATE
- City
- — inherits STATE
ZIP-level market 39042
- Home prices YoY
- -34.3%
- Rents YoY
- 7.1%
- Active inventory
- 302
- Price-to-rent
- 10.1×
Monthly cashflow live
- Estimated rent
- $2,233 medium interval (Pro) →
- Mortgage (P&I)
- −$1,416
- Tax from tax record
- −$69 /mo · $826/yr
- Insurance
- −$112
- HOA
- −$0
- Vacancy / Maint / Mgmt
- −$469
- Net cashflow
- $167
Break-even live
Sensitivity live
| Price | -10% $320 | -5% $244 | +0% $167 | +5% $91 | +10% $14 |
|---|---|---|---|---|---|
| Rent | -10% $-9 | -5% $79 | +0% $167 | +5% $255 | +10% $344 |
| Rate | -1.0pp $303 | -0.5pp $236 | base $167 | +0.5pp $97 | +1.0pp $26 |
UW: 25.0% down · 7.5% · 30yr · 1.5% tax · 5.0% vac · 8.0% maint · 8.0% mgmt
Financing live
Cash to close
- Down payment
- $67,500
- Closing costs
- $8,100
- Reserves months
- —
- Total cash needed
- —
Loan-product check · same deal, 3 products live
Conventional
25% down · 7.5% · 30yr
- Down + closing
- —
- Monthly P&I
- —
- Monthly cashflow
- —
- DSCR
- —
- Eligible?
- —
Personal DTI + credit; lowest rate.
DSCR
20% down · 8.5% · 30yr
- Down + closing
- —
- Monthly P&I
- —
- Monthly cashflow
- —
- DSCR
- —
- Eligible?
- —
No personal income docs; deal must DSCR.
Hard money
10% down · 12.0% · 12mo
- Down + closing
- —
- Monthly P&I
- —
- Monthly cashflow
- —
- DSCR
- —
- Eligible?
- —
Short-term bridge; refi at stabilization.
Rent comps 3 comps
| Address | Beds | Baths | Sqft | Rent | $/sqft | DOM | Units | Dist |
|---|---|---|---|---|---|---|---|---|
| 77 Fern Valley Rd Brandon, MS | 3.0 | 2.0 | 1585 | $1,800 | $1.14 | 15d | 1 | 0.41mi |
| 7 Sandway Dr Brandon, MS | 3.0 | 2.0 | 1985 | $2,156 | $1.09 | 45d | 1 | 0.77mi |
| 453 Piney Dr Pearl, MS | 4.0 | 2.0 | 1835 | $2,500 | $1.36 | 15d | 1 | 0.96mi |
Listing history 4 events
-
2026-06-01status $270,000 Pending 19 DOM
-
2026-05-31days on market $270,000 Active 19 DOM
-
2026-05-30days on market $270,000 Active 18 DOM
-
2026-05-12$270,000 Active 136-char remark
ⓘ Source: listings_history table (triggers on properties + properties_extension) + one-shot
backfill from property_details.listing_events for pre-trigger history.
Tax reassessment forecast MS · Resets to sale price
- Current annual tax
- $826 · $69/mo
- Projected year-2 tax
- $2,133 · $178/mo
- Expected delta
- +$1,307/yr (+$109/mo · 158.3%)
ⓘ Screening estimate from a state-policy table — verify with the county assessor before closing.
Climate risk First Street
- Flood 1/10 Low FEMA zone X (unshaded) · 0% chance over 30 yrs
- Wildfire 3/10 Moderate
- Heat 7/10 Severe 7 d/yr ≥109°F today · 20 d/yr by 30 yrs out
- Wind 8/10 Severe 80% chance of damaging wind over 30 yrs
- Air quality 2/10 Low 1 unhealthy d/yr today · 1 by 30 yrs out
Nearby sold comps map
Loading sold comps map…
Walkable amenities ~0.75 mi
Loading nearby amenities…
Taxation est. · year 1
- Rental income
- $26,801
- − Mortgage interest
- −$15,124
- − Property taxes
- −$826
- − Insurance
- −$1,350
- − Repairs & maintenance
- −$2,144
- − Management
- −$2,144
- − Depreciation
- −$7,855
- Taxable loss
- −$2,642
- Est. tax savings @ 24.0%
- +$634
- After-tax cash flow
- $2,640/yr
For passive investors: Depreciation is non-cash, so a rental often shows a tax loss while cash-flowing — sheltering income. Rental losses are passive: they offset passive income freely, and up to $25,000/yr can offset ordinary (W-2) income if you actively participate and your MAGI is under $100k (phasing out to $0 by $150k); unused losses carry forward. On sale, claimed depreciation is recaptured at up to 25%, and gains may owe capital-gains tax (a 1031 exchange can defer both). Figures are a year-1 estimate at your 24.0% rate — not tax advice; consult a CPA.
Schools (NCES district)
- District
- Rankin County School District
- NCES district ID
- 2803830
- Math proficiency
- 56% ▼ -4.00%
- Reading proficiency
- 48% ▼ -6.00%
- Median HH income
- $61,867
- Composite
- 45.62/100
- National rank
- #2587
- State rank
- #6 of 130 in MS
Livability — Brandon
- Score
- 81/100
- State rank
- #3
- US rank
- #1514
Category grades
Schools grade is shown separately in the Schools card above.
Census & demographics
- Census place
- Brandon, MS
- County
- Rankin County · 123,614 people
- City population
- 79,950
- Metro
- Jackson, MS
- Population (ZIP)
- 39,142
- Household income
- $88,597
- Rent vs Own
- Severe rent burden
- 474.0
Population outlook (Rankin County) Hauer SSP2
- Today (2025)
- 164,317 people
- By 2030
- 171,013 · +4.1%
- By 2040
- 182,723 · +11.2%
- By 2050
- 192,376 · +17.1%
- By 2075
- 209,535 · +27.5%
- By 2100
- 209,534 · +27.5%
Race, ethnicity, and origin ACS 2023
- Neighborhood character
- Predominantly White (75%)
- Race & ethnicity
- White 75% Black 21% Hispanic / Latino 2% Two or more races 2%
- Common ancestry
- Italian 5% Slovak 2% Iranian 2%
- Foreign-born
- 2% · Canada
- Languages at home
- 97% English-only · Spanish 2%
Political lean MEDSL · Rankin
- 2024 margin
- Solid R (+47.1) · D 25.9% · R 73.0% · Other 1.0%
- 2008→2024 swing
- +6.4pp toward D · 2008: -53.5pp · 2024: -47.1pp
- All cycles
- 2024: R+47.1 2020: R+45.4 2016: R+52.9 2012: R+51.9 2008: R+53.5
Not yet ingested
- Civics
- —
Market trends
- HPI YoY
- ▼ -90.04%
- Current HPI
- 172.5248
- Rent YoY
- ▲ 7.13%
- Metro
- Jackson, MS
- State GDP YoY
- —
- F500 in state
- 0
Price history
2 events — show timeline
- 2026-05-31 Pending — MLSU
- 2026-05-12 Listed $270,000 MLSU
Property tax history
+1.6%/yrLatest (2025): $826 · +1.4% YoY. Source: county tax records.
Cash-flow waterfall
monthlySold comps — $/sqft
last 12 mo · ≤1 miLoading sold comps…