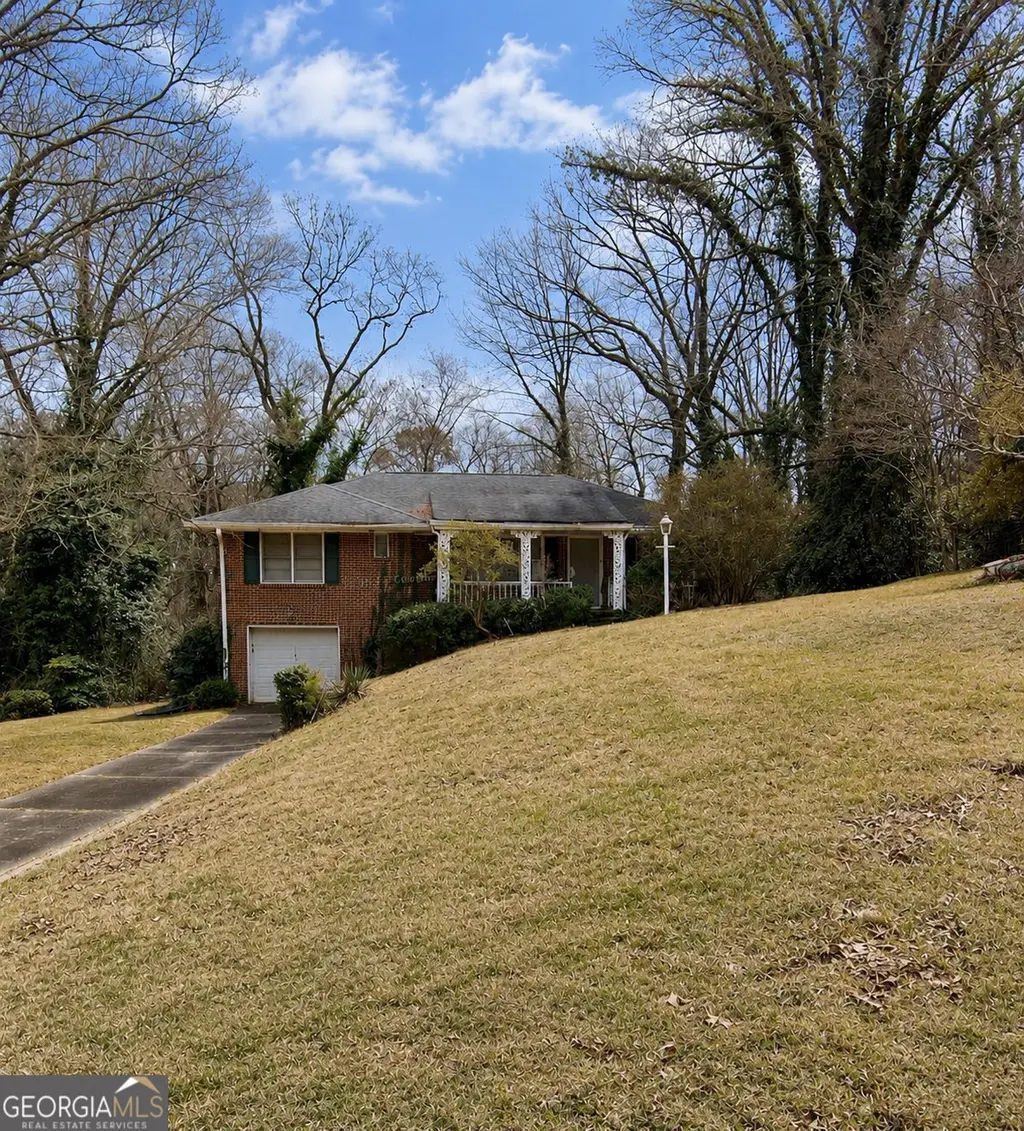
2180 Highview Rd SW · Atlanta, GA
Flood risk 1/10 · Minimal
- FEMA flood zone
- X (unshaded)
- Chance of flooding over 30 yrs
- 0.0%
- Est. flood insurance / yr
- $473 – $860
Fire risk 3/10 · Minor
- Est. fire insurance / yr
- $963 – $1,789
Heat risk 5/10 · Moderate
- Hot days now (above 104°F)
- 7 days/yr
- Hot days in 30 yrs
- 17 days/yr
Wind risk 4/10 · Minor
- Chance of severe wind over 30 yrs
- 24.0%
Air-quality risk 3/10 · Minor
- Unhealthy air days now
- 3 days/yr
- Unhealthy air days in 30 yrs
- 3 days/yr
Risk factors via First Street. Map © Google.
Why this score? — see what drove the B grade
The composite is a weighted blend of 9 inputs, each scored 0–100. Each bar is that input's sub-score; the figure is the points it added to the 100-point composite (weight × sub-score).
- Cash flow +28.4/30.0
- ARV discount +15.0/15.0
- DSCR +10.0/10.0
- 1% rule +6.8/10.0
- Livability +4.2/5.0
- Schools +2.7/10.0
- Rent growth +2.5/5.0
- Condition / age +2.5/5.0
- Appreciation +0.0/10.0
$175,900
🖨 Deal sheet (PDF) 📄 Offer letter ✓ Due diligence
Listing remarks MLS
Rare opportunity in Southwest Atlanta! Situated on approximately 2.23 acres, this charming 2-bedroom, 1-bath brick home is full of character and potential. Features include hardwood floors, vintage tile, solid wood cabinetry, and a large private lot. Incredible opportunity for investors, renovators, or buyers looking to personalize a property with acreage inside the city. Sold as-is. Conveniently located near downtown Atlanta, shopping, dining, and major interstates.
Key facts
- Solid wood cabinetry
- Private lot
- Vintage tile
Tags
Property features AI
Finance
- Other: Above-grade finished living area approximately 1,350; Property listed as fixer; Legal lot note: AN PROPERTY BEHIND HOME IS TOO STEEP 9/16 A1 FROM 11 TO 21
Exterior
- Parking: Detached garage (1-car) - garage faces front; Total of 1 parking space
- Utilities: Public water; Public sewer; 220 volt electric service; Cable available; Electricity available; Natural gas available; Phone available; Sewer available
- Home design: One level; Stone construction
- Construction: Shingle roof; Other roof material; Block foundation; Other structures on property
- Exterior features: Front porch; Other exterior features
Interior
- Kitchen: Country kitchen
- Bedrooms: Main-level master bedroom
- Flooring: Carpet; Laminate
- Bathrooms: One full bathroom on the main level; Master bathroom with other/unspecified features
- Interior features: Partial basement; No shared/common walls; Fixer condition
- Laundry & utility: Laundry area with other/unspecified features
Neighborhood map
What this means for you Summary
Snapshot
- This is a 2-bed/1.0-bath single-family listed at $176k.
Deal economics
- At list price, monthly cash flow is $569 ($7k/yr) — positive.
- The deal already cash-flows at list — no discount required.
- Meets the 1% rule at list price ($2k rent vs $176k).
- Cap rate 10.2% vs local median 3.1% in Atlanta — top-decile yield for the area; either an underpriced asset or a hidden risk that comps aren't pricing in. Stress-test before assuming the spread holds.
Location & tenants
- Location reads 83/100 on livability (#6 in GA, #919 nationally) — a professional / high-income tenant draw. Strengths: amenities A+, commute A+, housing A+; Watch: cost of living C-.
- Atlanta Public Schools (urban): math 28% / reading 35% proficiency, ranked #80 of 174 in GA (top 46%) — families likely to look elsewhere, expect single-tenant / working-renter base with shorter leases; 71% free/reduced lunch — lower-income household profile, screen leases tightly.
- Zoned schools: Beecher Hills Elementary School (241 students, 100% FRL); Jean Childs Young Middle School (math 2% / reading 12%, grade F, #449 of 470 statewide, top 97%, 747 students, 100% FRL); Benjamin E. Mays High School (math 22% / reading 15%, grade F, #254 of 424 statewide, top 61%, 1,337 students, 100% FRL) — zoned schools average 100% FRL vs 71% district-wide (29 pts higher); higher-poverty schools than district average — tighter screening recommended.
- Zoned-school proficiency averages 13% at this address vs 32% district-wide (-19 pts) — the specific schools serving this property underperform the Atlanta Public Schools average; the district grade overstates school quality for this exact location.
- Market conditions: Rents soft (-0.2%/yr); 250 active listings in the ZIP; 40 comparable units currently listed for rent nearby; rentals at typical pace (median 26d on market — plan ~3-4 weeks tenant-placement turnaround); 11,565 units permitted in Fulton County in 2024 (8,159 in 5+ unit buildings).
- At $2,067/mo this rent would consume 49% of the median local household income ($51k/yr) (locally 2825% of renters already pay >50% of income on rent) — very limited rent-growth headroom before tenants either downsize or default.
Forward outlook
- Local home prices are declining (-3.0%/yr); year-one equity from $1k of loan paydown is wiped out by about $5k of value loss. Plan a longer hold.
- Fulton County population projected at +38% by 2050 — long-run rental-demand tailwind backs the buy-and-hold thesis.
Negotiation context
- Only 4 days on market — expect competitive offers; lowballing is unlikely to land.
- 2 sale attempts with the ask held roughly flat each time — persistent listings suggest the price (not the market) is what's stuck; bring a comps-based counter.
Risks & watch-outs
- Watch-outs: built in 1950 — expect roof / HVAC / electrical / plumbing capex.
- Climate carrying-cost: extreme-heat days projected 7→17/yr by 2055 (HVAC capex compounding) — expect insurance premiums to compound above CPI over the hold.
Questions for the listing agent
- Built in 1950 — when were the roof, HVAC, electrical panel, plumbing, and water heater last replaced?
- Is there a deadline driving the sale (1031 exchange, divorce, estate, relocation)? That informs how much negotiation room exists.
- What's the average days-on-market for RENTAL listings here right now (not sales)? A rising rental-DOM trend means longer vacancies and softer asking-rent achievability than the comps imply.
- What's the recent tenant-quality profile in this submarket — average credit score on applications, eviction rate, late-payment / NSF rate, and stable-employment percentage? A property-management company in the area should have these aggregated.
- How much new for-sale + rental construction is in the pipeline within 1–3 miles? Heavy new supply typically softens prices + rents 12–24 months out; constrained supply supports both.
Investment metrics
- 1% rule
- 1.18% ✓
- Cap rate
- 10.17%
- Cash-on-cash
- 13.85%
- DSCR
- 1.62
- GRM
- 7.1
CMA / ARV
- ARV (on-the-fly)
- $245,700
- Comps found
- 12
Show comp detail 12 sales within ~0.75 mi
| Address | Dist | Beds/Ba | Sqft | Sold | Price | $/sf | Match |
|---|---|---|---|---|---|---|---|
| 2255 Beecher Rd SW | 0.19mi | 3/2.0 (+1) | 1,286 (-5%) | 5mo | $220,000 | $171 | 70 |
| 1168 Dolphin Dr SW | 0.33mi | 2/1.0 | 1,498 (+11%) | 5mo | $117,500 | $78 | 62 |
| 1174 Dolphin Dr SW | 0.34mi | 3/2.0 (+1) | 1,212 (-10%) | 0mo | $160,000 | $132 | 58 |
| 2323 Venetian Dr SW | 0.74mi | 2/1.0 | 1,436 (+6%) | 2mo | $360,000 | $251 | 53 |
| 2210 Bolling Brook Dr SW | 0.50mi | 3/2.0 (+1) | 1,384 (+2%) | 14mo | $330,000 | $238 | 52 |
| 2015 Cascade Rd SW | 0.54mi | 3/2.0 (+1) | 1,394 (+3%) | 11mo | $443,000 | $318 | 51 |
| 1340 Downs Dr SW | 0.67mi | 3/2.0 (+1) | 1,328 (-2%) | 9mo | $375,000 | $282 | 50 |
| 2104 Cascade Rd SW | 0.48mi | 2/1.0 | 1,202 (-11%) | 13mo | $130,000 | $108 | 48 |
| 1962 Pine Oak Dr SW | 0.69mi | 3/2.0 (+1) | 1,314 (-3%) | 12mo | $206,000 | $157 | 44 |
| 1951 Handley Ave SW | 0.69mi | 3/3.0 (+1) | 1,421 (+5%) | 8mo | $375,000 | $264 | 40 |
| 888 Beecher Ct SW | 0.67mi | 3/1.0 (+1) | 1,216 (-10%) | 10mo | $180,000 | $148 | 39 |
| 1935 Handley Ave SW | 0.70mi | 3/2.5 (+1) | 1,535 (+14%) | 1mo | $280,000 | $182 | 33 |
Match score weights: distance 35% · size 25% · config 20% · recency 20%. Top-matched comps best support the ARV.
Projected returns pro-forma
-3.0% appreciation · 0.0% rent growth · sell at horizon
- IRR
- 0.9%
- Equity multiple
- 1.03×
- Total profit
- $1,587
- Equity at exit
- $26,227
- IRR
- 7.5%
- Equity multiple
- 1.49×
- Total profit
- $24,346
- Equity at exit
- $15,209
Cash invested: $49,252 (down + closing). Projections, not guarantees.
Landlord ↔ Tenant lean methodology
- Overall (STATE)
- 90 Strongly Landlord-Friendly
- State Georgia
- 90 Strongly Landlord-Friendly · R+3
- County
- — inherits STATE
- City
- — inherits STATE
ZIP-level market 30311
- Home prices YoY
- -33.3%
- Rents YoY
- -0.2%
- Active inventory
- 250
- Price-to-rent
- 7.1×
Monthly cashflow live
- Estimated rent
- $2,067 high interval (Pro) →
- Mortgage (P&I)
- −$922
- Tax from tax record
- −$69 /mo · $826/yr
- Insurance
- −$73
- HOA
- −$0
- Vacancy / Maint / Mgmt
- −$434
- Net cashflow
- $569
Break-even live
Sensitivity live
| Price | -10% $668 | -5% $618 | +0% $569 | +5% $519 | +10% $469 |
|---|---|---|---|---|---|
| Rent | -10% $405 | -5% $487 | +0% $569 | +5% $650 | +10% $732 |
| Rate | -1.0pp $657 | -0.5pp $613 | base $569 | +0.5pp $523 | +1.0pp $477 |
UW: 25.0% down · 7.5% · 30yr · 1.5% tax · 5.0% vac · 8.0% maint · 8.0% mgmt
Financing live
Cash to close
- Down payment
- $43,975
- Closing costs
- $5,277
- Reserves months
- —
- Total cash needed
- —
Loan-product check · same deal, 3 products live
Conventional
25% down · 7.5% · 30yr
- Down + closing
- —
- Monthly P&I
- —
- Monthly cashflow
- —
- DSCR
- —
- Eligible?
- —
Personal DTI + credit; lowest rate.
DSCR
20% down · 8.5% · 30yr
- Down + closing
- —
- Monthly P&I
- —
- Monthly cashflow
- —
- DSCR
- —
- Eligible?
- —
No personal income docs; deal must DSCR.
Hard money
10% down · 12.0% · 12mo
- Down + closing
- —
- Monthly P&I
- —
- Monthly cashflow
- —
- DSCR
- —
- Eligible?
- —
Short-term bridge; refi at stabilization.
Rent comps 40 comps
| Address | Beds | Baths | Sqft | Rent | $/sqft | DOM | Units | Dist |
|---|---|---|---|---|---|---|---|---|
| 2190 Highview Rd SW Atlanta, GA | 3.0 | 2.5 | 1305 | $2,500 | $1.92 | 3d | 1 | 0.02mi |
| 2324 Highview Rd SW Unit A Atlanta, GA | 2.0 | 1.5 | 1200 | $2,000 | $1.67 | 25d | 1 | 0.25mi |
| 2225 Beecher Cir SW Atlanta, GA | 1.0 | 1.5 | 1826 | $865 | $0.47 | 9d | 1 | 0.45mi |
| 2135 Bollingbrook Dr SW Atlanta, GA | 1.0 | 1.0 | 1200 | $500 | $0.42 | 25d | 1 | 0.53mi |
| 2367 Cascade Rd Unit G27 Atlanta, GA | 2.0 | 1.0 | 1815 | $1,300 | $0.72 | 25d | 1 | 0.53mi |
| 2410 Benjamin E Mays Dr SW Atlanta, GA | 2.0 | 1.0 | 1040 | $1,150 | $1.11 | 22d | 1 | 0.54mi |
| 2287 Boulevard Granada SW Atlanta, GA | 3.0 | 2.0 | 1496 | $2,050 | $1.37 | 23d | 1 | 0.59mi |
| 995 Fleetwood Cir SW Atlanta, GA | 3.0 | 2.0 | 1611 | $2,400 | $1.49 | 25d | 1 | 0.62mi |
| 1951 Handley Ave SW Atlanta, GA | 3.0 | 3.0 | 1589 | $3,200 | $2.01 | 25d | 1 | 0.70mi |
| 1876 Sandtown Rd SW Atlanta, GA | 3.0 | 2.0 | 1230 | $2,500 | $2.03 | 25d | 1 | 0.90mi |
| 1735 Alvarado Ter SW Atlanta, GA | 3.0 | 2.0 | 1235 | $1,595 | $1.29 | 23d | 1 | 1.01mi |
| 1731 N Olympian Way SW Atlanta, GA | 2.0 | 1.0 | 1028 | $1,846 | $1.80 | 0d | 1 | 1.08mi |
| 2079 Honeysuckle Ln SW Atlanta, GA | 3.0 | 2.0 | 1500 | $1,900 | $1.27 | 25d | 1 | 1.14mi |
| 1586 Ocala Ave SW Atlanta, GA | 1.0 | 1.0 | 1400 | $600 | $0.43 | 25d | 1 | 1.14mi |
| 1300 Wichita Dr SW Atlanta, GA | 3.0 | 2.0 | 1077 | $2,200 | $2.04 | 25d | 1 | 1.20mi |
| 1346 Wichita Dr SW Atlanta, GA | 3.0 | 2.0 | 1183 | $2,125 | $1.80 | 9d | 1 | 1.21mi |
| 1313 Aniwaka Ave SW Atlanta, GA | 3.0 | 2.0 | 1530 | $2,145 | $1.40 | 3d | 1 | 1.22mi |
| 364 Brooks Ave SW Atlanta, GA | 3.0 | 2.0 | 1134 | $1,495 | $1.32 | 9d | 1 | 1.23mi |
| 1578 Linda Way SW Atlanta, GA | 3.0 | 2.0 | 1343 | $2,030 | $1.51 | 15d | 1 | 1.27mi |
| 1587 Olympian Cir SW Unit B Atlanta, GA | 2.0 | 1.0 | 1086 | $1,300 | $1.20 | 25d | 1 | 1.28mi |
| 1537 Orlando St SW Atlanta, GA | 2.0 | 1.0 | 1068 | $1,700 | $1.59 | 25d | 1 | 1.31mi |
| 324 Brooks Ave SW Unit B Atlanta, GA | 2.0 | 1.0 | 1176 | $1,050 | $0.89 | 25d | 1 | 1.31mi |
| 324 Brooks Ave SW Unit A Atlanta, GA | 2.0 | 1.0 | 1176 | $1,000 | $0.85 | 25d | 1 | 1.31mi |
| 1717 Centra Villa Dr SW Atlanta, GA | 1.0–3.0 | 1.0–2.0 | 1033 | $1,400 | $1.35 | 25d | 1 | 1.32mi |
| 1080 Westmont Rd SW Atlanta, GA | 3.0 | 2.0 | 1022 | $2,500 | $2.45 | 16d | 1 | 1.32mi |
| 316 Henry Aaron Ave SW Atlanta, GA | 3.0 | 2.0 | 1740 | $1,580 | $0.91 | 25d | 1 | 1.33mi |
| 1255 Westmont Rd SW Atlanta, GA | 3.0 | 2.0 | 1500 | $1,695 | $1.13 | 25d | 1 | 1.37mi |
| 763 Cascade Ave SW Atlanta, GA | 2.0 | 1.0 | 900 | $1,249 | $1.39 | 3d | 5 | 1.37mi |
| 966 Gaston St SW Atlanta, GA | 3.0 | 2.5 | 1331 | $2,250 | $1.69 | 25d | 1 | 1.37mi |
| 1246 Westmont Rd SW Atlanta, GA | 3.0 | 1.0 | 1200 | $1,500 | $1.25 | 4d | 1 | 1.39mi |
| 1295 Westmont Rd SW Atlanta, GA | 2.0 | 1.0 | 910 | $1,500 | $1.65 | 25d | 1 | 1.39mi |
| 269 Florida Ave SW Atlanta, GA | 3.0 | 1.0 | 925 | $1,850 | $2.00 | 25d | 1 | 1.41mi |
| 1619 Stokes Ave SW Atlanta, GA | 3.0 | 2.0 | 1332 | $2,400 | $1.80 | 4d | 1 | 1.43mi |
| 1474 Beecher St SW Atlanta, GA | 3.0 | 2.0 | 1332 | $3,200 | $2.40 | 25d | 1 | 1.43mi |
| 1473 Beecher St SW Atlanta, GA | 3.0 | 2.0 | 1547 | $2,600 | $1.68 | 25d | 1 | 1.44mi |
| 1735 Willis Mill Rd SW Atlanta, GA | 3.0 | 2.0 | 1461 | $2,173 | $1.49 | 18d | 1 | 1.44mi |
| 1449 Lynford Dr SW Atlanta, GA | 3.0 | 1.0 | 1242 | $1,895 | $1.53 | 19d | 1 | 1.45mi |
| 1449 Lynford Dr SW Atlanta, GA | 3.0 | 1.0 | 1242 | $1,895 | $1.53 | 25d | 1 | 1.45mi |
| 1404 Lockwood Dr SW Atlanta, GA | 2.0 | 2.0 | 980 | $1,700 | $1.73 | 9d | 1 | 1.45mi |
| 1408 Lockwood Dr SW Atlanta, GA | 3.0 | 2.0 | 1300 | $1,950 | $1.50 | 25d | 1 | 1.46mi |
Listing history 4 events
-
2026-05-12status Under Contract 471-char remark
Show marketing remark (471 chars)
Rare opportunity in Southwest Atlanta! Situated on approximately 2.23 acres, this charming 2-bedroom, 1-bath brick home is full of character and potential. Features include hardwood floors, vintage tile, solid wood cabinetry, and a large private lot. Incredible opportunity for investors, renovators, or buyers looking to personalize a property with acreage inside the city. Sold as-is. Conveniently located near downtown Atlanta, shopping, dining, and major interstates.
-
2026-05-12status Pending
Show marketing remark (471 chars)
Rare opportunity in Southwest Atlanta! Situated on approximately 2.23 acres, this charming 2-bedroom, 1-bath brick home is full of character and potential. Features include hardwood floors, vintage tile, solid wood cabinetry, and a large private lot. Incredible opportunity for investors, renovators, or buyers looking to personalize a property with acreage inside the city. Sold as-is. Conveniently located near downtown Atlanta, shopping, dining, and major interstates.
-
2026-05-08$175,900 New 471-char remark
Show marketing remark (471 chars)
Rare opportunity in Southwest Atlanta! Situated on approximately 2.23 acres, this charming 2-bedroom, 1-bath brick home is full of character and potential. Features include hardwood floors, vintage tile, solid wood cabinetry, and a large private lot. Incredible opportunity for investors, renovators, or buyers looking to personalize a property with acreage inside the city. Sold as-is. Conveniently located near downtown Atlanta, shopping, dining, and major interstates.
-
2026-05-08$175,900 Active
Show marketing remark (471 chars)
Rare opportunity in Southwest Atlanta! Situated on approximately 2.23 acres, this charming 2-bedroom, 1-bath brick home is full of character and potential. Features include hardwood floors, vintage tile, solid wood cabinetry, and a large private lot. Incredible opportunity for investors, renovators, or buyers looking to personalize a property with acreage inside the city. Sold as-is. Conveniently located near downtown Atlanta, shopping, dining, and major interstates.
ⓘ Source: listings_history table (triggers on properties + properties_extension) + one-shot
backfill from property_details.listing_events for pre-trigger history.
Tax reassessment forecast GA · Resets to sale price
- Current annual tax
- $826 · $69/mo
- Projected year-2 tax
- $1,618 · $135/mo
- Expected delta
- +$792/yr (+$66/mo · 95.9%)
ⓘ Screening estimate from a state-policy table — verify with the county assessor before closing.
Climate risk First Street
- Flood 1/10 Low FEMA zone X (unshaded) · 0% chance over 30 yrs
- Wildfire 3/10 Moderate
- Heat 5/10 Major 7 d/yr ≥104°F today · 17 d/yr by 30 yrs out
- Wind 4/10 Moderate 24% chance of damaging wind over 30 yrs
- Air quality 3/10 Moderate 3 unhealthy d/yr today · 3 by 30 yrs out
Nearby sold comps map
Loading sold comps map…
Walkable amenities ~0.75 mi
Loading nearby amenities…
Taxation est. · year 1
- Rental income
- $24,807
- − Mortgage interest
- −$9,853
- − Property taxes
- −$826
- − Insurance
- −$880
- − Repairs & maintenance
- −$1,985
- − Management
- −$1,985
- − Depreciation
- −$5,117
- Taxable income
- $4,162
- Est. tax owed @ 24.0%
- −$999
- After-tax cash flow
- $5,824/yr
For passive investors: Depreciation is non-cash, so a rental often shows a tax loss while cash-flowing — sheltering income. Rental losses are passive: they offset passive income freely, and up to $25,000/yr can offset ordinary (W-2) income if you actively participate and your MAGI is under $100k (phasing out to $0 by $150k); unused losses carry forward. On sale, claimed depreciation is recaptured at up to 25%, and gains may owe capital-gains tax (a 1031 exchange can defer both). Figures are a year-1 estimate at your 24.0% rate — not tax advice; consult a CPA.
Schools (NCES district)
- District
- Atlanta Public Schools
- NCES district ID
- 1300120
- Math proficiency
- 28% ▼ -6.00%
- Reading proficiency
- 35% ▼ -2.00%
- Median HH income
- $48,306
- Composite
- 27.27/100
- National rank
- #7006
- State rank
- #80 of 174 in GA
Livability — Atlanta
- Score
- 83/100
- State rank
- #6
- US rank
- #919
Category grades
Schools grade is shown separately in the Schools card above.
Census & demographics
- Census place
- Atlanta, GA
- County
- Fulton County · 1,094,430 people
- City population
- 629,525
- Metro
- Atlanta-Sandy Springs-Alpharetta, GA
- Population (ZIP)
- 34,953
- Household income
- $50,649
- Rent vs Own
- Severe rent burden
- 2825.0
Population outlook (Fulton County) Hauer SSP2
- Today (2025)
- 1,203,707 people
- By 2030
- 1,299,706 · +8.0%
- By 2040
- 1,488,256 · +23.6%
- By 2050
- 1,664,580 · +38.3%
- By 2075
- 2,036,072 · +69.2%
- By 2100
- 2,222,402 · +84.6%
Race, ethnicity, and origin ACS 2023
- Neighborhood character
- Predominantly Black (89%)
- Race & ethnicity
- Black 89% Hispanic / Latino 4% Two or more races 4% White 3%
- Common ancestry
- Hispanic 1%
- Foreign-born
- 5% · Canada
- Languages at home
- 93% English-only · Spanish 3% French/Haitian/Cajun 1% Korean 1%
Political lean MEDSL · Fulton
- 2024 margin
- Solid D (+44.9) · D 71.9% · R 27.0% · Other 1.1%
- 2008→2024 swing
- +9.8pp toward D · 2008: 35.0pp · 2024: 44.9pp
- All cycles
- 2024: D+44.9 2020: D+46.4 2016: D+42.1 2012: D+29.6 2008: D+35.0
Not yet ingested
- Civics
- —
Market trends
- HPI YoY
- ▼ -129.99%
- Current HPI
- 259.954
- Rent YoY
- ▼ -0.19%
- Metro
- Atlanta-Sandy Springs-Alpharetta, GA
- State GDP YoY
- ▲ 2.66%
- F500 in state
- 28
Industry mix (Fortune 500 HQ in GA)
| Industry | F500 HQs | Revenue |
|---|---|---|
| Paper / Packaging | 2 | $29B |
|
||
| Retail | 1 | $160B |
|
||
| Transportation / Logistics | 1 | $91B |
|
||
| Airlines | 1 | $62B |
|
||
| Consumer Goods | 1 | $47B |
|
||
| Utilities | 1 | $25B |
|
||
Price history
+0.0% since first listed4 events — show timeline
- 2026-05-12 Pending — GAMLS
- 2026-05-12 Pending — FMLS
- 2026-05-08 Listed $175,900 FMLS
- 2026-05-08 Listed $175,900 GAMLS
Property tax history
+17.9%/yrLatest (2024): $826 · +80.7% YoY. Source: county tax records.
Cash-flow waterfall
monthlySold comps — $/sqft
last 12 mo · ≤1 miLoading sold comps…