1406 University City Blvd Unit F · Blacksburg, VA
Flood risk 1/10 · Minimal
- FEMA flood zone
- X (unshaded)
- Chance of flooding over 30 yrs
- 0.0%
- Est. flood insurance / yr
- $507 – $1,088
Fire risk 4/10 · Minor
- Est. fire insurance / yr
- $666 – $1,236
Heat risk 3/10 · Minor
- Hot days now (above 94°F)
- 7 days/yr
- Hot days in 30 yrs
- 17 days/yr
Wind risk 2/10 · Minimal
- Chance of severe wind over 30 yrs
- 1.0%
Air-quality risk 1/10 · Minimal
- Unhealthy air days now
- 0 days/yr
- Unhealthy air days in 30 yrs
- 0 days/yr
Risk factors via First Street. Map © Google.
Why this score? — see what drove the D grade
The composite is a weighted blend of 9 inputs, each scored 0–100. Each bar is that input's sub-score; the figure is the points it added to the 100-point composite (weight × sub-score).
- Cash flow +11.4/30.0
- ARV discount +7.5/15.0
- Schools +5.4/10.0
- Livability +4.4/5.0
- Rent growth +3.5/5.0
- 1% rule +3.4/10.0
- DSCR +3.3/10.0
- Condition / age +2.5/5.0
- Appreciation +0.0/10.0
$150,000
🖨 Deal sheet (PDF) 📄 Offer letter ✓ Due diligence
Listing remarks
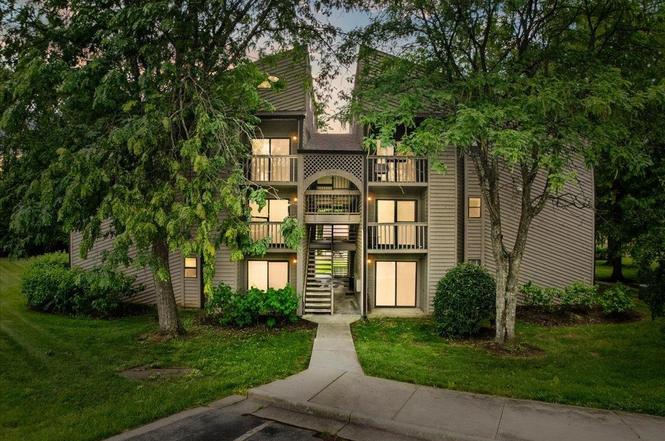
Ground-level 1BD, 1BA condo in Sundance Village just minutes away from Virginia Tech campus, Downtown Blacksburg, the 460 Bypass, and so many other local amenities. This property boasts a consistent rental history and competitive tenant pool, making it a prime opportunity for seasoned investors or those looking to start building their portfolio. Schedule your showing today!
Key facts
- $137 HOA
- Built 1987
- Listed 6 days
Property features AI
Finance
- HOA & community: Homeowners association with an annual fee of $1,644 (about $137/month)
Exterior
- Utilities: Public water; Public sewer
- Home design: Condominium; One story / ground-level unit; Located in Sundance Village subdivision
- Construction: Wood siding; Shingle roof; Built with above-grade finished area of 504
- Exterior features: Patio
Interior
- Kitchen: Dishwasher; Electric range; Refrigerator
- Flooring: Carpet; Laminate
- Bathrooms: One full bathroom
- Heating & cooling: Heat pump heating
- Interior features: Electric water heater; Three total rooms
Neighborhood map
What this means for you Summary
Snapshot
- This is a 1-bed/1.0-bath condo listed at $150k.
Deal economics
- At list price, monthly cash flow is $-53 ($-632/yr) — negative.
- To cash-flow at today's rent, offer at most $141k (6.2% below list).
- To meet the 1% rule (rent ≥ 1% of price), the offer needs to be $126k (15.8% below list).
- Recommended offer: $126k (15.8% below list) — sets the bar for 1% rule.
- Cap rate 5.9% vs local median 2.5% in Blacksburg — top-decile yield for the area; either an underpriced asset or a hidden risk that comps aren't pricing in. Stress-test before assuming the spread holds.
Location & tenants
- Location reads 88/100 on livability (#8 in VA, #215 nationally) — a professional / high-income tenant draw. Strengths: crime A+, amenities A+, commute A+; Watch: cost of living C-, housing C-.
- Montgomery County Public School District (urban): math 57% / reading 70% proficiency, ranked #47 of 131 in VA (top 36%) — acceptable for families but not a draw, mixed tenant base, ~2y average lease.
- Zoned schools: Gilbert Linkous Elementary (math 87% / reading 82%, grade A+, #71 of 1,108 statewide, top 8%, 329 students, 24% FRL); Blacksburg Middle (math 62% / reading 77%, grade A, #85 of 342 statewide, top 26%, 946 students, 30% FRL); Blacksburg High (math 80% / reading 92%, grade A, #20 of 319 statewide, top 6%, 1,321 students, 23% FRL).
- Zoned-school proficiency averages 80% at this address vs 64% district-wide (+16 pts) — the actual schools serving this property are materially stronger than the Montgomery County Public School District average implies; a family-tenant draw the district grade alone would hide.
- Market conditions: Rents rising (+4.0%/yr); 315 active listings in the ZIP; 4 comparable units currently listed for rent nearby; rentals lingering (median 46d on market — plan ~5-8 weeks vacancy on turnover, expect pricing pressure); 100% of comp listings sitting > 30 days — soft ceiling on asking rent; 323 units permitted in Montgomery County in 2024 (0 in 5+ unit buildings).
Forward outlook
- Local home prices are declining (-3.0%/yr); year-one equity from $1k of loan paydown is wiped out by about $4k of value loss. Plan a longer hold.
- Montgomery County population projected at +13% by 2050 — modest demand growth; plan on rents tracking national, not racing it.
Negotiation context
- Only 6 days on market — expect competitive offers; lowballing is unlikely to land.
Questions for the listing agent
- What do current leases actually rent for vs. the listed asking? Can we see a recent rent roll and the last 12 months of T-12 income?
- What does the HOA fee cover, when was the last increase, and are there any pending special assessments or reserve-fund shortfalls?
- Any open or pending special assessments — roof, HVAC, plumbing, elevator, façade? What's the per-unit balance and payoff schedule, and is the seller paying it off at close or rolling it to the buyer?
- Is there a deadline driving the sale (1031 exchange, divorce, estate, relocation)? That informs how much negotiation room exists.
- Schools are A-rated — typically a magnet for longer-tenancy family renters. What's the average tenant stay here, and is there a school-zone premium baked into asking?
- The area grade is low — what's the realistic commute time and amenity access for the typical tenant pool here? Any planned neighborhood developments (good or bad) we should know about?
- What's the average days-on-market for RENTAL listings here right now (not sales)? A rising rental-DOM trend means longer vacancies and softer asking-rent achievability than the comps imply.
- What's the recent tenant-quality profile in this submarket — average credit score on applications, eviction rate, late-payment / NSF rate, and stable-employment percentage? A property-management company in the area should have these aggregated.
- How much new apartment / multifamily construction is in the pipeline within 1–3 miles? Heavy new supply (>2% of stock underway) typically softens rents 12–24 months out; light construction supports rent growth.
Investment metrics
- 1% rule
- 0.84% ✗
- Cap rate
- 5.87%
- Cash-on-cash
- -1.51%
- DSCR
- 0.93
- GRM
- 9.9
CMA / ARV
No comps found within radius.
Projected returns pro-forma
-3.0% appreciation · 3.95% rent growth · sell at horizon
- IRR
- -17.7%
- Equity multiple
- 0.37×
- Total profit
- $-26,416
- Equity at exit
- $22,365
- IRR
- -8.0%
- Equity multiple
- 0.47×
- Total profit
- $-22,112
- Equity at exit
- $12,969
Cash invested: $42,000 (down + closing). Projections, not guarantees.
Landlord ↔ Tenant lean methodology
- Overall (STATE)
- 55 Moderately Landlord-Leaning
- State Virginia
- 55 Moderately Landlord-Leaning · D+2
- County
- — inherits STATE
- City
- — inherits STATE
ZIP-level market 24060
- Rents YoY
- 4.0%
- Active inventory
- 315
- Price-to-rent
- 9.9×
Monthly cashflow live
- Estimated rent
- $1,263 medium interval (Pro) →
- Mortgage (P&I)
- −$787
- Tax from tax record
- −$65 /mo · $775/yr
- Insurance
- −$62
- HOA
- −$137
- Vacancy / Maint / Mgmt
- −$265
- Net cashflow
- $-53
Break-even live
Sensitivity live
| Price | -10% $32 | -5% $-10 | +0% $-53 | +5% $-95 | +10% $-138 |
|---|---|---|---|---|---|
| Rent | -10% $-152 | -5% $-103 | +0% $-53 | +5% $-3 | +10% $47 |
| Rate | -1.0pp $23 | -0.5pp $-15 | base $-53 | +0.5pp $-92 | +1.0pp $-131 |
UW: 25.0% down · 7.5% · 30yr · 1.5% tax · 5.0% vac · 8.0% maint · 8.0% mgmt
Financing live
Cash to close
- Down payment
- $37,500
- Closing costs
- $4,500
- Reserves months
- —
- Total cash needed
- —
Loan-product check · same deal, 3 products live
Conventional
25% down · 7.5% · 30yr
- Down + closing
- —
- Monthly P&I
- —
- Monthly cashflow
- —
- DSCR
- —
- Eligible?
- —
Personal DTI + credit; lowest rate.
DSCR
20% down · 8.5% · 30yr
- Down + closing
- —
- Monthly P&I
- —
- Monthly cashflow
- —
- DSCR
- —
- Eligible?
- —
No personal income docs; deal must DSCR.
Hard money
10% down · 12.0% · 12mo
- Down + closing
- —
- Monthly P&I
- —
- Monthly cashflow
- —
- DSCR
- —
- Eligible?
- —
Short-term bridge; refi at stabilization.
Rent comps 4 comps
| Address | Beds | Baths | Sqft | Rent | $/sqft | DOM | Units | Dist |
|---|---|---|---|---|---|---|---|---|
| 810 University City Blvd Unit PWC 13 Blacksburg, VA | — | 1.0 | 375 | $895 | $2.39 | 45d | 1 | 0.58mi |
| 115 Hearthstone Dr Unit 115-B3 Blacksburg, VA | 1.0 | 1.0 | 684 | $1,440 | $2.11 | 45d | 1 | 0.62mi |
| 202 Bennett St Blacksburg, VA | 1.0 | 1.0 | 522 | $860 | $1.65 | 45d | 1 | 1.15mi |
| 870 Plantation Rd Blacksburg, VA | 1.0–2.0 | 1.0–2.0 | 891 | $1,491 | $1.67 | 45d | 1 | 1.42mi |
HOA detail condo
- Monthly dues
- $137 · $1,644/yr
- Likely covers
- pool
- Assessments
- None detected in remarks — confirm with the listing agent.
Listing history 6 events
-
2026-06-21days on market $150,000 Active 6 DOM
-
2026-06-19days on market $150,000 Active 4 DOM
-
2026-06-18days on market $150,000 Active 3 DOM
-
2026-06-17days on market $150,000 Active 2 DOM
-
2026-06-15remarks 376-char remark
-
2026-06-15$150,000 Active 1 DOM
ⓘ Source: listings_history table (triggers on properties + properties_extension) + one-shot
backfill from property_details.listing_events for pre-trigger history.
Tax reassessment forecast VA · Resets to sale price
- Current annual tax
- $775 · $65/mo
- Projected year-2 tax
- $1,230 · $102/mo
- Expected delta
- +$455/yr (+$38/mo · 58.7%)
ⓘ Screening estimate from a state-policy table — verify with the county assessor before closing.
Climate risk First Street
- Flood 1/10 Low FEMA zone X (unshaded) · 0% chance over 30 yrs
- Wildfire 4/10 Moderate
- Heat 3/10 Moderate 7 d/yr ≥94°F today · 17 d/yr by 30 yrs out
- Wind 2/10 Low 100% chance of damaging wind over 30 yrs
- Air quality 1/10 Low 0 unhealthy d/yr today · 0 by 30 yrs out
Nearby sold comps map
Loading sold comps map…
Walkable amenities ~0.75 mi
Loading nearby amenities…
Taxation est. · year 1
- Rental income
- $15,160
- − Mortgage interest
- −$8,402
- − Property taxes
- −$775
- − Insurance
- −$750
- − Repairs & maintenance
- −$1,213
- − Management
- −$1,213
- − HOA
- −$1,644
- − Depreciation
- −$4,364
- Taxable loss
- −$3,201
- Est. tax savings @ 24.0%
- +$768
- After-tax cash flow
- $136/yr
For passive investors: Depreciation is non-cash, so a rental often shows a tax loss while cash-flowing — sheltering income. Rental losses are passive: they offset passive income freely, and up to $25,000/yr can offset ordinary (W-2) income if you actively participate and your MAGI is under $100k (phasing out to $0 by $150k); unused losses carry forward. On sale, claimed depreciation is recaptured at up to 25%, and gains may owe capital-gains tax (a 1031 exchange can defer both). Figures are a year-1 estimate at your 24.0% rate — not tax advice; consult a CPA.
Schools (NCES district)
- District
- Montgomery County Public School District
- NCES district ID
- 5102520
- Math proficiency
- 57% ▼ -29.00%
- Reading proficiency
- 70% ▼ -11.00%
- Median HH income
- $46,618
- Composite
- 53.6/100
- National rank
- #1440
- State rank
- #47 of 131 in VA
Livability — Blacksburg
- Score
- 88/100
- State rank
- #8
- US rank
- #215
Category grades
Schools grade is shown separately in the Schools card above.
Census & demographics
- Census place
- Blacksburg, VA
- County
- Montgomery County · 78,218 people
- City population
- 48,541
- Metro
- Blacksburg-Christiansburg, VA
- Population (ZIP)
- 48,541
- Household income
- $67,675
- Rent vs Own
- Severe rent burden
- 3694.0
Population outlook (Montgomery County) Hauer SSP2
- Today (2025)
- 105,748 people
- By 2030
- 110,301 · +4.3%
- By 2040
- 115,652 · +9.4%
- By 2050
- 119,651 · +13.1%
- By 2075
- 126,005 · +19.2%
- By 2100
- 129,771 · +22.7%
Race, ethnicity, and origin ACS 2023
- Neighborhood character
- Predominantly White (80%)
- Race & ethnicity
- White 80% Asian 8% Two or more races 4% Hispanic / Latino 4% Black 3%
- Common ancestry
- Romanian 3% Italian 3% Slovak 2%
- Foreign-born
- 14% · China, Canada, South Korea
- Languages at home
- 86% English-only · Other Indo-European 4% Chinese 3% Spanish 3%
Political lean MEDSL · Montgomery
- 2024 margin
- Toss-up / Even · D 50.9% · R 47.4% · Other 1.7%
- 2008→2024 swing
- -1.4pp toward R · 2008: 4.9pp · 2024: 3.5pp
- All cycles
- 2024: D+3.5 2020: D+5.8 2016: D+1.3 2012: R+0.2 2008: D+4.9
Not yet ingested
- Civics
- —
Market trends
- HPI YoY
- ▼ -176.54%
- Current HPI
- 289.8166
- Rent YoY
- ▲ 3.95%
- Metro
- Blacksburg-Christiansburg, VA
- State GDP YoY
- ▲ 2.40%
- F500 in state
- 50
Industry mix (Fortune 500 HQ in VA)
| Industry | F500 HQs | Revenue |
|---|---|---|
| Aerospace / Defense | 4 | $236B |
|
||
| Technology / Defense | 3 | $32B |
|
||
| Financial Services | 2 | $176B |
|
||
| Utilities | 2 | $27B |
|
||
| Insurance | 2 | $25B |
|
||
| Technology | 2 | $15B |
|
||
Price history
1 event — show timeline
- 2026-06-15 Listed $150,000 NRVMLS
Property tax history
+2.4%/yrLatest (2025): $775 · +1.3% YoY. Source: county tax records.
Cash-flow waterfall
monthlySold comps — $/sqft
last 12 mo · ≤1 miLoading sold comps…