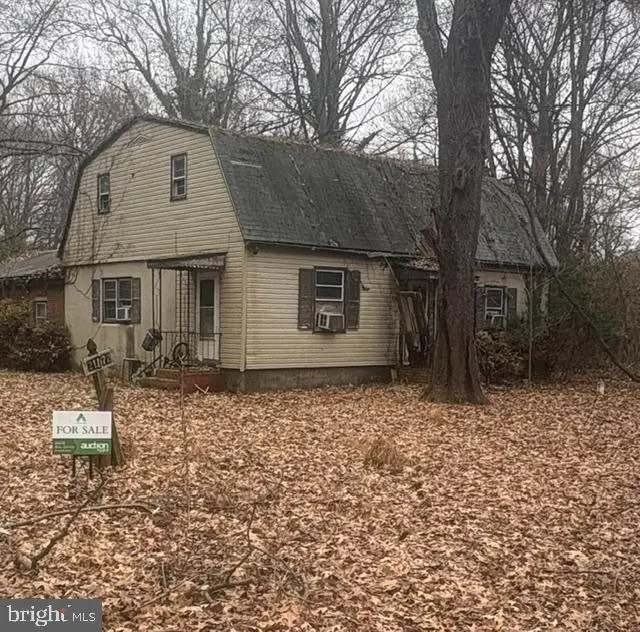
21172 Wyoming Ave · Tolchester, MD
Flood risk 1/10 · Minimal
- FEMA flood zone
- X (unshaded)
- Chance of flooding over 30 yrs
- 0.0%
- Est. flood insurance / yr
- $507 – $1,088
Fire risk 3/10 · Minor
- Est. fire insurance / yr
- $755 – $1,403
Heat risk 8/10 · Major
- Hot days now (above 105°F)
- 7 days/yr
- Hot days in 30 yrs
- 15 days/yr
Wind risk 6/10 · Moderate
- Chance of severe wind over 30 yrs
- 69.0%
Air-quality risk 6/10 · Moderate
- Unhealthy air days now
- 9 days/yr
- Unhealthy air days in 30 yrs
- 13 days/yr
Risk factors via First Street. Map © Google.
Why this score? — see what drove the C- grade
The composite is a weighted blend of 9 inputs, each scored 0–100. Each bar is that input's sub-score; the figure is the points it added to the 100-point composite (weight × sub-score).
- Cash flow +23.7/30.0
- DSCR +7.6/10.0
- ARV discount +7.5/15.0
- 1% rule +5.7/10.0
- Livability +3.0/5.0
- Rent growth +2.5/5.0
- Condition / age +2.5/5.0
- Schools +1.7/10.0
- Appreciation +0.0/10.0
$200,000
🖨 Deal sheet 📄 Offer letter ✓ Due diligence
Listing remarks MLS
OWNER SAYS PLEASE BRING AN OFFER! THIS IS A VERY BIG HOUSE LOCATED NEAR A LANDING AND MARINA WITH A COMMUNITY BEACH! THE UPSTAIRS HAD BEEN USED AS AN APARTMENT AND STILL INCLUDES AN UPSTAIRS KITCHEN, LIVING SPACE AND 2 BEDROOMS. WHAT A GREAT SPOT FOR YOUR GUESTS OR LONG TERM COMPANY. NICE, PRIVATE LOCATION NESTLED IN SOME SHADY WOODS. MUST SEE!
Key facts
- 0.28 acre lot
- Built 1972
- Listed 13 days
Property features AI
Finance
- Financial info: Improvement assessed value reported; Land assessed value reported; Tax assessed value and annual county tax reported; Assessment year reported
Exterior
- Parking: Driveway
- Utilities: Public sewer
- Home design: Detached structure; Fee simple ownership; Property condition listed as below average; Above-grade finished area reported by assessor
- Construction: Other foundation type; Year built reported by assessor
- Exterior features: No tidal water on the property; Other above- and below-grade structures
Interior
- Bedrooms: 4 bedrooms on the main level
- Bathrooms: 1 full bathroom on the main level; 1 full bathroom total
- Heating & cooling: Has fireplace (1 total)
- Interior features: Assessor reported living area; Basement present (other type)
Neighborhood map
What this means for you Summary
Snapshot
- This is a 4-bed/3.0-bath single-family listed at $200k.
Deal economics
- At list price, monthly cash flow is $382 ($5k/yr) — positive.
- The deal already cash-flows at list — no discount required.
- Meets the 1% rule at list price ($2k rent vs $200k).
Location & tenants
- Location reads 59/100 on livability (#368 in MD) — a working-class tenant base; expect higher turnover. Strengths: employment A+, housing A+; Watch: crime C-, cost of living D, amenities F.
- Kent County Public Schools (rural): math 10% / reading 28% proficiency, ranked #20 of 24 in MD (top 83%) — low school quality limits family demand, transient renter base, plan for 1-2y turnover.
- Zoned schools: Kent County High (math 27% / reading 57%, grade F, #126 of 222 statewide, top 57%, 531 students, 54% FRL).
- Zoned-school proficiency averages 42% at this address vs 19% district-wide (+23 pts) — the actual schools serving this property are materially stronger than the Kent County Public Schools average implies; a family-tenant draw the district grade alone would hide.
- Market conditions: 124 active listings in the ZIP; solid renter incomes; 50 units permitted in Kent County in 2024 (0 in 5+ unit buildings).
- This rent runs 32% of the median local income ($81k/yr) — at the standard rent-burdened threshold; future hikes will face affordability resistance.
Forward outlook
- Local home prices are declining (-3.0%/yr); year-one equity from $1k of loan paydown is wiped out by about $6k of value loss. Plan a longer hold.
- Kent County population projected at -20% by 2050 — secular population decline; favor cash flow + early exit over multi-decade hold.
Negotiation context
- Only 13 days on market — expect competitive offers; lowballing is unlikely to land.
- 7 sale attempts since 30y ago with the ask held roughly flat each time — persistent listings suggest the price (not the market) is what's stuck; bring a comps-based counter.
Risks & watch-outs
- Climate carrying-cost: major wind risk, 69% chance of damaging wind over 30y; extreme-heat days projected 7→15/yr by 2055 (HVAC capex compounding) — expect insurance premiums to compound above CPI over the hold.
Questions for the listing agent
- Built in 1972 — when were the roof, HVAC, electrical panel, plumbing, and water heater last replaced?
- Is there a deadline driving the sale (1031 exchange, divorce, estate, relocation)? That informs how much negotiation room exists.
- What's the average days-on-market for RENTAL listings here right now (not sales)? A rising rental-DOM trend means longer vacancies and softer asking-rent achievability than the comps imply.
- What's the recent tenant-quality profile in this submarket — average credit score on applications, eviction rate, late-payment / NSF rate, and stable-employment percentage? A property-management company in the area should have these aggregated.
- How much new for-sale + rental construction is in the pipeline within 1–3 miles? Heavy new supply typically softens prices + rents 12–24 months out; constrained supply supports both.
Investment metrics
- 1% rule
- 1.07% ✓
- Cap rate
- 8.58%
- Cash-on-cash
- 8.19%
- DSCR
- 1.36
- GRM
- 7.8
CMA / ARV
- ARV (on-the-fly)
- $1,460,000
- Comps found
- 3
Show comp detail 3 sales within ~0.75 mi
| Address | Dist | Beds/Ba | Sqft | Sold | Price | $/sf | Match |
|---|---|---|---|---|---|---|---|
| 21082 Wyoming Ave | 0.17mi | 3/3.5 (-1) | 2,699 (-8%) | 9mo | $1,350,000 | $500 | 65 |
| 9050 Point Ln | 0.53mi | 4/3.0 | 3,166 (+8%) | 12mo | $745,000 | $235 | 52 |
| 8974 S Bayview Dr | 0.41mi | 4/3.5 | 3,232 (+11%) | 24mo | $2,395,000 | $741 | 41 |
Match score weights: distance 35% · size 25% · config 20% · recency 20%. Top-matched comps best support the ARV.
Projected returns pro-forma
-3.0% appreciation · 3.0% rent growth · sell at horizon
- IRR
- -3.9%
- Equity multiple
- 0.86×
- Total profit
- $-8,088
- Equity at exit
- $29,821
- IRR
- 5.8%
- Equity multiple
- 1.43×
- Total profit
- $24,251
- Equity at exit
- $17,292
Cash invested: $56,000 (down + closing). Projections, not guarantees.
Landlord ↔ Tenant lean methodology
- Overall (STATE)
- 27 Tenant-Leaning
- State Maryland
- 27 Tenant-Leaning · D+14
- County
- — inherits STATE
- City
- — inherits STATE
ZIP-level market 21620
- Home prices YoY
- -5.3%
- Active inventory
- 124
- Price-to-rent
- 7.8×
Monthly cashflow live
- Estimated rent
- $2,150 medium interval (Pro) →
- Mortgage (P&I)
- −$1,049
- Tax from tax record
- −$184 /mo · $2,208/yr
- Insurance
- −$83
- HOA
- −$0
- Vacancy / Maint / Mgmt
- −$451
- Net cashflow
- $382
Break-even live
UW: 25.0% down · 7.5% · 30yr · 1.5% tax · 5.0% vac · 8.0% maint · 8.0% mgmt
Financing live
Cash to close
- Down payment
- $50,000
- Closing costs
- $6,000
- Reserves months
- —
- Total cash needed
- —
Loan-product check · same deal, 3 products live
Conventional
25% down · 7.5% · 30yr
- Down + closing
- —
- Monthly P&I
- —
- Monthly cashflow
- —
- DSCR
- —
- Eligible?
- —
Personal DTI + credit; lowest rate.
DSCR
20% down · 8.5% · 30yr
- Down + closing
- —
- Monthly P&I
- —
- Monthly cashflow
- —
- DSCR
- —
- Eligible?
- —
No personal income docs; deal must DSCR.
Hard money
10% down · 12.0% · 12mo
- Down + closing
- —
- Monthly P&I
- —
- Monthly cashflow
- —
- DSCR
- —
- Eligible?
- —
Short-term bridge; refi at stabilization.
Listing history 10 events
-
2026-06-18days on market $200,000 Active 13 DOM
-
2026-06-17days on market $200,000 Active 12 DOM
-
2026-06-16days on market $200,000 Active 11 DOM
-
2026-06-15days on market $200,000 Active 10 DOM
-
2026-06-13days on market $200,000 Active 8 DOM
-
2026-06-13days on market $200,000 Active 7 DOM
-
2026-06-09days on market $200,000 Active 4 DOM
-
2026-06-08days on market $200,000 Active 3 DOM
-
2026-06-07remarks 189-char remark
-
2026-06-07$200,000 Active 2 DOM
ⓘ Source: listings_history table (triggers on properties + properties_extension) + one-shot
backfill from property_details.listing_events for pre-trigger history.
Tax reassessment forecast MD · Partial reset (capped growth)
- Current annual tax
- $2,208 · $184/mo
- Projected year-2 tax
- $2,208 · $184/mo
- Expected delta
- $0/yr ($0/mo · 0.0%)
ⓘ Screening estimate from a state-policy table — verify with the county assessor before closing.
Climate risk First Street
- Flood 1/10 Low FEMA zone X (unshaded) · 0% chance over 30 yrs
- Wildfire 3/10 Moderate
- Heat 8/10 Severe 7 d/yr ≥105°F today · 15 d/yr by 30 yrs out
- Wind 6/10 Major 69% chance of damaging wind over 30 yrs
- Air quality 6/10 Major 9 unhealthy d/yr today · 13 by 30 yrs out
Nearby sold comps map
Loading sold comps map…
Walkable amenities ~0.75 mi
Loading nearby amenities…
Taxation est. · year 1
- Rental income
- $25,794
- − Mortgage interest
- −$11,203
- − Property taxes
- −$2,208
- − Insurance
- −$1,000
- − Repairs & maintenance
- −$2,064
- − Management
- −$2,064
- − Depreciation
- −$5,818
- Taxable income
- $1,438
- Est. tax owed @ 24.0%
- −$345
- After-tax cash flow
- $4,239/yr
For passive investors: Depreciation is non-cash, so a rental often shows a tax loss while cash-flowing — sheltering income. Rental losses are passive: they offset passive income freely, and up to $25,000/yr can offset ordinary (W-2) income if you actively participate and your MAGI is under $100k (phasing out to $0 by $150k); unused losses carry forward. On sale, claimed depreciation is recaptured at up to 25%, and gains may owe capital-gains tax (a 1031 exchange can defer both). Figures are a year-1 estimate at your 24.0% rate — not tax advice; consult a CPA.
Schools (NCES district)
- District
- Kent County Public Schools
- NCES district ID
- 2400450
- Math proficiency
- 10% ▼ -13.00%
- Reading proficiency
- 28% ▼ -9.00%
- Median HH income
- $53,748
- Composite
- 17.37/100
- National rank
- #9072
- State rank
- #20 of 24 in MD
Livability — Tolchester
- Score
- 59/100
- State rank
- #368
- US rank
- #19849
Category grades
Schools grade is shown separately in the Schools card above.
Census & demographics
- Census place
- Tolchester, MD
- County
- Kent County · 13,810 people
- Metro
- Baltimore-Columbia-Towson, MD
- Population (ZIP)
- 13,810
- Household income
- $80,530
- Rent vs Own
- Severe rent burden
- 444.0
Population outlook (Kent County) Hauer SSP2
- Today (2025)
- 18,915 people
- By 2030
- 18,192 · -3.8%
- By 2040
- 16,601 · -12.2%
- By 2050
- 15,089 · -20.2%
- By 2075
- 12,441 · -34.2%
- By 2100
- 10,191 · -46.1%
Race, ethnicity, and origin ACS 2023
- Neighborhood character
- Predominantly White (77%)
- Race & ethnicity
- White 77% Black 14% Hispanic / Latino 4% Two or more races 3% Asian 1%
- Common ancestry
- Romanian 4% Slovak 2% Lithuanian 1%
- Foreign-born
- 4% · Canada
- Languages at home
- 96% English-only · Spanish 2% Other Indo-European 1%
Political lean MEDSL · Kent
- 2024 margin
- Toss-up / Even · D 47.4% · R 50.2% · Other 2.3%
- 2008→2024 swing
- -3.3pp toward R · 2008: 0.5pp · 2024: -2.8pp
- All cycles
- 2024: R+2.8 2020: D+1.2 2016: R+4.6 2012: R+0.9 2008: D+0.5
Not yet ingested
- Civics
- —
Market trends
- HPI YoY
- ▼ -15.95%
- Current HPI
- 286.6638
- Rent YoY
- —
- Metro
- Baltimore-Columbia-Towson, MD
- State GDP YoY
- ▲ 2.97%
- F500 in state
- 12
Industry mix (Fortune 500 HQ in MD)
| Industry | F500 HQs | Revenue |
|---|---|---|
| Aerospace / Defense | 1 | $71B |
|
||
| Utilities | 1 | $25B |
|
||
| Hotels | 1 | $24B |
|
||
| Consumer Goods | 1 | $7B |
|
||
| Real Estate | 1 | $6B |
|
||
| Chemicals | 1 | $2B |
|
||
Price history
+101.0% since first listed17 events — show timeline
- 2026-06-05 Listed $200,000 BRIGHT MLS
- 2006-09-20 Sold (Public Records) $195,000 Public Records
- 2006-05-12 Sold (MLS) $195,000 MRIS
- 2006-04-05 Delisted — MRIS
- 2005-07-19 Delisted — MRIS
- 2005-07-19 Listed $199,900 MRIS
- 2005-05-03 Listed — MRIS
- 2002-07-01 Delisted — MRIS
- 2002-06-28 Sold (Public Records) $97,500 Public Records
- 2002-06-28 Sold (MLS) $97,500 MRIS
- 2002-03-15 Delisted — MRIS
- 2001-09-12 Listed — MRIS
- 1999-12-06 Listed $99,500 MRIS
- 1999-11-19 Delisted — MRIS
- 1999-11-15 Delisted — MRIS
- 1998-08-19 Listed — MRIS
- 1996-07-01 Listed — MRIS
Property tax history
+2.4%/yrLatest (2025): $2,208 · +5.4% YoY. Source: county tax records.
Cash-flow waterfall
monthlySold comps — $/sqft
last 12 mo · ≤1 miLoading sold comps…