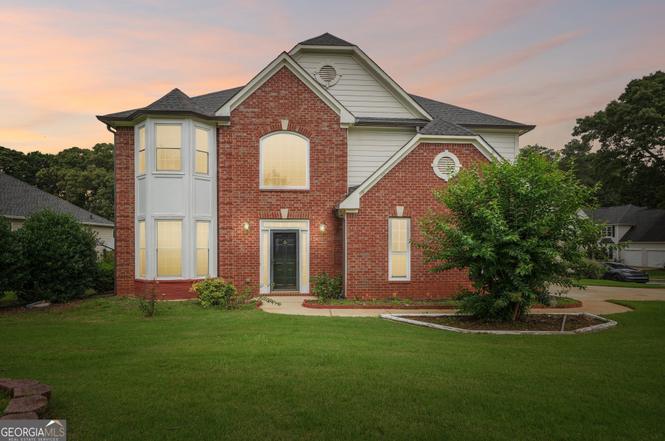
5024 Huntcrest Dr SW · Mableton, GA
Flood risk 1/10 · Minimal
- FEMA flood zone
- X (unshaded)
- Chance of flooding over 30 yrs
- 0.0%
- Est. flood insurance / yr
- $507 – $1,088
Fire risk 3/10 · Minor
- Est. fire insurance / yr
- $963 – $1,789
Heat risk 5/10 · Moderate
- Hot days now (above 103°F)
- 7 days/yr
- Hot days in 30 yrs
- 18 days/yr
Wind risk 5/10 · Moderate
- Chance of severe wind over 30 yrs
- 25.0%
Air-quality risk 4/10 · Minor
- Unhealthy air days now
- 4 days/yr
- Unhealthy air days in 30 yrs
- 5 days/yr
Risk factors via First Street. Map © Google.
Why this score? — see what drove the C- grade
The composite is a weighted blend of 9 inputs, each scored 0–100. Each bar is that input's sub-score; the figure is the points it added to the 100-point composite (weight × sub-score).
- Cash flow +15.6/30.0
- ARV discount +15.0/15.0
- DSCR +4.8/10.0
- Schools +3.8/10.0
- Livability +3.5/5.0
- Rent growth +3.4/5.0
- 1% rule +3.1/10.0
- Condition / age +2.5/5.0
- Appreciation +0.0/10.0
$375,000
🖨 Deal sheet (PDF) 📄 Offer letter ✓ Due diligence
Listing remarks MLS
Welcome home to this spacious 4-bedroom, 2.5-bath beauty nestled in the sought-after Huntcrest swim/tennis community! With 2,524 sq ft of well- designed living space, this home offers the perfect blend of comfort and functionality. Entertain with ease in the formal living and dining rooms, then gather in the cozy family room featuring a warm fireplace. The kitchen shines with a center island, ideal for casual meals and conversation. Retreat to the oversized primary suite with a generously sized walk-in closet you have to see to believe. Step outside to your private screened gazebo on an extra-large corner lot - perfect for morning coffee or evening entertaining. Built in 1999 and lovingly maintained, this home is move-in ready and waiting for its next chapter. Perfectly located just minutes from I-285, Smyrna Market Village, Truist Park/The Battery, and the Mable House Barnes Amphitheatre. Outdoor enthusiasts will love easy access to the scenic Silver Comet Trail, while shopping and dining are always within reach. Don't miss this one!
Key facts
- Walk-in closet
- Cozy family room
- Warm fireplace
Tags
Property features AI
Finance
- Other: Located on a private road with asphalt surface; Near schools, shopping and trails/greenway
- HOA & community: Community with clubhouse, pool, playground, tennis courts, sidewalks and street lights; Homeowners association in place with a $150 quarterly fee
Exterior
- Parking: Attached side-facing garage with 2 spaces
- Utilities: Public water; Public sewer; 110V electrical service with 220V in laundry; Cable available; Underground utilities
- Home design: Two-level single-family home; Brick front with cement siding; Shingle roof; Slab foundation
- Construction: Brick front and cement siding construction; Shingle roof; Slab foundation
- Exterior features: Patio; Rain gutters; Gazebo
Interior
- Kitchen: White cabinets with pantry; Eat-in kitchen with island; Solid surface counters; Open view to family room; Electric oven, gas range, microwave; Dishwasher, disposal, refrigerator
- Bedrooms: Four upper-level bedrooms; Oversized master bedroom
- Flooring: Hardwood; Ceramic tile; Carpet; Laminate
- Bathrooms: Two full bathrooms; One half bathroom; Master bath with double vanity, separate tub and shower, and soaking tub
- Heating & cooling: Central heating (natural gas); Central air conditioning; Ceiling fans
- Interior features: Two-story foyer; Built-in bookcases; High 9-ft ceilings on main level; High-speed internet available; Walk-in closets; One gas-log fireplace in the family room; Double-pane windows; No common walls
- Laundry & utility: Upper-level laundry room; Washer and dryer included
Neighborhood map
What this means for you Summary
Snapshot
- This is a 4-bed/2.5-bath single-family listed at $375k.
Deal economics
- At list price, monthly cash flow is $158 ($2k/yr) — positive.
- The deal already cash-flows at list — no discount required.
- To meet the 1% rule (rent ≥ 1% of price), the offer needs to be $306k (18.5% below list).
- Recommended offer: $306k (18.5% below list) — sets the bar for 1% rule.
- Cap rate 6.8% vs local median 4.0% in Mableton — top-decile yield for the area; either an underpriced asset or a hidden risk that comps aren't pricing in. Stress-test before assuming the spread holds.
Location & tenants
- Location reads 70/100 on livability (#94 in GA) — a middle-class / working-renter tenant base. Strengths: housing A+, cost of living A-, crime B+; Watch: amenities F, commute D-.
- Cobb County (suburban): math 39% / reading 45% proficiency, ranked #25 of 174 in GA (top 14%) — families likely to look elsewhere, expect single-tenant / working-renter base with shorter leases.
- Zoned schools: Sanders Elementary School (math 19% / reading 22%, grade F, #860 of 1,228 statewide, top 70%, 620 students, 82% FRL); Garrett Middle School (math 15% / reading 21%, grade F, #375 of 470 statewide, top 80%, 906 students, 85% FRL); South Cobb High School (math 21% / reading 20%, grade F, #231 of 424 statewide, top 54%, 2,127 students, 67% FRL) — zoned schools average 78% FRL vs 39% district-wide (39 pts higher); higher-poverty schools than district average — tighter screening recommended.
- Zoned-school proficiency averages 20% at this address vs 42% district-wide (-22 pts) — the specific schools serving this property underperform the Cobb County average; the district grade overstates school quality for this exact location.
- Market conditions: Rents rising (+3.7%/yr); 405 active listings in the ZIP; 8 comparable units currently listed for rent nearby; rentals at typical pace (median 26d on market — plan ~3-4 weeks tenant-placement turnaround); solid renter incomes; 1,625 units permitted in Cobb County in 2024 (389 in 5+ unit buildings).
- This rent runs 36% of the median local income ($102k/yr) — at the standard rent-burdened threshold; future hikes will face affordability resistance.
Forward outlook
- Local home prices are declining (-3.0%/yr); year-one equity from $3k of loan paydown is wiped out by about $11k of value loss. Plan a longer hold.
- Cobb County population projected at +33% by 2050 — long-run rental-demand tailwind backs the buy-and-hold thesis.
Negotiation context
- Only 10 days on market — expect competitive offers; lowballing is unlikely to land.
- 2 sale attempts with the ask held roughly flat each time — persistent listings suggest the price (not the market) is what's stuck; bring a comps-based counter.
- Current owner paid $235k; list at $375k implies a 60% gain — meaningful room to come down on a strong offer.
Risks & watch-outs
- Climate carrying-cost: moderate wind risk, 25% chance of damaging wind over 30y; extreme-heat days projected 7→18/yr by 2055 (HVAC capex compounding) — expect insurance premiums to compound above CPI over the hold.
Questions for the listing agent
- What does the HOA fee cover, when was the last increase, and are there any pending special assessments or reserve-fund shortfalls?
- Is there a deadline driving the sale (1031 exchange, divorce, estate, relocation)? That informs how much negotiation room exists.
- Schools are F-rated, which usually means shorter tenancies and higher turnover. Who's the typical renter profile here, and what's been the actual vacancy rate?
- What's the average days-on-market for RENTAL listings here right now (not sales)? A rising rental-DOM trend means longer vacancies and softer asking-rent achievability than the comps imply.
- What's the recent tenant-quality profile in this submarket — average credit score on applications, eviction rate, late-payment / NSF rate, and stable-employment percentage? A property-management company in the area should have these aggregated.
- How much new for-sale + rental construction is in the pipeline within 1–3 miles? Heavy new supply typically softens prices + rents 12–24 months out; constrained supply supports both.
Investment metrics
- 1% rule
- 0.81% ✗
- Cap rate
- 6.80%
- Cash-on-cash
- 1.80%
- DSCR
- 1.08
- GRM
- 10.2
CMA / ARV
- ARV (on-the-fly)
- $464,416
- Comps found
- 12
Show comp detail 12 sales within ~0.75 mi
| Address | Dist | Beds/Ba | Sqft | Sold | Price | $/sf | Match |
|---|---|---|---|---|---|---|---|
| 1645 Fulmont Cir | 0.21mi | 4/2.5 | 2,386 (-6%) | 1mo | $525,000 | $220 | 80 |
| 1675 Huntcrest Park SW | 0.03mi | 4/2.5 | 2,257 (-11%) | 6mo | $336,500 | $149 | 76 |
| 1730 Fulmont Cir | 0.23mi | 4/2.5 | 2,362 (-6%) | 8mo | $499,900 | $212 | 72 |
| 1731 Fulmont Cir | 0.25mi | 4/2.5 | 2,362 (-6%) | 8mo | $507,893 | $215 | 71 |
| 5301 Burrus Ln SW | 0.52mi | 4/2.5 | 2,600 (+3%) | 1mo | $450,000 | $173 | 70 |
| 5210 Burrus Ln | 0.68mi | 4/2.5 | 2,600 (+3%) | 0mo | $430,000 | $165 | 63 |
| 1300 Lavista Dr SW | 0.62mi | 3/3.0 (-1) | 2,460 (-2%) | 1mo | $375,000 | $152 | 59 |
| 1715 Fulmont Cir | 0.23mi | 4/3.0 | 2,845 (+13%) | 8mo | $563,183 | $198 | 59 |
| 4882 Golden Dr SW | 0.32mi | 4/3.0 | 2,170 (-14%) | 7mo | $410,000 | $189 | 54 |
| 5267 Bullard Ln | 0.51mi | 4/3.0 | 2,230 (-12%) | 4mo | $410,000 | $184 | 52 |
| 1971 Annette Ln | 0.66mi | 4/3.0 | 2,808 (+11%) | 5mo | $320,000 | $114 | 44 |
| 1360 SW Lamont Dr | 0.74mi | 4/2.5 | 2,884 (+14%) | 3mo | $428,000 | $148 | 39 |
Match score weights: distance 35% · size 25% · config 20% · recency 20%. Top-matched comps best support the ARV.
Projected returns pro-forma
-3.0% appreciation · 3.66% rent growth · sell at horizon
- IRR
- -12.8%
- Equity multiple
- 0.53×
- Total profit
- $-48,838
- Equity at exit
- $55,914
- IRR
- -3.0%
- Equity multiple
- 0.79×
- Total profit
- $-21,747
- Equity at exit
- $32,423
Cash invested: $105,000 (down + closing). Projections, not guarantees.
Landlord ↔ Tenant lean methodology
- Overall (STATE)
- 90 Strongly Landlord-Friendly
- State Georgia
- 90 Strongly Landlord-Friendly · R+3
- County
- — inherits STATE
- City
- — inherits STATE
ZIP-level market 30126
- Rents YoY
- 3.7%
- Active inventory
- 405
- Price-to-rent
- 10.2×
Monthly cashflow live
- Estimated rent
- $3,056 high interval (Pro) →
- Mortgage (P&I)
- −$1,967
- Tax from tax record
- −$84 /mo · $1,002/yr
- Insurance
- −$156
- HOA
- −$50
- Vacancy / Maint / Mgmt
- −$642
- Net cashflow
- $158
Break-even live
Sensitivity live
| Price | -10% $370 | -5% $264 | +0% $158 | +5% $52 | +10% $-55 |
|---|---|---|---|---|---|
| Rent | -10% $-84 | -5% $37 | +0% $158 | +5% $278 | +10% $399 |
| Rate | -1.0pp $347 | -0.5pp $253 | base $158 | +0.5pp $61 | +1.0pp $-38 |
UW: 25.0% down · 7.5% · 30yr · 1.5% tax · 5.0% vac · 8.0% maint · 8.0% mgmt
Financing live
Cash to close
- Down payment
- $93,750
- Closing costs
- $11,250
- Reserves months
- —
- Total cash needed
- —
Loan-product check · same deal, 3 products live
Conventional
25% down · 7.5% · 30yr
- Down + closing
- —
- Monthly P&I
- —
- Monthly cashflow
- —
- DSCR
- —
- Eligible?
- —
Personal DTI + credit; lowest rate.
DSCR
20% down · 8.5% · 30yr
- Down + closing
- —
- Monthly P&I
- —
- Monthly cashflow
- —
- DSCR
- —
- Eligible?
- —
No personal income docs; deal must DSCR.
Hard money
10% down · 12.0% · 12mo
- Down + closing
- —
- Monthly P&I
- —
- Monthly cashflow
- —
- DSCR
- —
- Eligible?
- —
Short-term bridge; refi at stabilization.
Rent comps 8 comps
| Address | Beds | Baths | Sqft | Rent | $/sqft | DOM | Units | Dist |
|---|---|---|---|---|---|---|---|---|
| 5107 Huntcrest Dr SW Mableton, GA | 3.0 | 2.5 | 2388 | $2,400 | $1.01 | 45d | 1 | 0.26mi |
| 4526 Fillmore Trl SW Austell, GA | 3.0 | 2.5 | 1760 | $2,800 | $1.59 | 0d | 1 | 0.86mi |
| 5161 Madison Green Dr SW Mableton, GA | 4.0 | 3.5 | 3054 | $8,450 | $2.77 | 45d | 1 | 1.02mi |
| 1761 Orange Grove Pl Austell, GA | 3.0 | 2.5 | 1843 | $2,400 | $1.30 | 19d | 1 | 1.17mi |
| 4667 Glore Rd SW Mableton, GA | 4.0 | 2.0 | 1857 | $5,800 | $3.12 | 45d | 1 | 1.20mi |
| 1802 Orange Grove Pl Austell, GA | 3.0 | 3.5 | 2578 | $2,995 | $1.16 | 26d | 1 | 1.21mi |
| 5065 Landover Way Austell, GA | 4.0 | 3.0 | 2465 | $2,665 | $1.08 | 22d | 1 | 1.28mi |
| 4897 Conductor Way SW Mableton, GA | 4.0 | 2.5 | 2106 | $2,950 | $1.40 | 0d | 1 | 1.31mi |
HOA detail
- Monthly dues
- $50 · $600/yr
Listing history 8 events
-
2026-06-21days on market $375,000 Active 10 DOM
-
2026-06-18days on market $375,000 Active 7 DOM
-
2026-06-17days on market $375,000 Active 6 DOM
-
2026-06-16days on market $375,000 Active 5 DOM
-
2026-06-15days on market $375,000 Active 4 DOM
-
2026-06-13days on market $375,000 Active 2 DOM
-
2026-06-13remarks 693-char remark
-
2026-06-13$375,000 Active 1 DOM
ⓘ Source: listings_history table (triggers on properties + properties_extension) + one-shot
backfill from property_details.listing_events for pre-trigger history.
Tax reassessment forecast GA · Resets to sale price
- Current annual tax
- $1,002 · $84/mo
- Projected year-2 tax
- $3,450 · $288/mo
- Expected delta
- +$2,448/yr (+$204/mo · 244.3%)
ⓘ Screening estimate from a state-policy table — verify with the county assessor before closing.
Climate risk First Street
- Flood 1/10 Low FEMA zone X (unshaded) · 0% chance over 30 yrs
- Wildfire 3/10 Moderate
- Heat 5/10 Major 7 d/yr ≥103°F today · 18 d/yr by 30 yrs out
- Wind 5/10 Major 25% chance of damaging wind over 30 yrs
- Air quality 4/10 Moderate 4 unhealthy d/yr today · 5 by 30 yrs out
Nearby sold comps map
Loading sold comps map…
Walkable amenities ~0.75 mi
Loading nearby amenities…
Taxation est. · year 1
- Rental income
- $36,669
- − Mortgage interest
- −$21,006
- − Property taxes
- −$1,002
- − Insurance
- −$1,875
- − Repairs & maintenance
- −$2,933
- − Management
- −$2,933
- − HOA
- −$600
- − Depreciation
- −$10,909
- Taxable loss
- −$4,590
- Est. tax savings @ 24.0%
- +$1,102
- After-tax cash flow
- $2,994/yr
For passive investors: Depreciation is non-cash, so a rental often shows a tax loss while cash-flowing — sheltering income. Rental losses are passive: they offset passive income freely, and up to $25,000/yr can offset ordinary (W-2) income if you actively participate and your MAGI is under $100k (phasing out to $0 by $150k); unused losses carry forward. On sale, claimed depreciation is recaptured at up to 25%, and gains may owe capital-gains tax (a 1031 exchange can defer both). Figures are a year-1 estimate at your 24.0% rate — not tax advice; consult a CPA.
Schools (NCES district)
- District
- Cobb County
- NCES district ID
- 1301290
- Math proficiency
- 39% ▼ -15.00%
- Reading proficiency
- 45% ▼ -10.00%
- Median HH income
- $68,845
- Composite
- 37.93/100
- National rank
- #4308
- State rank
- #25 of 174 in GA
Livability — Mableton
- Score
- 70/100
- State rank
- #94
- US rank
- #7534
Category grades
Schools grade is shown separately in the Schools card above.
Census & demographics
- County
- Cobb County · 777,758 people
- City population
- 41,829
- Metro
- Atlanta-Sandy Springs-Alpharetta, GA
- Population (ZIP)
- 41,829
- Household income
- $101,891
- Rent vs Own
- Severe rent burden
- 1046.0
Population outlook (Cobb County) Hauer SSP2
- Today (2025)
- 868,385 people
- By 2030
- 929,614 · +7.1%
- By 2040
- 1,047,533 · +20.6%
- By 2050
- 1,155,537 · +33.1%
- By 2075
- 1,405,030 · +61.8%
- By 2100
- 1,555,058 · +79.1%
Race, ethnicity, and origin ACS 2023
- Neighborhood character
- Diverse neighborhood (Simpson 0.69)
- Race & ethnicity
- Black 42% White 30% Hispanic / Latino 20% Two or more races 8% Asian 4% Native American 1%
- Hispanic origin (detail)
- Mexican 11% Cuban 1%
- Common ancestry
- Slovak 1% Italian 1% Lithuanian 1%
- Foreign-born
- 16% · Canada, China
- Languages at home
- 77% English-only · Spanish 17% Other Indo-European 3% French/Haitian/Cajun 1%
Political lean MEDSL · Cobb
- 2024 margin
- D (+14.9) · D 56.9% · R 42.0% · Other 1.1%
- 2008→2024 swing
- +24.3pp toward D · 2008: -9.4pp · 2024: 14.9pp
- All cycles
- 2024: D+14.9 2020: D+14.3 2016: D+2.1 2012: R+12.6 2008: R+9.4
Not yet ingested
- Civics
- —
Market trends
- HPI YoY
- ▼ -239.35%
- Current HPI
- 230.378
- Rent YoY
- ▲ 3.66%
- Metro
- Atlanta-Sandy Springs-Alpharetta, GA
- State GDP YoY
- ▲ 2.66%
- F500 in state
- 28
Industry mix (Fortune 500 HQ in GA)
| Industry | F500 HQs | Revenue |
|---|---|---|
| Paper / Packaging | 2 | $29B |
|
||
| Retail | 1 | $160B |
|
||
| Transportation / Logistics | 1 | $91B |
|
||
| Airlines | 1 | $62B |
|
||
| Consumer Goods | 1 | $47B |
|
||
| Utilities | 1 | $25B |
|
||
Price history
+106.0% since first listed6 events — show timeline
- 2026-06-11 Listed $375,000 FMLS
- 2026-06-11 Listed $375,000 GAMLS
- 2006-04-25 Sold (Public Records) $235,000 Public Records
- 2006-04-25 Sold (Public Records) $235,000 Public Records
- 2005-04-27 Sold (Public Records) $220,000 Public Records
- 1999-10-15 Sold (Public Records) $182,000 Public Records
Property tax history
-3.2%/yrLatest (2025): $1,002 · -0.3% YoY. Source: county tax records.
Cash-flow waterfall
monthlySold comps — $/sqft
last 12 mo · ≤1 miLoading sold comps…