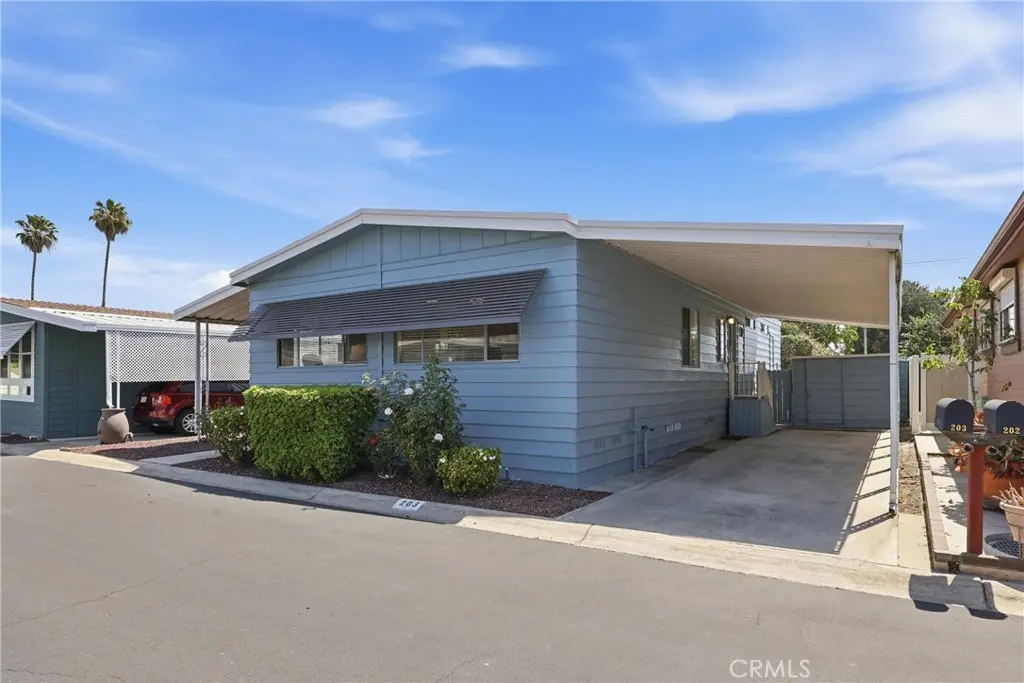
15111 Pipeline Ave #203 · Chino Hills, CA
Flood risk 4/10 · Minor
- FEMA flood zone
- X (unshaded)
- Chance of flooding over 30 yrs
- 0.22%
- Est. flood insurance / yr
- $507 – $1,088
Fire risk 5/10 · Moderate
- Est. fire insurance / yr
- $659 – $1,223
Heat risk 7/10 · Major
- Hot days now (above 100°F)
- 6 days/yr
- Hot days in 30 yrs
- 16 days/yr
Wind risk 1/10 · Minimal
- Chance of severe wind over 30 yrs
- —
Air-quality risk 7/10 · Major
- Unhealthy air days now
- 15 days/yr
- Unhealthy air days in 30 yrs
- 17 days/yr
Risk factors via First Street. Map © Google.
Why this score? — see what drove the B+ grade
The composite is a weighted blend of 9 inputs, each scored 0–100. Each bar is that input's sub-score; the figure is the points it added to the 100-point composite (weight × sub-score).
- Cash flow +30.0/30.0
- ARV discount +15.0/15.0
- 1% rule +10.0/10.0
- DSCR +10.0/10.0
- Schools +5.0/10.0
- Livability +3.4/5.0
- Rent growth +2.6/5.0
- Condition / age +2.5/5.0
- Appreciation +0.0/10.0
$169,999
🖨 Deal sheet 📄 Offer letter ✓ Due diligence
Listing remarks
Welcome to Lake Los Serranos Club, one of Chino Hills' premier 55+ communities! This beautifully refreshed 2-bedroom, 2-bath home offers approximately 1,278 square feet of comfortable living space and is ideally located just a short distance from the lake, clubhouse, pool, and community amenities. Recent improvements include fresh interior and exterior paint, stylish new black hardware throughout, and new luxury vinyl plank flooring that creates a bright, modern feel. The spacious floor plan features a large primary suite with an oversized walk-in closet and private bath, generous living areas, and plenty of natural light. Enjoy outdoor living on the large covered front porch or relax in th
Key facts
- Screened patio
- Lake views
- Updated roof
Tags
Property features AI
Finance
- Other: Private road frontage on a maintained, paved road; Directions: Enter park from Pipeline to the furthest east street in the park
- Financial info: Monthly land lease of $1,500 (park-provided)
- HOA & community: Located in a senior community; Park name: Lake Los Serranos Club; Community amenities include fishing, lake access, park areas, and street lighting; Manager approval required; Pets allowed with breed restrictions
Exterior
- Parking: Concrete driveway; Covered parking; Carport; Parking available
- Security: Guarded community; Resident manager on site
- Utilities: District/public water; Public sewer; Natural gas connected; Electricity connected (standard); Cable connected
- Home design: Mobile home (model: SHERWOOD); Single-story; Faces west; Mobile home remains on site; Turnkey condition with minor cosmetic repairs noted
- Construction: Frame and lap siding construction; Shingle roof; Permanent foundation with pier jacks; One shed
- Exterior features: Covered and enclosed porch areas with screened patio; Front and rear porch; Deck; Awning; Rain gutters; Siding skirt; Fenced, in-ground community pool (gunite); In-ground community gunite spa; One storage shed on the property; Sprinkler drip system; Front yard and yard space
Interior
- Kitchen: Gas cooktop; Dishwasher; Garbage disposal; Refrigerator; Water line to refrigerator; Kitchen island; Formica countertops
- Bedrooms: Primary suite; Walk-in closet
- Flooring: Vinyl flooring; Laminate flooring
- Bathrooms: Two full bathrooms; Shower in tub
- Heating & cooling: Central air conditioning; Natural gas heating; Forced air / central furnace
- Interior features: Built-in shelving/storage; Unfurnished; Living room with attached deck; Storage space; Formica counters; Blinds and window screens; One-level living (single story); Street-level entry
- Laundry & utility: Private laundry room; Washer and dryer included; Washer hookup; Gas and electric dryer hookup
Neighborhood map
What this means for you Summary
Snapshot
- This is a 3-bed/2.0-bath manufactured listed at $170k.
Deal economics
- At list price, monthly cash flow is $2k ($20k/yr) — positive.
- The deal already cash-flows at list — no discount required.
- Meets the 1% rule at list price ($4k rent vs $170k).
- Cap rate 18.0% vs local median 2.1% in Chino Hills — top-decile yield for the area; either an underpriced asset or a hidden risk that comps aren't pricing in. Stress-test before assuming the spread holds.
Location & tenants
- Location reads 68/100 on livability (#299 in CA) — a middle-class / working-renter tenant base. Strengths: employment A+, schools A, crime A; Watch: health & safety D, commute F, cost of living F.
- Chino Valley Unified (suburban): math 46% / reading 58% proficiency, ranked #334 of 1,400 in CA (top 24%) — acceptable for families but not a draw, mixed tenant base, ~2y average lease.
- Market conditions: Rents flat; 187 active listings in the ZIP; 9 comparable units currently listed for rent nearby; rentals at typical pace (median 17d on market — plan ~3-4 weeks tenant-placement turnaround); high-income renter base; 5,458 units permitted in San Bernardino County in 2024 (1,500 in 5+ unit buildings).
- This rent runs 34% of the median local income ($126k/yr) — at the standard rent-burdened threshold; future hikes will face affordability resistance.
Forward outlook
- Local home prices are declining (-3.0%/yr); year-one equity from $1k of loan paydown is wiped out by about $5k of value loss. Plan a longer hold.
- San Bernardino County population projected at +15% by 2050 — modest demand growth; plan on rents tracking national, not racing it.
- At projected returns (-3.0% appreciation + 0.2% rent growth), your $48k cash investment doubles in ~3 years — after that, you're playing with house money.
Negotiation context
- Only 13 days on market — expect competitive offers; lowballing is unlikely to land.
- 3 sale attempts since 21y ago with the ask held roughly flat each time — persistent listings suggest the price (not the market) is what's stuck; bring a comps-based counter.
Risks & watch-outs
- Climate carrying-cost: moderate wildfire risk; extreme-heat days projected 6→16/yr by 2055 (HVAC capex compounding) — expect insurance premiums to compound above CPI over the hold.
Questions for the listing agent
- Built in 1978 — when were the roof, HVAC, electrical panel, plumbing, and water heater last replaced?
- Is there a deadline driving the sale (1031 exchange, divorce, estate, relocation)? That informs how much negotiation room exists.
- Schools are A-rated — typically a magnet for longer-tenancy family renters. What's the average tenant stay here, and is there a school-zone premium baked into asking?
- What's the average days-on-market for RENTAL listings here right now (not sales)? A rising rental-DOM trend means longer vacancies and softer asking-rent achievability than the comps imply.
- What's the recent tenant-quality profile in this submarket — average credit score on applications, eviction rate, late-payment / NSF rate, and stable-employment percentage? A property-management company in the area should have these aggregated.
- How much new for-sale + rental construction is in the pipeline within 1–3 miles? Heavy new supply typically softens prices + rents 12–24 months out; constrained supply supports both.
Investment metrics
- 1% rule
- 2.11% ✓
- Cap rate
- 17.99%
- Cash-on-cash
- 41.77%
- DSCR
- 2.86
- GRM
- 4.0
CMA / ARV
- ARV (on-the-fly)
- $265,824
- Comps found
- 12
Show comp detail 12 sales within ~0.75 mi
| Address | Dist | Beds/Ba | Sqft | Sold | Price | $/sf | Match |
|---|---|---|---|---|---|---|---|
| 15111 Pipeline #64 | 0.00mi | 3/2.0 | 1,245 (-0%) | 3mo | $280,000 | $225 | 97 |
| 15111 Pipeline Ave #274 | 0.00mi | 3/2.0 | 1,336 (+7%) | 3mo | $260,000 | $195 | 86 |
| 15111 Pipeline Ave #158 | 0.00mi | 3/2.0 | 1,344 (+8%) | 4mo | $260,000 | $193 | 84 |
| 15111 Pipeline Ave #115 | 0.00mi | 2/2.0 (-1) | 1,220 (-2%) | 11mo | $260,000 | $213 | 82 |
| 15111 Pipeline Ave #125 | 0.00mi | 2/2.0 (-1) | 1,200 (-4%) | 10mo | $220,000 | $183 | 80 |
| 15111 Pipeline Ave #75 | 0.00mi | 2/2.0 (-1) | 1,283 (+3%) | 15mo | $255,000 | $199 | 78 |
| 15111 PIPELINE Unit SP 281 | 0.00mi | 2/2.0 (-1) | 1,344 (+8%) | 7mo | $119,900 | $89 | 76 |
| 15111 Pipeline Ave #196 | 0.00mi | 3/2.0 | 1,420 (+14%) | 2mo | $285,000 | $201 | 75 |
| 15111 Pipeline Ave #66 | 0.00mi | 3/2.0 | 1,404 (+12%) | 12mo | $319,000 | $227 | 69 |
| 15111 Pipeline Ave #259 | 0.00mi | 3/2.0 | 1,378 (+10%) | 16mo | $295,500 | $214 | 69 |
| 15111 Pipeline Ave #86 | 0.11mi | 2/2.0 (-1) | 1,200 (-4%) | 19mo | $285,000 | $238 | 68 |
| 15111 Pipeline Ave #114 | 0.00mi | 3/2.0 | 1,416 (+14%) | 20mo | $320,000 | $226 | 61 |
Match score weights: distance 35% · size 25% · config 20% · recency 20%. Top-matched comps best support the ARV.
Projected returns pro-forma
-3.0% appreciation · 0.2% rent growth · sell at horizon
- IRR
- 35.2%
- Equity multiple
- 2.43×
- Total profit
- $68,222
- Equity at exit
- $25,347
- IRR
- 40.5%
- Equity multiple
- 4.31×
- Total profit
- $157,407
- Equity at exit
- $14,698
Cash invested: $47,600 (down + closing). Projections, not guarantees.
Landlord ↔ Tenant lean methodology
- Overall (STATE)
- 18 Strongly Tenant-Friendly
- State California
- 18 Strongly Tenant-Friendly · D+13
- County
- — inherits STATE
- City
- — inherits STATE
ZIP-level market 91709
- Home prices YoY
- -28.5%
- Rents YoY
- 0.2%
- Active inventory
- 187
- Price-to-rent
- 4.0×
Monthly cashflow live
- Estimated rent
- $3,585 high interval (Pro) →
- Mortgage (P&I)
- −$891
- Tax est. 1.5%
- −$212 /mo · $2,550/yr
- Insurance
- −$71
- HOA
- −$0
- Vacancy / Maint / Mgmt
- −$753
- Net cashflow
- $1,657
Break-even live
UW: 25.0% down · 7.5% · 30yr · 1.5% tax · 5.0% vac · 8.0% maint · 8.0% mgmt
Financing live
Cash to close
- Down payment
- $42,500
- Closing costs
- $5,100
- Reserves months
- —
- Total cash needed
- —
Loan-product check · same deal, 3 products live
Conventional
25% down · 7.5% · 30yr
- Down + closing
- —
- Monthly P&I
- —
- Monthly cashflow
- —
- DSCR
- —
- Eligible?
- —
Personal DTI + credit; lowest rate.
DSCR
20% down · 8.5% · 30yr
- Down + closing
- —
- Monthly P&I
- —
- Monthly cashflow
- —
- DSCR
- —
- Eligible?
- —
No personal income docs; deal must DSCR.
Hard money
10% down · 12.0% · 12mo
- Down + closing
- —
- Monthly P&I
- —
- Monthly cashflow
- —
- DSCR
- —
- Eligible?
- —
Short-term bridge; refi at stabilization.
Rent comps 9 comps
| Address | Beds | Baths | Sqft | Rent | $/sqft | DOM | Units | Dist |
|---|---|---|---|---|---|---|---|---|
| 4361 Los Serranos Blvd Chino Hills, CA | 3.0 | 2.0 | 1256 | $3,200 | $2.55 | 16d | 1 | 0.42mi |
| 4628 Bird Farm Rd Chino Hills, CA | 3.0 | 2.0 | 1152 | $3,250 | $2.82 | 43d | 1 | 0.57mi |
| 4186 Val Verde Ave Chino Hills, CA | 2.0 | 2.0 | 1000 | $8,000 | $8.00 | 43d | 1 | 0.63mi |
| 3724 Alder Pl Chino Hills, CA | 3.0 | 2.0 | 1240 | $3,600 | $2.90 | 21d | 1 | 0.81mi |
| 15101 Fairfield Ranch Rd Chino Hills, CA | 1.0–3.0 | 1.0–2.0 | 1053 | $3,600 | $3.42 | 1d | 19 | 0.96mi |
| 15447 Pomona Rincon Rd Chino Hills, CA | 3.0 | 2.5 | 1397 | $3,350 | $2.40 | 14d | 2 | 1.01mi |
| 16169 Singing Hills Dr Chino Hills, CA | 3.0 | 2.5 | 1478 | $3,600 | $2.44 | 43d | 1 | 1.26mi |
| 3100 Chino Hills Pkwy Chino Hills, CA | 1.0–3.0 | 1.0–2.0 | 1025 | $4,033 | $3.93 | 1d | 18 | 1.40mi |
| 15773 High Knoll Dr Chino Hills, CA | 1.0–2.0 | 1.0–2.0 | 778 | $2,999 | $3.85 | 1d | 15 | 1.43mi |
Listing history 9 events
-
2026-06-18days on market $169,999 Active 13 DOM
-
2026-06-17days on market $169,999 Active 12 DOM
-
2026-06-16days on market $169,999 Active 11 DOM
-
2026-06-15days on market $169,999 Active 10 DOM
-
2026-06-13days on market $169,999 Active 8 DOM
-
2026-06-09days on market $169,999 Active 4 DOM
-
2026-06-08days on market $169,999 Active 3 DOM
-
2026-06-07remarks 699-char remark
-
2026-06-07$169,999 Active 2 DOM
ⓘ Source: listings_history table (triggers on properties + properties_extension) + one-shot
backfill from property_details.listing_events for pre-trigger history.
Climate risk First Street
- Flood 4/10 Moderate FEMA zone X (unshaded) · 22% chance over 30 yrs
- Wildfire 5/10 Major
- Heat 7/10 Severe 6 d/yr ≥100°F today · 16 d/yr by 30 yrs out
- Wind 1/10 Low
- Air quality 7/10 Severe 15 unhealthy d/yr today · 17 by 30 yrs out
Nearby sold comps map
Loading sold comps map…
Walkable amenities ~0.75 mi
Loading nearby amenities…
Taxation est. · year 1
- Rental income
- $43,016
- − Mortgage interest
- −$9,523
- − Property taxes
- −$2,550
- − Insurance
- −$850
- − Repairs & maintenance
- −$3,441
- − Management
- −$3,441
- − Depreciation
- −$4,945
- Taxable income
- $18,265
- Est. tax owed @ 24.0%
- −$4,384
- After-tax cash flow
- $15,501/yr
For passive investors: Depreciation is non-cash, so a rental often shows a tax loss while cash-flowing — sheltering income. Rental losses are passive: they offset passive income freely, and up to $25,000/yr can offset ordinary (W-2) income if you actively participate and your MAGI is under $100k (phasing out to $0 by $150k); unused losses carry forward. On sale, claimed depreciation is recaptured at up to 25%, and gains may owe capital-gains tax (a 1031 exchange can defer both). Figures are a year-1 estimate at your 24.0% rate — not tax advice; consult a CPA.
Schools (NCES district)
- District
- Chino Valley Unified
- NCES district ID
- 0608460
- Math proficiency
- 46% ▲ 1.00%
- Reading proficiency
- 58% ▲ 1.00%
- Median HH income
- $83,575
- Composite
- 49.56/100
- National rank
- #4275
- State rank
- #334 of 1400 in CA
Livability — Chino Hills
- Score
- 68/100
- State rank
- #299
- US rank
- #9993
Category grades
Schools grade is shown separately in the Schools card above.
Census & demographics
- Census place
- Chino Hills, CA
- County
- San Bernardino County · 2,030,291 people
- City population
- 78,006
- Metro
- Riverside-San Bernardino-Ontario, CA
- Population (ZIP)
- 78,006
- Household income
- $126,350
- Rent vs Own
- Severe rent burden
- 1964.0
Population outlook (San Bernardino County) Hauer SSP2
- Today (2025)
- 2,300,329 people
- By 2030
- 2,378,907 · +3.4%
- By 2040
- 2,523,137 · +9.7%
- By 2050
- 2,642,388 · +14.9%
- By 2075
- 2,880,769 · +25.2%
- By 2100
- 2,909,436 · +26.5%
Race, ethnicity, and origin ACS 2023
- Neighborhood character
- Highly diverse neighborhood (Simpson 0.70)
- Race & ethnicity
- Asian 40% Hispanic / Latino 28% White 24% Two or more races 14% Black 5%
- Hispanic origin (detail)
- Mexican 22%
- Common ancestry
- Italian 2% Lithuanian 1% Romanian 1%
- Foreign-born
- 33% · China, Canada, South Korea
- Languages at home
- 52% English-only · Chinese 18% Spanish 14% Tagalog/Filipino 5%
Political lean MEDSL · San Bernardino
- 2024 margin
- Toss-up / Even · D 47.5% · R 49.7% · Other 2.8%
- 2008→2024 swing
- -8.5pp toward R · 2008: 6.3pp · 2024: -2.1pp
- All cycles
- 2024: R+2.1 2020: D+10.7 2016: D+9.8 2012: D+5.4 2008: D+6.3
Not yet ingested
- Civics
- —
Market trends
- HPI YoY
- ▼ -152.62%
- Current HPI
- 383.5042
- Rent YoY
- ▲ 0.20%
- Metro
- Riverside-San Bernardino-Ontario, CA
- State GDP YoY
- ▲ 3.21%
- F500 in state
- 116
Industry mix (Fortune 500 HQ in CA)
| Industry | F500 HQs | Revenue |
|---|---|---|
| Technology | 27 | $1,492B |
|
||
| Financial Services | 3 | $174B |
|
||
| Retail | 3 | $44B |
|
||
| Insurance | 3 | $26B |
|
||
| Media / Entertainment | 2 | $115B |
|
||
| Pharmaceuticals / Biotech | 2 | $62B |
|
||
Price history
+89.1% since first listed4 events — show timeline
- 2026-06-05 Listed $169,999 CRMLS
- 2005-09-11 Listing Removed — CRMLS
- 2005-05-11 Listed $89,900 CRMLS
- 2005-05-10 Listed $89,900 CRMLS
Property tax history
-5.3%/yrLatest (2025): $55 · +0.7% YoY. Source: county tax records.
Cash-flow waterfall
monthlySold comps — $/sqft
last 12 mo · ≤1 miLoading sold comps…