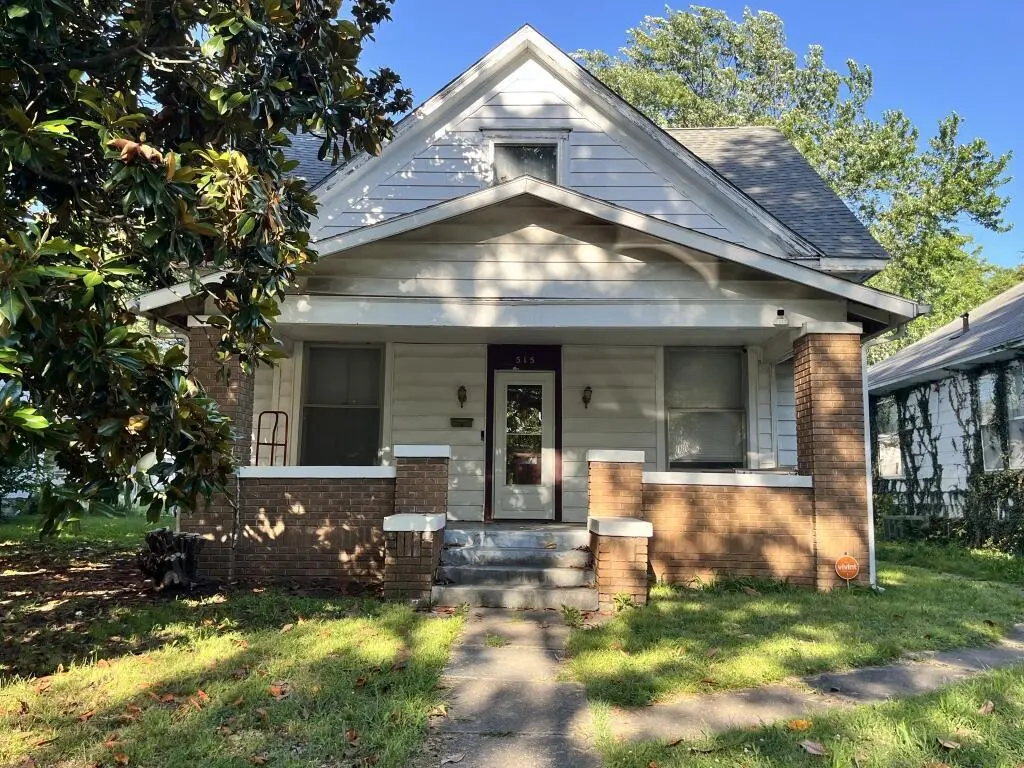
515 Euclid Ave · Monett, MO
Flood risk 1/10 · Minimal
- FEMA flood zone
- X (unshaded)
- Chance of flooding over 30 yrs
- 0.0%
- Est. flood insurance / yr
- $507 – $1,088
Fire risk 4/10 · Minor
- Est. fire insurance / yr
- $1,054 – $1,958
Heat risk 5/10 · Moderate
- Hot days now (above 105°F)
- 7 days/yr
- Hot days in 30 yrs
- 20 days/yr
Wind risk 2/10 · Minimal
- Chance of severe wind over 30 yrs
- 1.0%
Air-quality risk 2/10 · Minimal
- Unhealthy air days now
- 1 days/yr
- Unhealthy air days in 30 yrs
- 1 days/yr
Risk factors via First Street. Map © Google.
Why this score? — see what drove the B grade
The composite is a weighted blend of 9 inputs, each scored 0–100. Each bar is that input's sub-score; the figure is the points it added to the 100-point composite (weight × sub-score).
- Cash flow +30.0/30.0
- ARV discount +15.0/15.0
- DSCR +10.0/10.0
- 1% rule +7.3/10.0
- Schools +3.3/10.0
- Livability +3.3/5.0
- Rent growth +2.5/5.0
- Condition / age +2.5/5.0
- Appreciation +0.0/10.0
$134,999
🖨 Deal sheet 📄 Offer letter ✓ Due diligence
Listing remarks
Great traditional home in quiet neighborhood with good sized yard and detached 2 car garage. Roof is only 5 years old. Features hardwood floors, good sized rooms, and electric and plumbing in great shape. Just needs finish up on bathroom remodel to make it the home of your dreams. Priced for a quick sale. Come see it today!
Key facts
- Bathroom remodel
- Good sized yard
- Quiet neighborhood
Tags
Property features AI
Exterior
- Parking: 2-car garage
- Utilities: Water: Other; Sewer: Other
- Home design: Single-family residential property
- Exterior features: Lot approximately 0.13 acre
Interior
- Kitchen: Electric oven; Free-standing electric oven; Dishwasher
- Bathrooms: 1 full bathroom
- Heating & cooling: Heating present (type listed as Other); No cooling
- Interior features: Electric oven; Free-standing electric oven; Dishwasher; Has heating; No cooling listed
Neighborhood map
What this means for you Summary
Snapshot
- This is a 3-bed/1.0-bath single-family listed at $135k.
Deal economics
- At list price, monthly cash flow is $519 ($6k/yr) — positive.
- The deal already cash-flows at list — no discount required.
- Meets the 1% rule at list price ($2k rent vs $135k).
- Cap rate 10.9% vs local median 4.8% in Monett — top-decile yield for the area; either an underpriced asset or a hidden risk that comps aren't pricing in. Stress-test before assuming the spread holds.
Location & tenants
- Location reads 66/100 on livability (#252 in MO) — a middle-class / working-renter tenant base. Strengths: cost of living A+, crime A-, housing B+; Watch: employment D, amenities F, commute F.
- Monett R-I (town): math 33% / reading 45% proficiency, ranked #168 of 324 in MO (top 52%) — families likely to look elsewhere, expect single-tenant / working-renter base with shorter leases.
- Zoned schools: Monett Elem. (471 students, 68% FRL); Monett Middle (math 35% / reading 46%, grade F, #180 of 391 statewide, top 47%, 504 students, 63% FRL); Monett High (math 37% / reading 55%, grade D-, #170 of 521 statewide, top 33%, 746 students, 51% FRL).
- Market conditions: 118 active listings in the ZIP; 4 comparable units currently listed for rent nearby; rentals leasing fast (median 14d on market — plan ~1-2 weeks tenant-placement turnaround); 57 units permitted in Barry County in 2024 (0 in 5+ unit buildings).
Forward outlook
- Local home prices are declining (-3.0%/yr); year-one equity from $933 of loan paydown is wiped out by about $4k of value loss. Plan a longer hold.
- Barry County population projected at -13% by 2050 — secular population decline; favor cash flow + early exit over multi-decade hold.
- At projected returns (-3.0% appreciation + 3.0% rent growth), your $38k cash investment doubles in ~8 years — after that, you're playing with house money.
Negotiation context
- Only 6 days on market — expect competitive offers; lowballing is unlikely to land.
Risks & watch-outs
- Watch-outs: built in 1940 — expect roof / HVAC / electrical / plumbing capex.
- Climate carrying-cost: extreme-heat days projected 7→20/yr by 2055 (HVAC capex compounding) — expect insurance premiums to compound above CPI over the hold.
Questions for the listing agent
- Built in 1940 — when were the roof, HVAC, electrical panel, plumbing, and water heater last replaced?
- Is there a deadline driving the sale (1031 exchange, divorce, estate, relocation)? That informs how much negotiation room exists.
- Schools are D-rated, which usually means shorter tenancies and higher turnover. Who's the typical renter profile here, and what's been the actual vacancy rate?
- What's the average days-on-market for RENTAL listings here right now (not sales)? A rising rental-DOM trend means longer vacancies and softer asking-rent achievability than the comps imply.
- What's the recent tenant-quality profile in this submarket — average credit score on applications, eviction rate, late-payment / NSF rate, and stable-employment percentage? A property-management company in the area should have these aggregated.
- How much new for-sale + rental construction is in the pipeline within 1–3 miles? Heavy new supply typically softens prices + rents 12–24 months out; constrained supply supports both.
Investment metrics
- 1% rule
- 1.23% ✓
- Cap rate
- 10.91%
- Cash-on-cash
- 16.47%
- DSCR
- 1.73
- GRM
- 6.8
CMA / ARV
- ARV (on-the-fly)
- $202,464
- Comps found
- 12
Show comp detail 12 sales within ~0.75 mi
| Address | Dist | Beds/Ba | Sqft | Sold | Price | $/sf | Match |
|---|---|---|---|---|---|---|---|
| 711 Frisco St | 0.17mi | 4/1.0 (+1) | 1,672 (-6%) | 0mo | $164,900 | $99 | 77 |
| 616 Euclid Ave | 0.10mi | 3/1.0 | 1,575 (-11%) | 3mo | $174,900 | $111 | 74 |
| 467 W County St | 0.35mi | 3/2.0 | 1,806 (+2%) | 4mo | $229,900 | $127 | 74 |
| 407 W Benton St | 0.22mi | 4/2.0 (+1) | 1,654 (-7%) | 4mo | $219,900 | $133 | 66 |
| 542 W Logan St | 0.37mi | 4/2.0 (+1) | 1,835 (+3%) | 15mo | $160,000 | $87 | 56 |
| 712 Frisco St | 0.18mi | 4/3.0 (+1) | 1,927 (+8%) | 13mo | $210,000 | $109 | 54 |
| 718 E Broadway St | 0.60mi | 3/1.5 | 1,596 (-10%) | 0mo | $62,500 | $39 | 53 |
| 1109 4th St | 0.57mi | 3/2.0 | 1,687 (-5%) | 16mo | $164,900 | $98 | 48 |
| 909 N Central Ave | 0.35mi | 3/2.0 | 1,517 (-15%) | 13mo | $197,750 | $130 | 45 |
| 210 W Cleveland Ave | 0.38mi | 4/2.0 (+1) | 1,940 (+9%) | 21mo | $319,000 | $164 | 40 |
| 315 W Nellie Ave | 0.71mi | 4/3.5 (+1) | 1,928 (+9%) | 10mo | $219,900 | $114 | 29 |
| 1016 5th St | 0.58mi | 4/3.0 (+1) | 2,040 (+15%) | 18mo | $235,000 | $115 | 20 |
Match score weights: distance 35% · size 25% · config 20% · recency 20%. Top-matched comps best support the ARV.
Projected returns pro-forma
-3.0% appreciation · 3.0% rent growth · sell at horizon
- IRR
- 7.5%
- Equity multiple
- 1.29×
- Total profit
- $11,116
- Equity at exit
- $20,129
- IRR
- 16.8%
- Equity multiple
- 2.38×
- Total profit
- $51,998
- Equity at exit
- $11,672
Cash invested: $37,800 (down + closing). Projections, not guarantees.
Landlord ↔ Tenant lean methodology
- Overall (STATE)
- 81 Strongly Landlord-Friendly
- State Missouri
- 81 Strongly Landlord-Friendly · R+10
- County
- — inherits STATE
- City
- — inherits STATE
ZIP-level market 65708
- Home prices YoY
- -16.8%
- Active inventory
- 118
- Price-to-rent
- 6.8×
Monthly cashflow live
- Estimated rent
- $1,665 medium interval (Pro) →
- Mortgage (P&I)
- −$708
- Tax from tax record
- −$32 /mo · $387/yr
- Insurance
- −$56
- HOA
- −$0
- Vacancy / Maint / Mgmt
- −$350
- Net cashflow
- $519
Break-even live
UW: 25.0% down · 7.5% · 30yr · 1.5% tax · 5.0% vac · 8.0% maint · 8.0% mgmt
Financing live
Cash to close
- Down payment
- $33,750
- Closing costs
- $4,050
- Reserves months
- —
- Total cash needed
- —
Loan-product check · same deal, 3 products live
Conventional
25% down · 7.5% · 30yr
- Down + closing
- —
- Monthly P&I
- —
- Monthly cashflow
- —
- DSCR
- —
- Eligible?
- —
Personal DTI + credit; lowest rate.
DSCR
20% down · 8.5% · 30yr
- Down + closing
- —
- Monthly P&I
- —
- Monthly cashflow
- —
- DSCR
- —
- Eligible?
- —
No personal income docs; deal must DSCR.
Hard money
10% down · 12.0% · 12mo
- Down + closing
- —
- Monthly P&I
- —
- Monthly cashflow
- —
- DSCR
- —
- Eligible?
- —
Short-term bridge; refi at stabilization.
Rent comps 4 comps
| Address | Beds | Baths | Sqft | Rent | $/sqft | DOM | Units | Dist |
|---|---|---|---|---|---|---|---|---|
| 43 Whitley Ln Monett, MO | 4.0 | 2.0 | 1559 | $1,750 | $1.12 | 13d | 1 | 0.95mi |
| 46 Whitley Ln Monett, MO | 3.0 | 2.0 | 1390 | $1,550 | $1.12 | 13d | 1 | 0.95mi |
| 47 Whitley Ln Monett, MO | 4.0 | 2.0 | 1559 | $1,695 | $1.09 | 13d | 1 | 0.95mi |
| 1105 13th St Monett, MO | 3.0 | 2.0 | 1526 | $1,650 | $1.08 | 13d | 1 | 1.12mi |
Listing history 8 events
-
2026-06-18price $134,999 Active 6 DOM
-
2026-06-18days on market $139,999 Active 6 DOM
-
2026-06-17days on market $139,999 Active 5 DOM
-
2026-06-16days on market $139,999 Active 4 DOM
-
2026-06-16price $139,999 Active 3 DOM
-
2026-06-15days on market $159,999 Active 3 DOM
-
2026-06-12remarks 325-char remark
-
2026-06-12$159,999 Active 1 DOM
ⓘ Source: listings_history table (triggers on properties + properties_extension) + one-shot
backfill from property_details.listing_events for pre-trigger history.
Tax reassessment forecast MO · Resets to sale price
- Current annual tax
- $387 · $32/mo
- Projected year-2 tax
- $1,309 · $109/mo
- Expected delta
- +$923/yr (+$77/mo · 238.6%)
ⓘ Screening estimate from a state-policy table — verify with the county assessor before closing.
Climate risk First Street
- Flood 1/10 Low FEMA zone X (unshaded) · 0% chance over 30 yrs
- Wildfire 4/10 Moderate
- Heat 5/10 Major 7 d/yr ≥105°F today · 20 d/yr by 30 yrs out
- Wind 2/10 Low 100% chance of damaging wind over 30 yrs
- Air quality 2/10 Low 1 unhealthy d/yr today · 1 by 30 yrs out
Nearby sold comps map
Loading sold comps map…
Walkable amenities ~0.75 mi
Loading nearby amenities…
Taxation est. · year 1
- Rental income
- $19,980
- − Mortgage interest
- −$7,562
- − Property taxes
- −$387
- − Insurance
- −$675
- − Repairs & maintenance
- −$1,598
- − Management
- −$1,598
- − Depreciation
- −$3,927
- Taxable income
- $4,232
- Est. tax owed @ 24.0%
- −$1,016
- After-tax cash flow
- $5,211/yr
For passive investors: Depreciation is non-cash, so a rental often shows a tax loss while cash-flowing — sheltering income. Rental losses are passive: they offset passive income freely, and up to $25,000/yr can offset ordinary (W-2) income if you actively participate and your MAGI is under $100k (phasing out to $0 by $150k); unused losses carry forward. On sale, claimed depreciation is recaptured at up to 25%, and gains may owe capital-gains tax (a 1031 exchange can defer both). Figures are a year-1 estimate at your 24.0% rate — not tax advice; consult a CPA.
Schools (NCES district)
- District
- Monett R-I
- NCES district ID
- 2921120
- Math proficiency
- 33% ▲ 2.00%
- Reading proficiency
- 45% ▼ -1.00%
- Median HH income
- $42,139
- Composite
- 32.87/100
- National rank
- #5609
- State rank
- #168 of 324 in MO
Livability — Monett
- Score
- 66/100
- State rank
- #252
- US rank
- #12237
Category grades
Schools grade is shown separately in the Schools card above.
Census & demographics
- Census place
- Monett, MO
- City population
- 12,690
- Population (ZIP)
- 12,690
Population outlook (Barry County) Hauer SSP2
- Today (2025)
- 35,207 people
- By 2030
- 34,460 · -2.1%
- By 2040
- 32,643 · -7.3%
- By 2050
- 30,688 · -12.8%
- By 2075
- 26,898 · -23.6%
- By 2100
- 22,000 · -37.5%
Race, ethnicity, and origin ACS 2023
- Neighborhood character
- Predominantly White (68%)
- Race & ethnicity
- White 68% Hispanic / Latino 25% Two or more races 13% Pacific Islander 2% Native American 2%
- Hispanic origin (detail)
- Mexican 17% Puerto Rican 2%
- Common ancestry
- Slovak 2% Lithuanian 2% Romanian 2%
- Foreign-born
- 10% · Canada
- Languages at home
- 78% English-only · Spanish 20% Other Asian/Pacific 2%
Political lean MEDSL · Barry
- 2024 margin
- Solid R (+63.5) · D 17.8% · R 81.3%
- 2008→2024 swing
- -28.5pp toward R · 2008: -35.0pp · 2024: -63.5pp
- All cycles
- 2024: R+63.5 2020: R+60.8 2016: R+59.7 2012: R+44.7 2008: R+35.0
Not yet ingested
- Civics
- —
Market trends
- HPI YoY
- ▼ -41.13%
- Current HPI
- 204.0484
- Rent YoY
- —
- Metro
- —
- State GDP YoY
- ▲ 1.84%
- F500 in state
- 20
Industry mix (Fortune 500 HQ in MO)
| Industry | F500 HQs | Revenue |
|---|---|---|
| Healthcare | 1 | $163B |
|
||
| Insurance | 1 | $21B |
|
||
| Industrial Technology | 1 | $17B |
|
||
| Retail | 1 | $16B |
|
||
| Industrial Distribution | 1 | $10B |
|
||
| Utilities | 1 | $9B |
|
||
Price history
1 event — show timeline
- 2026-06-12 Listed $159,999 SOMO
Property tax history
+1.3%/yrLatest (2025): $387 · +9.1% YoY. Source: county tax records.
Cash-flow waterfall
monthlySold comps — $/sqft
last 12 mo · ≤1 miLoading sold comps…