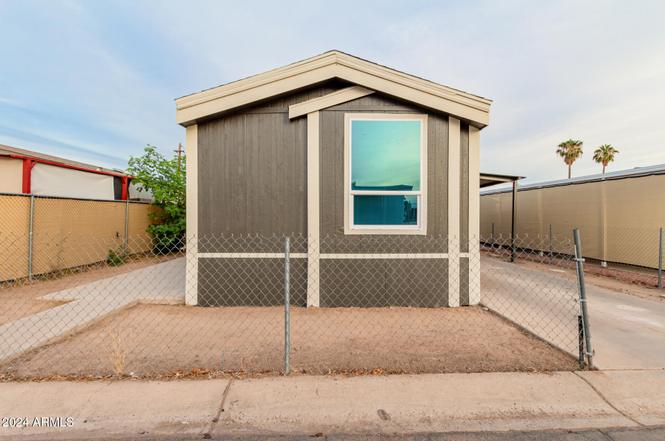
300 W Lower Buckeye Rd #26 · Avondale, AZ
Flood risk No data
- FEMA flood zone
- —
- Chance of flooding over 30 yrs
- —
- Est. flood insurance / yr
- —
Fire risk No data
- Est. fire insurance / yr
- —
Heat risk No data
- Hot days now (above threshold)
- —
- Hot days in 30 yrs
- —
Wind risk No data
- Chance of severe wind over 30 yrs
- —
Air-quality risk No data
- Unhealthy air days now
- —
- Unhealthy air days in 30 yrs
- —
Risk factors via First Street. Map © Google.
Why this score? — see what drove the B+ grade
The composite is a weighted blend of 9 inputs, each scored 0–100. Each bar is that input's sub-score; the figure is the points it added to the 100-point composite (weight × sub-score).
- Cash flow +30.0/30.0
- ARV discount +15.0/15.0
- 1% rule +10.0/10.0
- DSCR +10.0/10.0
- Livability +3.6/5.0
- Schools +2.8/10.0
- Rent growth +2.6/5.0
- Condition / age +2.5/5.0
- Appreciation +0.0/10.0
$75,000
🖨 Deal sheet 📄 Offer letter ✓ Due diligence
Listing remarks
This charming 2-bedroom mobile home is ready to welcome you! It greets you with a 1-car carport. This home also features wood-look flooring, vaulted ceilings, and a spacious great room for comfortable living. The quaint kitchen is equipped with stainless steel appliances, white cabinetry, and ample counter space. The main bedroom offers a private retreat with its own closet and ensuite bathroom. Start your mornings on the cozy patio, perfect for coffee or relaxation. Located in a community with a park, playground, BBQ areas, and a refreshing pool, and just minutes from parks, dining, and more. This gem is the one for you!
Key facts
- Wood-look flooring
- 1-car carport
- Ample counter space
Tags
Neighborhood map
What this means for you Summary
Snapshot
- This is a 2-bed/2.0-bath manufactured listed at $75k.
Deal economics
- At list price, monthly cash flow is $670 ($8k/yr) — positive.
- The deal already cash-flows at list — no discount required.
- Meets the 1% rule at list price ($2k rent vs $75k).
- Recommended offer: $66k (12.0% below list) — sets the bar for market timing.
- Cap rate 17.0% vs local median 3.4% in Avondale — top-decile yield for the area; either an underpriced asset or a hidden risk that comps aren't pricing in. Stress-test before assuming the spread holds.
Location & tenants
- Location reads 72/100 on livability (#29 in AZ) — a middle-class / working-renter tenant base. Strengths: housing A+, commute A; Watch: health & safety C-, crime D+, amenities F.
- Agua Fria Union High School District (4289) (suburban): math 24% / reading 37% proficiency, ranked #99 of 249 in AZ (top 40%) — families likely to look elsewhere, expect single-tenant / working-renter base with shorter leases.
- Zoned schools: Agua Fria High School (math 15% / reading 26%, grade F, #222 of 381 statewide, top 59%, 1,652 students, 62% FRL).
- Market conditions: Rents flat; 305 active listings in the ZIP; 12 comparable units currently listed for rent nearby; rentals leasing fast (median 2d on market — plan ~1-2 weeks tenant-placement turnaround); solid renter incomes; 36,011 units permitted in Maricopa County in 2024 (12,801 in 5+ unit buildings).
Forward outlook
- Local home prices are declining (-3.0%/yr); year-one equity from $519 of loan paydown is wiped out by about $2k of value loss. Plan a longer hold.
- Maricopa County population projected at +38% by 2050 — long-run rental-demand tailwind backs the buy-and-hold thesis.
- At projected returns (-3.0% appreciation + 0.3% rent growth), your $21k cash investment doubles in ~4 years — after that, you're playing with house money.
Negotiation context
- It's been on market 266 days — a 12% lower offer ($66k) is reasonable based on typical stale-listing flexibility.
- 2 sale attempts since 2y ago; this cycle's ask has dropped $10k (12%) from the opening price — seller is motivated, your offer sets the floor, not the list.
Questions for the listing agent
- It's been on market 266 days. Have you received any prior offers? Is the seller open to a 12% concession, seller financing, or rate buy-down credit?
- Why hasn't it sold? Are there any deal-killer items the seller is aware of (foundation, flood, title, zoning, code violations)?
- Is there a deadline driving the sale (1031 exchange, divorce, estate, relocation)? That informs how much negotiation room exists.
- Crime grade is D in this area — have there been break-ins, vandalism, or insurance claims at this property in the last 3 years? What carrier currently insures it and at what premium?
- What's the average days-on-market for RENTAL listings here right now (not sales)? A rising rental-DOM trend means longer vacancies and softer asking-rent achievability than the comps imply.
- What's the recent tenant-quality profile in this submarket — average credit score on applications, eviction rate, late-payment / NSF rate, and stable-employment percentage? A property-management company in the area should have these aggregated.
- How much new for-sale + rental construction is in the pipeline within 1–3 miles? Heavy new supply typically softens prices + rents 12–24 months out; constrained supply supports both.
Investment metrics
- 1% rule
- 2.01% ✓
- Cap rate
- 17.01%
- Cash-on-cash
- 38.28%
- DSCR
- 2.70
- GRM
- 4.2
CMA / ARV
- ARV (on-the-fly)
- $133,120
- Comps found
- 4
Show comp detail 4 sales within ~0.75 mi
| Address | Dist | Beds/Ba | Sqft | Sold | Price | $/sf | Match |
|---|---|---|---|---|---|---|---|
| 300 W Lower Buckeye Rd #26 | 0.00mi | 2/2.0 | 1,024 (0%) | 2mo | $75,000 | $73 | 99 |
| 300 W Lower Buckeye Rd #81 | 0.00mi | 2/2.0 | 896 (-12%) | 19mo | $61,000 | $68 | 63 |
| 1112 S Central Ave | 0.21mi | 3/2.0 (+1) | 1,120 (+9%) | 11mo | $275,000 | $246 | 60 |
| 209 W Del Rio Ln | 0.05mi | 3/2.0 (+1) | 924 (-10%) | 20mo | $120,000 | $130 | 60 |
Match score weights: distance 35% · size 25% · config 20% · recency 20%. Top-matched comps best support the ARV.
Projected returns pro-forma
-3.0% appreciation · 0.34% rent growth · sell at horizon
- IRR
- 31.3%
- Equity multiple
- 2.27×
- Total profit
- $26,615
- Equity at exit
- $11,183
- IRR
- 37.0%
- Equity multiple
- 4.00×
- Total profit
- $62,952
- Equity at exit
- $6,485
Cash invested: $21,000 (down + closing). Projections, not guarantees.
Landlord ↔ Tenant lean methodology
- Overall (STATE)
- 87 Strongly Landlord-Friendly
- State Arizona
- 87 Strongly Landlord-Friendly · R+3
- County
- — inherits STATE
- City
- — inherits STATE
ZIP-level market 85323
- Home prices YoY
- -27.1%
- Rents YoY
- 0.3%
- Active inventory
- 305
- Price-to-rent
- 4.2×
Monthly cashflow live
- Estimated rent
- $1,504 high interval (Pro) →
- Mortgage (P&I)
- −$393
- Tax est. 1.5%
- −$94 /mo · $1,125/yr
- Insurance
- −$31
- HOA
- −$0
- Vacancy / Maint / Mgmt
- −$316
- Net cashflow
- $670
Break-even live
UW: 25.0% down · 7.5% · 30yr · 1.5% tax · 5.0% vac · 8.0% maint · 8.0% mgmt
Financing live
Cash to close
- Down payment
- $18,750
- Closing costs
- $2,250
- Reserves months
- —
- Total cash needed
- —
Loan-product check · same deal, 3 products live
Conventional
25% down · 7.5% · 30yr
- Down + closing
- —
- Monthly P&I
- —
- Monthly cashflow
- —
- DSCR
- —
- Eligible?
- —
Personal DTI + credit; lowest rate.
DSCR
20% down · 8.5% · 30yr
- Down + closing
- —
- Monthly P&I
- —
- Monthly cashflow
- —
- DSCR
- —
- Eligible?
- —
No personal income docs; deal must DSCR.
Hard money
10% down · 12.0% · 12mo
- Down + closing
- —
- Monthly P&I
- —
- Monthly cashflow
- —
- DSCR
- —
- Eligible?
- —
Short-term bridge; refi at stabilization.
Rent comps 12 comps
| Address | Beds | Baths | Sqft | Rent | $/sqft | DOM | Units | Dist |
|---|---|---|---|---|---|---|---|---|
| 812 S Greenleaf Ln Avondale, AZ | 3.0 | 1.0 | 800 | $1,399 | $1.75 | 1d | 1 | 0.29mi |
| 231 S 1st St Unit 1 Avondale, AZ | 2.0 | 1.0 | 1050 | $1,600 | $1.52 | 1d | 1 | 0.78mi |
| 102 S 4th Ave Avondale, AZ | 1.0–3.0 | 1.0–2.0 | 853 | $1,550 | $1.82 | 1d | 26 | 0.80mi |
| 207 S 3rd St Unit 11 Avondale, AZ | 2.0 | 1.0 | 950 | $1,000 | $1.05 | 1d | 1 | 0.88mi |
| 12 E Hill Dr Avondale, AZ | 3.0 | 1.0 | 1319 | $1,600 | $1.21 | 1d | 1 | 1.02mi |
| 312 E Kinderman Dr Unit 1 Avondale, AZ | 2.0 | 1.0 | 717 | $1,375 | $1.92 | 19d | 1 | 1.14mi |
| 12721 W Buckeye Rd Avondale, AZ | 2.0–3.0 | 2.0 | 983 | $1,497 | $1.52 | 1d | 6 | 1.28mi |
| 103 E Brinker Dr Avondale, AZ | 3.0 | 1.0 | 900 | $1,150 | $1.28 | 1d | 3 | 1.29mi |
| 620 N Litchfield Rd Goodyear, AZ | 1.0–3.0 | 1.0–2.0 | 802 | $1,532 | $1.91 | 1d | 14 | 1.33mi |
| 522 N 4th St Unit A Avondale, AZ | 2.0 | 1.0 | 858 | $1,150 | $1.34 | 1d | 1 | 1.34mi |
| 526 N 4th St Unit B Avondale, AZ | 2.0 | 1.0 | 858 | $1,150 | $1.34 | 1d | 1 | 1.36mi |
| 302 E Lawrence Blvd #109 Avondale, AZ | 3.0 | 2.5 | 1340 | $2,100 | $1.57 | 1d | 1 | 1.40mi |
Listing history 2 events
-
2026-06-04remarks 629-char remark
-
2026-06-04$75,000 Pending 266 DOM
ⓘ Source: listings_history table (triggers on properties + properties_extension) + one-shot
backfill from property_details.listing_events for pre-trigger history.
Nearby sold comps map
Loading sold comps map…
Walkable amenities ~0.75 mi
Loading nearby amenities…
Taxation est. · year 1
- Rental income
- $18,049
- − Mortgage interest
- −$4,201
- − Property taxes
- −$1,125
- − Insurance
- −$375
- − Repairs & maintenance
- −$1,444
- − Management
- −$1,444
- − Depreciation
- −$2,182
- Taxable income
- $7,278
- Est. tax owed @ 24.0%
- −$1,747
- After-tax cash flow
- $6,292/yr
For passive investors: Depreciation is non-cash, so a rental often shows a tax loss while cash-flowing — sheltering income. Rental losses are passive: they offset passive income freely, and up to $25,000/yr can offset ordinary (W-2) income if you actively participate and your MAGI is under $100k (phasing out to $0 by $150k); unused losses carry forward. On sale, claimed depreciation is recaptured at up to 25%, and gains may owe capital-gains tax (a 1031 exchange can defer both). Figures are a year-1 estimate at your 24.0% rate — not tax advice; consult a CPA.
Schools (NCES district)
- District
- Agua Fria Union High School District (4289)
- NCES district ID
- 0400450
- Math proficiency
- 24% ▼ -32.00%
- Reading proficiency
- 37% ▼ -12.00%
- Median HH income
- $64,107
- Composite
- 27.92/100
- National rank
- #6865
- State rank
- #99 of 249 in AZ
Livability — Avondale
- Score
- 72/100
- State rank
- #29
- US rank
- #6100
Category grades
Schools grade is shown separately in the Schools card above.
Census & demographics
- Census place
- Avondale, AZ
- County
- Maricopa County · 4,537,380 people
- City population
- 86,122
- Metro
- Phoenix-Mesa-Chandler, AZ
- Population (ZIP)
- 47,043
- Household income
- $83,120
- Rent vs Own
- Severe rent burden
- 1506.0
Population outlook (Maricopa County) Hauer SSP2
- Today (2025)
- 4,979,203 people
- By 2030
- 5,378,229 · +8.0%
- By 2040
- 6,156,598 · +23.6%
- By 2050
- 6,872,376 · +38.0%
- By 2075
- 8,401,270 · +68.7%
- By 2100
- 9,247,439 · +85.7%
Race, ethnicity, and origin ACS 2023
- Neighborhood character
- Diverse neighborhood (Simpson 0.58)
- Race & ethnicity
- Hispanic / Latino 60% Two or more races 26% White 22% Black 13% Asian 2% Native American 2%
- Hispanic origin (detail)
- Mexican 52% Puerto Rican 1%
- Common ancestry
- Italian 2% Portuguese 1% Ukrainian 1%
- Foreign-born
- 19% · Canada, Vietnam
- Languages at home
- 53% English-only · Spanish 42% Arabic 1% Tagalog/Filipino 1%
Political lean MEDSL · Maricopa
- 2024 margin
- Toss-up / Even · D 47.7% · R 51.2% · Other 1.1%
- 2008→2024 swing
- +7.1pp toward D · 2008: -10.6pp · 2024: -3.5pp
- All cycles
- 2024: R+3.5 2020: D+2.2 2016: R+3.5 2012: R+12.0 2008: R+10.6
Not yet ingested
- Civics
- —
Market trends
- HPI YoY
- ▼ -118.44%
- Current HPI
- 319.3653
- Rent YoY
- ▲ 0.34%
- Metro
- Phoenix-Mesa-Chandler, AZ
- State GDP YoY
- ▲ 4.54%
- F500 in state
- 20
Industry mix (Fortune 500 HQ in AZ)
| Industry | F500 HQs | Revenue |
|---|---|---|
| Technology | 2 | $13B |
|
||
| Mining / Metals | 1 | $23B |
|
||
| Environmental Services | 1 | $16B |
|
||
| Metals / Steel | 1 | $14B |
|
||
| Technology Distribution | 1 | $9B |
|
||
| Homebuilding | 1 | $8B |
|
||
Price history
-11.8% since first listed13 events — show timeline
- 2026-06-03 Pending — ARMLS
- 2026-04-30 Sold (MLS) — ARMLS
- 2025-09-06 Pending — ARMLS
- 2025-08-11 Price Changed $75,000 ARMLS
- 2025-08-11 Price Changed $750,000 ARMLS
- 2025-05-15 Relisted — ARMLS
- 2025-05-13 Listing Removed — ARMLS
- 2025-04-12 Price Changed $85,000 ARMLS
- 2025-03-23 Price Changed $80,000 ARMLS
- 2025-03-13 Price Changed $85,000 ARMLS
- 2025-02-17 Price Changed $90,000 ARMLS
- 2024-12-17 Price Changed $95,000 ARMLS
- 2024-12-12 Listed $85,000 ARMLS
Cash-flow waterfall
monthlySold comps — $/sqft
last 12 mo · ≤1 miLoading sold comps…