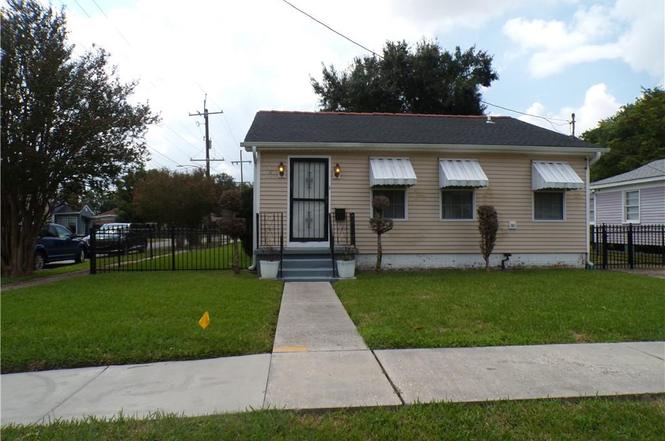
9502 Stroelitz St · New Orleans, LA
Flood risk 8/10 · Major
- FEMA flood zone
- X (shaded)
- Chance of flooding over 30 yrs
- 0.6%
- Est. flood insurance / yr
- $507 – $1,088
Fire risk 1/10 · Minimal
- Est. fire insurance / yr
- $1,269 – $2,357
Heat risk 10/10 · Severe
- Hot days now (above 108°F)
- 7 days/yr
- Hot days in 30 yrs
- 21 days/yr
Wind risk 10/10 · Severe
- Chance of severe wind over 30 yrs
- 99.0%
Air-quality risk 4/10 · Minor
- Unhealthy air days now
- 4 days/yr
- Unhealthy air days in 30 yrs
- 4 days/yr
Risk factors via First Street. Map © Google.
Why this score? — see what drove the C+ grade
The composite is a weighted blend of 9 inputs, each scored 0–100. Each bar is that input's sub-score; the figure is the points it added to the 100-point composite (weight × sub-score).
- Cash flow +23.7/30.0
- ARV discount +15.0/15.0
- DSCR +7.6/10.0
- 1% rule +5.8/10.0
- Livability +4.0/5.0
- Rent growth +2.7/5.0
- Condition / age +2.5/5.0
- Schools +1.6/10.0
- Appreciation +0.0/10.0
$169,500
🖨 Deal sheet 📄 Offer letter ✓ Due diligence
Listing remarks MLS
Corner cottage nestled in a well established Neighborhood. .. a few blocks from Metairie line offering two bedrooms/two baths and a great room for family gatherings. This home was originally two units converted to a single. Porch and storage not included in living area. There is a bonus room which could be an office or another Kitchen This well established neighborhood has ongoing renovations throughout. Public transportation, businesses and schools available. .. .Walking distance to Longue Vue House & Gardens. Hurry and make this well maintained home yours!!!
Key facts
- 5,000 sq ft lot
- Parking
- Built 1955
Neighborhood map
What this means for you Summary
Snapshot
- This is a 2-bed/1.0-bath single-family listed at $170k.
Deal economics
- At list price, monthly cash flow is $255 ($3k/yr) — positive.
- The deal already cash-flows at list — no discount required.
- Meets the 1% rule at list price ($2k rent vs $170k).
- Recommended offer: $167k (1.5% below list) — sets the bar for market timing.
- Cap rate 8.6% vs local median 4.4% in New Orleans — top-decile yield for the area; either an underpriced asset or a hidden risk that comps aren't pricing in. Stress-test before assuming the spread holds.
Location & tenants
- Location reads 81/100 on livability (#3 in LA, #1,383 nationally) — a professional / high-income tenant draw. Strengths: amenities A+, commute A+, health & safety A+; Watch: crime C-, employment D.
- Orleans Parish (urban): math 11% / reading 27% proficiency, ranked #69 of 98 in LA (top 70%) — low school quality limits family demand, transient renter base, plan for 1-2y turnover; 68% free/reduced lunch — lower-income household profile, screen leases tightly.
- Market conditions: Rents flat; 279 active listings in the ZIP; 40 comparable units currently listed for rent nearby; rentals at typical pace (median 22d on market — plan ~3-4 weeks tenant-placement turnaround); 710 units permitted in Orleans Parish in 2024 (244 in 5+ unit buildings).
- This rent runs 34% of the median local income ($64k/yr) — at the standard rent-burdened threshold; future hikes will face affordability resistance.
Forward outlook
- Local home prices are declining (-3.0%/yr); year-one equity from $1k of loan paydown is wiped out by about $5k of value loss. Plan a longer hold.
- Orleans County population projected at +61% by 2050 — long-run rental-demand tailwind backs the buy-and-hold thesis.
Negotiation context
- It's been on market 16 days — a 2% lower offer ($167k) is reasonable based on typical stale-listing flexibility.
- 2 sale attempts since 2y ago with the ask held roughly flat each time — persistent listings suggest the price (not the market) is what's stuck; bring a comps-based counter.
Risks & watch-outs
- Watch-outs: flood insurance adds $66/mo; built in 1955 — expect roof / HVAC / electrical / plumbing capex.
- Climate carrying-cost: severe flood risk; severe wind risk, 99% chance of damaging wind over 30y; extreme-heat days projected 7→21/yr by 2055 (HVAC capex compounding) — expect insurance premiums to compound above CPI over the hold.
Questions for the listing agent
- Built in 1955 — when were the roof, HVAC, electrical panel, plumbing, and water heater last replaced?
- What's the actual annual flood-insurance premium (NFIP or private), and is the property in a SFHA with mandatory coverage?
- Is there a deadline driving the sale (1031 exchange, divorce, estate, relocation)? That informs how much negotiation room exists.
- What's the average days-on-market for RENTAL listings here right now (not sales)? A rising rental-DOM trend means longer vacancies and softer asking-rent achievability than the comps imply.
- What's the recent tenant-quality profile in this submarket — average credit score on applications, eviction rate, late-payment / NSF rate, and stable-employment percentage? A property-management company in the area should have these aggregated.
- How much new for-sale + rental construction is in the pipeline within 1–3 miles? Heavy new supply typically softens prices + rents 12–24 months out; constrained supply supports both.
Investment metrics
- 1% rule
- 1.08% ✓
- Cap rate
- 8.57%
- Cash-on-cash
- 8.12%
- DSCR
- 1.36
- GRM
- 7.7
CMA / ARV
- ARV (on-the-fly)
- $265,740
- Comps found
- 12
Show comp detail 12 sales within ~0.75 mi
| Address | Dist | Beds/Ba | Sqft | Sold | Price | $/sf | Match |
|---|---|---|---|---|---|---|---|
| 3424 Camphor St | 0.13mi | 2/2.5 | 1,491 (-4%) | 8mo | $199,000 | $133 | 75 |
| 3418 Camphor St | 0.15mi | 3/2.0 (+1) | 1,528 (-1%) | 10mo | $189,000 | $124 | 74 |
| 3024 Hollygrove St | 0.53mi | 3/2.0 (+1) | 1,533 (-1%) | 5mo | $299,000 | $195 | 61 |
| 8719 Fig St | 0.67mi | 3/2.0 (+1) | 1,540 (-0%) | 1mo | $70,000 | $45 | 59 |
| 9119 Edinburgh St | 0.27mi | 3/2.0 (+1) | 1,349 (-13%) | 1mo | $125,000 | $93 | 57 |
| 4025 Hamilton St | 0.38mi | 3/2.0 (+1) | 1,470 (-5%) | 18mo | $297,716 | $203 | 50 |
| 2828 Mistletoe St | 0.57mi | 3/2.0 (+1) | 1,670 (+8%) | 2mo | $287,000 | $172 | 49 |
| 8534 Palm St | 0.62mi | 3/2.0 (+1) | 1,600 (+4%) | 9mo | $265,000 | $166 | 48 |
| 8501 Palmetto St | 0.67mi | 3/2.5 (+1) | 1,552 (+0%) | 12mo | $267,500 | $172 | 46 |
| 345 Betz Pl | 0.65mi | 3/2.5 (+1) | 1,643 (+6%) | 6mo | $585,000 | $356 | 43 |
| 8521 Edinburgh St | 0.64mi | 3/2.0 (+1) | 1,358 (-12%) | 10mo | $235,000 | $173 | 32 |
| 8634 Forshey St | 0.61mi | 3/2.0 (+1) | 1,350 (-13%) | 11mo | $131,000 | $97 | 32 |
Match score weights: distance 35% · size 25% · config 20% · recency 20%. Top-matched comps best support the ARV.
Projected returns pro-forma
-3.0% appreciation · 0.97% rent growth · sell at horizon
- IRR
- -8.7%
- Equity multiple
- 0.69×
- Total profit
- $-14,864
- Equity at exit
- $25,273
- IRR
- -2.2%
- Equity multiple
- 0.87×
- Total profit
- $-6,313
- Equity at exit
- $14,655
Cash invested: $47,460 (down + closing). Projections, not guarantees.
Landlord ↔ Tenant lean methodology
- Overall (STATE)
- 90 Strongly Landlord-Friendly
- State Louisiana
- 90 Strongly Landlord-Friendly · R+12
- County
- — inherits STATE
- City
- — inherits STATE
ZIP-level market 70118
- Rents YoY
- 1.0%
- Active inventory
- 279
- Price-to-rent
- 7.7×
Monthly cashflow live
- Estimated rent
- $1,828 high interval (Pro) →
- Mortgage (P&I)
- −$889
- Tax from tax record
- −$163 /mo · $1,961/yr
- Insurance
- −$71
- Flood insurance flood zone
- −$66 /mo · $798/yr
- HOA
- −$0
- Vacancy / Maint / Mgmt
- −$384
- Net cashflow
- $255
Break-even live
UW: 25.0% down · 7.5% · 30yr · 1.5% tax · 5.0% vac · 8.0% maint · 8.0% mgmt
Financing live
Cash to close
- Down payment
- $42,375
- Closing costs
- $5,085
- Reserves months
- —
- Total cash needed
- —
Loan-product check · same deal, 3 products live
Conventional
25% down · 7.5% · 30yr
- Down + closing
- —
- Monthly P&I
- —
- Monthly cashflow
- —
- DSCR
- —
- Eligible?
- —
Personal DTI + credit; lowest rate.
DSCR
20% down · 8.5% · 30yr
- Down + closing
- —
- Monthly P&I
- —
- Monthly cashflow
- —
- DSCR
- —
- Eligible?
- —
No personal income docs; deal must DSCR.
Hard money
10% down · 12.0% · 12mo
- Down + closing
- —
- Monthly P&I
- —
- Monthly cashflow
- —
- DSCR
- —
- Eligible?
- —
Short-term bridge; refi at stabilization.
Rent comps 40 comps
| Address | Beds | Baths | Sqft | Rent | $/sqft | DOM | Units | Dist |
|---|---|---|---|---|---|---|---|---|
| 9528 Stroelitz St New Orleans, LA | 3.0 | 2.0 | 1174 | $2,100 | $1.79 | 12d | 1 | 0.06mi |
| 109 Avenue E Metairie, LA | 3.0 | 3.5 | 2068 | $3,000 | $1.45 | 44d | 1 | 0.31mi |
| 9438 Forshey St New Orleans, LA | 3.0 | 2.0 | 1274 | $2,000 | $1.57 | 24d | 1 | 0.31mi |
| 119 Avenue E Metairie, LA | 2.0 | 1.0 | 1500 | $1,800 | $1.20 | 44d | 1 | 0.32mi |
| 4211 Hamilton St New Orleans, LA | 2.0 | 1.0 | 1400 | $1,100 | $0.79 | 14d | 1 | 0.44mi |
| 4211 Hamilton St Unit NA New Orleans, LA | 2.0 | 1.0 | 1400 | $1,100 | $0.79 | 12d | 1 | 0.44mi |
| 8815 Palm St New Orleans, LA | 3.0 | 2.0 | 1195 | $2,100 | $1.76 | 24d | 1 | 0.48mi |
| 8816 Olive St Unit A-B New Orleans, LA | 3.0 | 2.0 | 1200 | $1,800 | $1.50 | 16d | 1 | 0.51mi |
| 8816 Olive St New Orleans, LA | 3.0 | 2.0 | 1200 | $1,800 | $1.50 | 24d | 1 | 0.51mi |
| 115 Grenadine St Unit 3 Metairie, LA | 1.0 | 1.0 | 1050 | $1,500 | $1.43 | 14d | 1 | 0.54mi |
| 9107 Fig St New Orleans, LA | 3.0 | 3.0 | 1230 | $2,000 | $1.63 | 3d | 1 | 0.54mi |
| 8929 Colapissa St New Orleans, LA | 3.0 | 1.0 | 1300 | $1,400 | $1.08 | 24d | 1 | 0.55mi |
| 9309 Belfast St Rm A New Orleans, LA | 1.0 | 1.0 | 1220 | $1,200 | $0.98 | 24d | 1 | 0.69mi |
| 8502 Edinburgh St New Orleans, LA | 3.0 | 2.0 | 1456 | $1,800 | $1.24 | 3d | 1 | 0.69mi |
| 310 Hector Ave Metairie, LA | 2.0 | 1.0 | 1050 | $1,750 | $1.67 | 44d | 1 | 0.73mi |
| 321 S St Patrick St Unit C New Orleans, LA | 2.0 | 1.0 | 1200 | $1,500 | $1.25 | 11d | 1 | 0.79mi |
| 321 S St Patrick St Unit C New Orleans, LA | 2.0 | 1.0 | 1200 | $1,450 | $1.21 | 24d | 1 | 0.79mi |
| 419 S Murat St New Orleans, LA | 2.0 | 2.0 | 1200 | $1,850 | $1.54 | 21d | 1 | 0.84mi |
| 9129 Nelson St New Orleans, LA | 2.0 | 1.5 | 1434 | $1,900 | $1.32 | 24d | 1 | 0.84mi |
| 4506 Banks St New Orleans, LA | 2.0 | 2.0 | 1350 | $2,000 | $1.48 | 24d | 1 | 0.85mi |
| 9122 Nelson St New Orleans, LA | 2.0 | 2.0 | 1100 | $1,550 | $1.41 | 24d | 1 | 0.87mi |
| 337 S Murat St Unit 4501 New Orleans, LA | 3.0 | 2.0 | 1150 | $2,000 | $1.74 | 24d | 1 | 0.88mi |
| 9215 S Claiborne Ave New Orleans, LA | 2.0 | 2.0 | 1100 | $2,000 | $1.82 | 12d | 1 | 0.89mi |
| 8812 Apple St New Orleans, LA | 3.0 | 2.0 | 1085 | $1,650 | $1.52 | 16d | 1 | 0.90mi |
| 2527 Eagle St New Orleans, LA | 3.0 | 2.0 | 1571 | $2,200 | $1.40 | 24d | 1 | 0.93mi |
| 8329 Pritchard Pl Unit B New Orleans, LA | 1.0 | 1.5 | 1500 | $1,600 | $1.07 | 12d | 1 | 0.94mi |
| 8405 Apricot St New Orleans, LA | 3.0 | 2.0 | 1058 | $1,795 | $1.70 | 3d | 1 | 0.95mi |
| 8405 Apricot St New Orleans, LA | 3.0 | 2.0 | 1058 | $1,795 | $1.70 | 3d | 1 | 0.95mi |
| 2 Azalea Ct Metairie, LA | 2.0 | 1.0 | 1100 | $1,650 | $1.50 | 44d | 1 | 0.97mi |
| 335 Virginia St New Orleans, LA | 2.0 | 1.0 | 1200 | $1,650 | $1.38 | 14d | 1 | 1.00mi |
| 2616 Cambronne St Unit 2618 New Orleans, LA | 3.0 | 1.0 | 1200 | $1,475 | $1.23 | 24d | 1 | 1.03mi |
| 216 Nursery Ave Metairie, LA | 2.0 | 1.5 | 1100 | $1,800 | $1.64 | 3d | 1 | 1.04mi |
| 216 Nursery Ave Metairie, LA | 2.0 | 1.5 | 1100 | $1,800 | $1.64 | 3d | 1 | 1.04mi |
| 619 Pink St Metairie, LA | 2.0 | 1.0 | 1075 | $2,000 | $1.86 | 44d | 1 | 1.05mi |
| 8537 S Claiborne Ave New Orleans, LA | 2.0 | 1.0 | 1450 | $1,400 | $0.97 | 3d | 1 | 1.08mi |
| 4624 Conti St New Orleans, LA | 2.0 | 1.0 | 1200 | $1,300 | $1.08 | 24d | 1 | 1.14mi |
| 647 S Pierce St New Orleans, LA | 3.0 | 2.0 | 1550 | $3,175 | $2.05 | 14d | 1 | 1.15mi |
| 613 S Pierce St New Orleans, LA | 3.0 | 1.0 | 1200 | $1,500 | $1.25 | 17d | 1 | 1.16mi |
| 615 S Pierce St New Orleans, LA | 3.0 | 1.0 | 1200 | $1,500 | $1.25 | 17d | 1 | 1.17mi |
| 912 Monticello Ave New Orleans, LA | 3.0 | 2.0 | 1750 | $2,500 | $1.43 | 44d | 1 | 1.17mi |
Listing history 2 events
-
2026-06-17remarks 568-char remark
-
2026-06-17$169,500 Pending 16 DOM
ⓘ Source: listings_history table (triggers on properties + properties_extension) + one-shot
backfill from property_details.listing_events for pre-trigger history.
Tax reassessment forecast LA · Resets to sale price
- Current annual tax
- $1,961 · $163/mo
- Projected year-2 tax
- $1,961 · $163/mo
- Expected delta
- $0/yr ($0/mo · 0.0%)
ⓘ Screening estimate from a state-policy table — verify with the county assessor before closing.
Climate risk First Street
- Flood 8/10 Severe FEMA zone X (shaded) · 60% chance over 30 yrs
- Wildfire 1/10 Low
- Heat 10/10 Extreme 7 d/yr ≥108°F today · 21 d/yr by 30 yrs out
- Wind 10/10 Extreme 99% chance of damaging wind over 30 yrs
- Air quality 4/10 Moderate 4 unhealthy d/yr today · 4 by 30 yrs out
Nearby sold comps map
Loading sold comps map…
Walkable amenities ~0.75 mi
Loading nearby amenities…
Taxation est. · year 1
- Rental income
- $21,936
- − Mortgage interest
- −$9,495
- − Property taxes
- −$1,961
- − Insurance
- −$1,645
- − Repairs & maintenance
- −$1,755
- − Management
- −$1,755
- − Depreciation
- −$4,931
- Taxable income
- $394
- Est. tax owed @ 24.0%
- −$95
- After-tax cash flow
- $2,962/yr
For passive investors: Depreciation is non-cash, so a rental often shows a tax loss while cash-flowing — sheltering income. Rental losses are passive: they offset passive income freely, and up to $25,000/yr can offset ordinary (W-2) income if you actively participate and your MAGI is under $100k (phasing out to $0 by $150k); unused losses carry forward. On sale, claimed depreciation is recaptured at up to 25%, and gains may owe capital-gains tax (a 1031 exchange can defer both). Figures are a year-1 estimate at your 24.0% rate — not tax advice; consult a CPA.
Schools (NCES district)
- District
- Orleans Parish
- NCES district ID
- 2201170
- Math proficiency
- 11% ▼ -52.00%
- Reading proficiency
- 27% ▼ -46.00%
- Median HH income
- $37,011
- Composite
- 15.78/100
- National rank
- #9271
- State rank
- #69 of 98 in LA
Livability — New Orleans
- Score
- 81/100
- State rank
- #3
- US rank
- #1383
Category grades
Schools grade is shown separately in the Schools card above.
Census & demographics
- Census place
- New Orleans, LA
- County
- Orleans Parish · 338,817 people
- City population
- 338,817
- Metro
- New Orleans-Metairie, LA
- Population (ZIP)
- 36,072
- Household income
- $63,750
- Rent vs Own
- Severe rent burden
- 2237.0
Population outlook (Orleans County) Hauer SSP2
- Today (2025)
- 513,025 people
- By 2030
- 575,781 · +12.2%
- By 2040
- 700,174 · +36.5%
- By 2050
- 826,541 · +61.1%
- By 2075
- 1,123,374 · +119.0%
- By 2100
- 1,355,609 · +164.2%
Race, ethnicity, and origin ACS 2023
- Neighborhood character
- Diverse neighborhood (Simpson 0.65)
- Race & ethnicity
- White 47% Black 34% Hispanic / Latino 11% Two or more races 11% Asian 4%
- Hispanic origin (detail)
- Mexican 2%
- Common ancestry
- Lithuanian 8% Italian 2% Romanian 2%
- Foreign-born
- 9% · Canada, China
- Languages at home
- 86% English-only · Spanish 7% French/Haitian/Cajun 2% Other Indo-European 2%
Political lean MEDSL · Orleans
- 2024 margin
- Solid D (+67.0) · D 82.2% · R 15.2% · Other 2.7%
- 2008→2024 swing
- +6.7pp toward D · 2008: 60.3pp · 2024: 67.0pp
- All cycles
- 2024: D+67.0 2020: D+68.2 2016: D+66.2 2012: D+62.5 2008: D+60.3
Not yet ingested
- Civics
- —
Market trends
- HPI YoY
- ▼ -210.46%
- Current HPI
- 282.9629
- Rent YoY
- ▲ 0.97%
- Metro
- New Orleans-Metairie, LA
- State GDP YoY
- ▲ 3.29%
- F500 in state
- 10
Industry mix (Fortune 500 HQ in LA)
| Industry | F500 HQs | Revenue |
|---|---|---|
| Telecommunications | 2 | $23B |
|
||
| Utilities | 1 | $12B |
|
||
| Wholesale / Distribution | 1 | $5B |
|
||
| Advertising | 1 | $2B |
|
||
Price history
-2.7% since first listed5 events — show timeline
- 2024-12-05 Sold (Public Records) $165,000 Public Records
- 2024-12-04 Sold (MLS) $165,000 GSREIN
- 2024-11-01 Pending — GSREIN
- 2024-09-23 Listed $169,500 AcadianaMLS
- 2024-09-23 Listed $169,500 GSREIN
Property tax history
+30.8%/yrLatest (2026): $1,961 · +1.1% YoY. Source: county tax records.
Cash-flow waterfall
monthlySold comps — $/sqft
last 12 mo · ≤1 miLoading sold comps…