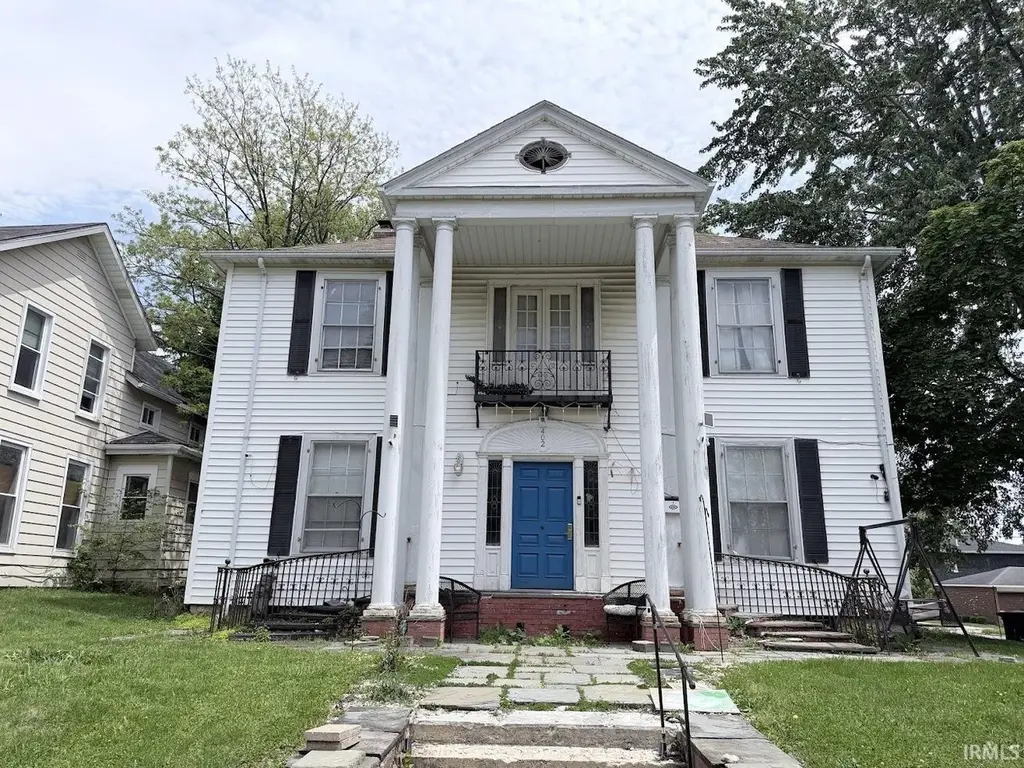
402 N High St · Hartford City, IN
Flood risk 1/10 · Minimal
- FEMA flood zone
- X (unshaded)
- Chance of flooding over 30 yrs
- 0.0%
- Est. flood insurance / yr
- $473 – $860
Fire risk 1/10 · Minimal
- Est. fire insurance / yr
- $717 – $1,331
Heat risk 3/10 · Minor
- Hot days now (above 99°F)
- 7 days/yr
- Hot days in 30 yrs
- 18 days/yr
Wind risk 2/10 · Minimal
- Chance of severe wind over 30 yrs
- 0.0%
Air-quality risk 3/10 · Minor
- Unhealthy air days now
- 2 days/yr
- Unhealthy air days in 30 yrs
- 4 days/yr
Risk factors via First Street. Map © Google.
Why this score? — see what drove the B grade
The composite is a weighted blend of 9 inputs, each scored 0–100. Each bar is that input's sub-score; the figure is the points it added to the 100-point composite (weight × sub-score).
- Cash flow +28.7/30.0
- ARV discount +15.0/15.0
- DSCR +10.0/10.0
- 1% rule +8.0/10.0
- Schools +3.3/10.0
- Livability +3.3/5.0
- Rent growth +2.5/5.0
- Condition / age +2.5/5.0
- Appreciation +0.0/10.0
$105,900
🖨 Deal sheet 📄 Offer letter ✓ Due diligence
Listing remarks MLS
Now is your chance to own a unique home with a historic feel! As you enter, you're greeted with a beautiful entry foyer with hardwood floors. The home has beautiful woodwork throughout. Spacious living room/dining room has beautiful hardwood floors, crown molding, and window seat. Galley kitchen opens to den/breakfast room. New flooring in kitchen, laundry room, & downstairs bathroom. Lots of fresh paint! 4 spacious BR's & full bath upstairs. Fenced backyard w/storage shed.
Key facts
- Galley kitchen
- Detailed woodwork
- Storage shed
Tags
Property features AI
Exterior
- Parking: Off-street parking
- Utilities: Public water; Public sewer
- Home design: Single-family residence (site-built); 2 stories
- Construction: Vinyl siding; Brick/mortar foundation; Asphalt roof; Built as a site-built home
- Exterior features: Privacy fence; Shed on the property; Corner, level lot (60 x 120)
Interior
- Bedrooms: Total of 10 rooms (bedroom count not specified)
- Flooring: Hardwood
- Bathrooms: 2 full bathrooms; 1 bathroom on the main level
- Heating & cooling: Forced air heating; Window cooling units
- Interior features: Hardwood flooring; Two fireplaces (living room); Unfinished basement
- Laundry & utility: Laundry on the main level
Neighborhood map
What this means for you Summary
Snapshot
- This is a 4-bed/2.0-bath single-family listed at $106k.
Deal economics
- At list price, monthly cash flow is $352 ($4k/yr) — positive.
- The deal already cash-flows at list — no discount required.
- Meets the 1% rule at list price ($1k rent vs $106k).
- Recommended offer: $103k (3.0% below list) — sets the bar for market timing.
- Cap rate 10.3% vs local median 5.1% in Hartford City — top-decile yield for the area; either an underpriced asset or a hidden risk that comps aren't pricing in. Stress-test before assuming the spread holds.
Location & tenants
- Location reads 66/100 on livability (#303 in IN) — a middle-class / working-renter tenant base. Strengths: cost of living A+, housing A+; Watch: health & safety D, amenities F, commute F.
- Blackford County Schools (town): math 37% / reading 41% proficiency, ranked #164 of 301 in IN (top 54%) — families likely to look elsewhere, expect single-tenant / working-renter base with shorter leases.
- Zoned schools: Blackford Primary School (352 students, 65% FRL); Blackford Jr-Sr High School (math 25% / reading 43%, grade F, #285 of 369 statewide, top 78%, 717 students, 50% FRL).
- Market conditions: 55 active listings in the ZIP; 9 units permitted in Blackford County in 2024 (0 in 5+ unit buildings).
Forward outlook
- Local home prices are declining (-3.0%/yr); year-one equity from $732 of loan paydown is wiped out by about $3k of value loss. Plan a longer hold.
- Blackford County population projected at -27% by 2050 — secular population decline; favor cash flow + early exit over multi-decade hold.
- At projected returns (-3.0% appreciation + 3.0% rent growth), your $30k cash investment doubles in ~9 years — after that, you're playing with house money.
Negotiation context
- It's been on market 32 days — a 3% lower offer ($103k) is reasonable based on typical stale-listing flexibility.
- 5 sale attempts since 11y ago; this cycle's ask has dropped $9k (8%) from the opening price — seller is motivated, your offer sets the floor, not the list.
- Current owner paid $81k; 31% above their basis — modest negotiation headroom, anchor on the comps not their cost.
Questions for the listing agent
- It's been on market 32 days. Have you received any prior offers? Is the seller open to a 3% concession, seller financing, or rate buy-down credit?
- Built in 1960 — when were the roof, HVAC, electrical panel, plumbing, and water heater last replaced?
- Is there a deadline driving the sale (1031 exchange, divorce, estate, relocation)? That informs how much negotiation room exists.
- Schools are D-rated, which usually means shorter tenancies and higher turnover. Who's the typical renter profile here, and what's been the actual vacancy rate?
- What's the average days-on-market for RENTAL listings here right now (not sales)? A rising rental-DOM trend means longer vacancies and softer asking-rent achievability than the comps imply.
- What's the recent tenant-quality profile in this submarket — average credit score on applications, eviction rate, late-payment / NSF rate, and stable-employment percentage? A property-management company in the area should have these aggregated.
- How much new for-sale + rental construction is in the pipeline within 1–3 miles? Heavy new supply typically softens prices + rents 12–24 months out; constrained supply supports both.
Investment metrics
- 1% rule
- 1.30% ✓
- Cap rate
- 10.28%
- Cash-on-cash
- 14.23%
- DSCR
- 1.63
- GRM
- 6.4
CMA / ARV
- ARV (on-the-fly)
- $130,425
- Comps found
- 6
Show comp detail 6 sales within ~0.75 mi
| Address | Dist | Beds/Ba | Sqft | Sold | Price | $/sf | Match |
|---|---|---|---|---|---|---|---|
| 215 S High St | 0.29mi | 3/1.5 (-1) | 2,667 (-4%) | 5mo | $35,000 | $13 | 69 |
| 302 S Walnut St | 0.34mi | 3/2.0 (-1) | 2,976 (+7%) | 3mo | $100,000 | $34 | 65 |
| 511/513 N Cherry St | 0.18mi | 3/2.0 (-1) | 2,472 (-11%) | 10mo | $115,000 | $47 | 60 |
| 218 W North St | 0.24mi | 4/2.5 | 2,364 (-15%) | 5mo | $225,000 | $95 | 58 |
| 409 E Washington St | 0.29mi | 3/1.0 (-1) | 2,472 (-11%) | 13mo | $126,000 | $51 | 48 |
| 217 W Sherman St | 0.67mi | 3/2.0 (-1) | 2,376 (-14%) | 4mo | $60,000 | $25 | 36 |
Match score weights: distance 35% · size 25% · config 20% · recency 20%. Top-matched comps best support the ARV.
Projected returns pro-forma
-3.0% appreciation · 3.0% rent growth · sell at horizon
- IRR
- 4.6%
- Equity multiple
- 1.18×
- Total profit
- $5,263
- Equity at exit
- $15,790
- IRR
- 14.1%
- Equity multiple
- 2.13×
- Total profit
- $33,513
- Equity at exit
- $9,156
Cash invested: $29,652 (down + closing). Projections, not guarantees.
Landlord ↔ Tenant lean methodology
- Overall (STATE)
- 90 Strongly Landlord-Friendly
- State Indiana
- 90 Strongly Landlord-Friendly · R+11
- County
- — inherits STATE
- City
- — inherits STATE
ZIP-level market 47348
- Home prices YoY
- -17.5%
- Active inventory
- 55
- Price-to-rent
- 6.4×
Monthly cashflow live
- Estimated rent
- $1,372 medium interval (Pro) →
- Mortgage (P&I)
- −$555
- Tax est. 1.5%
- −$132 /mo · $1,588/yr
- Insurance
- −$44
- HOA
- −$0
- Vacancy / Maint / Mgmt
- −$288
- Net cashflow
- $352
Break-even live
UW: 25.0% down · 7.5% · 30yr · 1.5% tax · 5.0% vac · 8.0% maint · 8.0% mgmt
Financing live
Cash to close
- Down payment
- $26,475
- Closing costs
- $3,177
- Reserves months
- —
- Total cash needed
- —
Loan-product check · same deal, 3 products live
Conventional
25% down · 7.5% · 30yr
- Down + closing
- —
- Monthly P&I
- —
- Monthly cashflow
- —
- DSCR
- —
- Eligible?
- —
Personal DTI + credit; lowest rate.
DSCR
20% down · 8.5% · 30yr
- Down + closing
- —
- Monthly P&I
- —
- Monthly cashflow
- —
- DSCR
- —
- Eligible?
- —
No personal income docs; deal must DSCR.
Hard money
10% down · 12.0% · 12mo
- Down + closing
- —
- Monthly P&I
- —
- Monthly cashflow
- —
- DSCR
- —
- Eligible?
- —
Short-term bridge; refi at stabilization.
Listing history 26 events
-
2026-06-19days on market $105,900 Active 32 DOM
-
2026-06-18days on market $105,900 Active 31 DOM
-
2026-06-17days on market $105,900 Active 30 DOM
-
2026-06-17price $105,900 Active 29 DOM
-
2026-06-16days on market $110,900 Active 29 DOM
-
2026-06-15days on market $110,900 Active 28 DOM
-
2026-06-14days on market $110,900 Active 26 DOM
-
2026-06-12days on market $110,900 Active 25 DOM
-
2026-06-09days on market $110,900 Active 22 DOM
-
2026-06-09price $110,900 Active 21 DOM
-
2026-06-08days on market $114,900 Active 21 DOM
-
2026-06-07days on market $114,900 Active 20 DOM
-
2026-06-05days on market $114,900 Active 17 DOM
-
2026-06-03days on market $114,900 Active 16 DOM
-
2026-06-02days on market $114,900 Active 15 DOM
-
2026-06-01days on market $114,900 Active 14 DOM
-
2026-05-31days on market $114,900 Active 13 DOM
-
2026-05-30days on market $114,900 Active 12 DOM
-
2026-05-15$114,900 Active
-
2017-06-01soldstatus $81,000 486-char remark
Show marketing remark (486 chars)
Now is your chance to own a unique home with a historic feel! As you enter, you're greeted with a beautiful entry foyer with hardwood floors. The home has beautiful woodwork throughout. Spacious living room/dining room has beautiful hardwood floors, crown molding, and window seat. Galley kitchen opens to den/breakfast room. New flooring in kitchen, laundry room, & downstairs bathroom. Lots of fresh paint! 4 spacious BR's & full bath upstairs. Fenced backyard w/storage shed.
-
2017-06-01soldstatus $81,000
Show marketing remark (486 chars)
Now is your chance to own a unique home with a historic feel! As you enter, you're greeted with a beautiful entry foyer with hardwood floors. The home has beautiful woodwork throughout. Spacious living room/dining room has beautiful hardwood floors, crown molding, and window seat. Galley kitchen opens to den/breakfast room. New flooring in kitchen, laundry room, & downstairs bathroom. Lots of fresh paint! 4 spacious BR's & full bath upstairs. Fenced backyard w/storage shed.
-
2017-03-31$76,900 486-char remark
Show marketing remark (486 chars)
Now is your chance to own a unique home with a historic feel! As you enter, you're greeted with a beautiful entry foyer with hardwood floors. The home has beautiful woodwork throughout. Spacious living room/dining room has beautiful hardwood floors, crown molding, and window seat. Galley kitchen opens to den/breakfast room. New flooring in kitchen, laundry room, & downstairs bathroom. Lots of fresh paint! 4 spacious BR's & full bath upstairs. Fenced backyard w/storage shed.
-
2017-03-28$76,900
-
2017-01-01historical
-
2015-09-25$74,000
-
2015-09-25$74,000
ⓘ Source: listings_history table (triggers on properties + properties_extension) + one-shot
backfill from property_details.listing_events for pre-trigger history.
Climate risk First Street
- Flood 1/10 Low FEMA zone X (unshaded) · 0% chance over 30 yrs
- Wildfire 1/10 Low
- Heat 3/10 Moderate 7 d/yr ≥99°F today · 18 d/yr by 30 yrs out
- Wind 2/10 Low 0% chance of damaging wind over 30 yrs
- Air quality 3/10 Moderate 2 unhealthy d/yr today · 4 by 30 yrs out
Nearby sold comps map
Loading sold comps map…
Walkable amenities ~0.75 mi
Loading nearby amenities…
Taxation est. · year 1
- Rental income
- $16,460
- − Mortgage interest
- −$5,932
- − Property taxes
- −$1,588
- − Insurance
- −$530
- − Repairs & maintenance
- −$1,317
- − Management
- −$1,317
- − Depreciation
- −$3,081
- Taxable income
- $2,695
- Est. tax owed @ 24.0%
- −$647
- After-tax cash flow
- $3,574/yr
For passive investors: Depreciation is non-cash, so a rental often shows a tax loss while cash-flowing — sheltering income. Rental losses are passive: they offset passive income freely, and up to $25,000/yr can offset ordinary (W-2) income if you actively participate and your MAGI is under $100k (phasing out to $0 by $150k); unused losses carry forward. On sale, claimed depreciation is recaptured at up to 25%, and gains may owe capital-gains tax (a 1031 exchange can defer both). Figures are a year-1 estimate at your 24.0% rate — not tax advice; consult a CPA.
Schools (NCES district)
- District
- Blackford County Schools
- NCES district ID
- 1800570
- Math proficiency
- 37% ▼ -12.00%
- Reading proficiency
- 41% ▼ -5.00%
- Median HH income
- $39,653
- Composite
- 32.67/100
- National rank
- #5656
- State rank
- #164 of 301 in IN
Livability — Hartford City
- Score
- 66/100
- State rank
- #303
- US rank
- #12079
Category grades
Schools grade is shown separately in the Schools card above.
Census & demographics
- Census place
- Hartford City, IN
- Population (ZIP)
- 8,986
Population outlook (Blackford County) Hauer SSP2
- Today (2025)
- 11,183 people
- By 2030
- 10,542 · -5.7%
- By 2040
- 9,292 · -16.9%
- By 2050
- 8,176 · -26.9%
- By 2075
- 6,549 · -41.4%
- By 2100
- 5,636 · -49.6%
Race, ethnicity, and origin ACS 2023
- Neighborhood character
- Predominantly White (96%)
- Race & ethnicity
- White 96% Two or more races 3% Hispanic / Latino 2%
- Common ancestry
- Slovak 3% Lithuanian 3% Scotch-Irish 1%
- Foreign-born
- 1% · Canada
- Languages at home
- 98% English-only · Spanish 1%
Political lean MEDSL · Blackford
- 2024 margin
- Solid R (+50.3) · D 23.9% · R 74.2% · Other 1.9%
- 2008→2024 swing
- -50.1pp toward R · 2008: -0.2pp · 2024: -50.3pp
- All cycles
- 2024: R+50.3 2020: R+46.1 2016: R+43.7 2012: R+16.5 2008: R+0.2
Not yet ingested
- Civics
- —
Market trends
- HPI YoY
- ▼ -47.19%
- Current HPI
- 223.0485
- Rent YoY
- —
- Metro
- —
- State GDP YoY
- ▲ 2.90%
- F500 in state
- 18
Industry mix (Fortune 500 HQ in IN)
| Industry | F500 HQs | Revenue |
|---|---|---|
| Industrial Machinery | 2 | $37B |
|
||
| Healthcare | 1 | $177B |
|
||
| Pharmaceuticals | 1 | $45B |
|
||
| Metals / Steel | 1 | $18B |
|
||
| Agriculture | 1 | $17B |
|
||
| Packaging | 1 | $12B |
|
||
Price history
+55.3% since first listed8 events — show timeline
- 2026-05-15 Listed $114,900 IRMLS
- 2017-06-01 Sold (MLS) $81,000 IRMLS
- 2017-06-01 Sold (MLS) $81,000 MIBOR as Distributed by MLS Grid
- 2017-03-31 Listed $76,900 MIBOR as Distributed by MLS Grid
- 2017-03-28 Listed $76,900 IRMLS
- 2017-01-01 Listing Removed — MIBOR as Distributed by MLS Grid
- 2015-09-25 Listed $74,000 MIBOR as Distributed by MLS Grid
- 2015-09-25 Listed $74,000 IRMLS
Property tax history
-13.1%/yrLatest (2025): $108 · +1.6% YoY. Source: county tax records.
Cash-flow waterfall
monthlySold comps — $/sqft
last 12 mo · ≤1 miLoading sold comps…