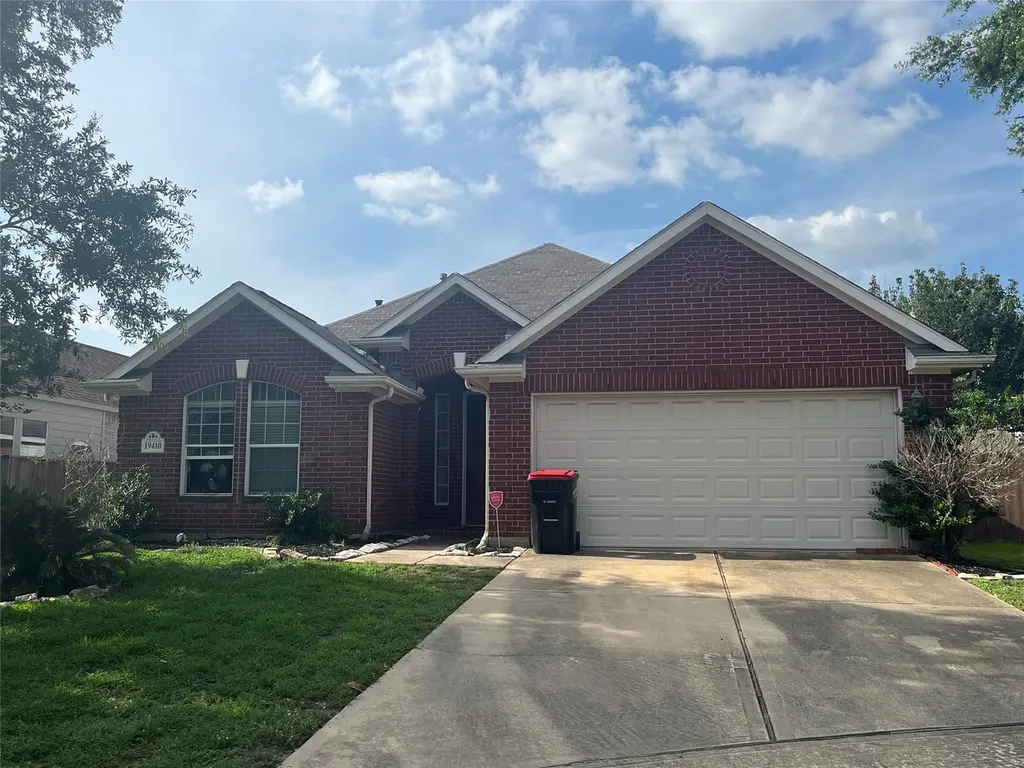
19410 Briarsedge Ct · Houston, TX
Flood risk 1/10 · Minimal
- FEMA flood zone
- X (unshaded)
- Chance of flooding over 30 yrs
- 0.0%
- Est. flood insurance / yr
- $507 – $1,088
Fire risk 3/10 · Minor
- Est. fire insurance / yr
- $1,222 – $2,270
Heat risk 9/10 · Severe
- Hot days now (above 110°F)
- 7 days/yr
- Hot days in 30 yrs
- 23 days/yr
Wind risk 8/10 · Major
- Chance of severe wind over 30 yrs
- 99.0%
Air-quality risk 2/10 · Minimal
- Unhealthy air days now
- 2 days/yr
- Unhealthy air days in 30 yrs
- 2 days/yr
Risk factors via First Street. Map © Google.
Why this score? — see what drove the B+ grade
The composite is a weighted blend of 9 inputs, each scored 0–100. Each bar is that input's sub-score; the figure is the points it added to the 100-point composite (weight × sub-score).
- Cash flow +26.5/30.0
- ARV discount +15.0/15.0
- 1% rule +10.0/10.0
- DSCR +9.0/10.0
- Schools +5.7/10.0
- Appreciation +4.4/10.0
- Livability +3.7/5.0
- Condition / age +2.5/5.0
- Rent growth +1.8/5.0
$150,000
🖨 Deal sheet (PDF) 📄 Offer letter ✓ Due diligence
Listing remarks MLS
Move in condition! Available for immediate occupancy! Beautiful interior. Split plan. Well maintained all brick home in a quiet cul de sac location. Replace all light fixtures,peuter chandelier, Nickle finish in all door knobs,neutral upgraded carpets in all bedrooms,ceramic tiles in kitchen/breakfast/all bathrooms,wood floors in living & dining;accent colors in living/dining/kitchen/breakfast,kid's bedrooms all done 8/08. Gas log added 10/09. Easy to show. Appointment required. Must see!!
Key facts
- 6,468 sq ft lot
- 2 garage spots
- Built 2002
Neighborhood map
What this means for you Summary
Snapshot
- This is a 5-bed/2.0-bath single-family listed at $150k.
Deal economics
- At list price, monthly cash flow is $397 ($5k/yr) — positive.
- The deal already cash-flows at list — no discount required.
- Meets the 1% rule at list price ($2k rent vs $150k).
- Cap rate 9.5% vs local median 3.1% in Houston — top-decile yield for the area; either an underpriced asset or a hidden risk that comps aren't pricing in. Stress-test before assuming the spread holds.
Location & tenants
- Location reads 74/100 on livability (#184 in TX, #4,771 nationally) — a middle-class / working-renter tenant base. Strengths: amenities A+, cost of living A+, housing A+; Watch: crime F.
- Katy ISD (suburban): math 61% / reading 63% proficiency, ranked #29 of 826 in TX (top 4%) — acceptable for families but not a draw, mixed tenant base, ~2y average lease.
- Zoned schools: Mayde Creek H S (math 42% / reading 54%, grade D, #571 of 1,632 statewide, top 36%, 2,940 students, 78% FRL) — zoned schools average 78% FRL vs 27% district-wide (51 pts higher); higher-poverty schools than district average — tighter screening recommended.
- Zoned-school proficiency averages 48% at this address vs 62% district-wide (-14 pts) — the specific schools serving this property underperform the Katy ISD average; the district grade overstates school quality for this exact location.
- Market conditions: Rents soft (-2.9%/yr); 744 active listings in the ZIP; 10 comparable units currently listed for rent nearby; rentals at typical pace (median 23d on market — plan ~3-4 weeks tenant-placement turnaround); solid renter incomes; 29,883 units permitted in Harris County in 2024 (8,621 in 5+ unit buildings).
- This rent runs 32% of the median local income ($88k/yr) — at the standard rent-burdened threshold; future hikes will face affordability resistance.
Forward outlook
- Local home prices are declining (-1.3%/yr); year-one equity from $1k of loan paydown is wiped out by about $2k of value loss. Plan a longer hold.
- Harris County population projected at +47% by 2050 — long-run rental-demand tailwind backs the buy-and-hold thesis.
Negotiation context
- Only 2 days on market — expect competitive offers; lowballing is unlikely to land.
Risks & watch-outs
- Watch-outs: property tax is 4.5% of price.
- Climate carrying-cost: severe wind risk, 99% chance of damaging wind over 30y; extreme-heat days projected 7→23/yr by 2055 (HVAC capex compounding) — expect insurance premiums to compound above CPI over the hold.
Questions for the listing agent
- Property tax is high relative to price — has the assessment been appealed recently, and will the sale trigger a re-assessment?
- What does the HOA fee cover, when was the last increase, and are there any pending special assessments or reserve-fund shortfalls?
- Is there a deadline driving the sale (1031 exchange, divorce, estate, relocation)? That informs how much negotiation room exists.
- Schools are D-rated, which usually means shorter tenancies and higher turnover. Who's the typical renter profile here, and what's been the actual vacancy rate?
- Crime grade is F in this area — have there been break-ins, vandalism, or insurance claims at this property in the last 3 years? What carrier currently insures it and at what premium?
- What's the average days-on-market for RENTAL listings here right now (not sales)? A rising rental-DOM trend means longer vacancies and softer asking-rent achievability than the comps imply.
- What's the recent tenant-quality profile in this submarket — average credit score on applications, eviction rate, late-payment / NSF rate, and stable-employment percentage? A property-management company in the area should have these aggregated.
- How much new for-sale + rental construction is in the pipeline within 1–3 miles? Heavy new supply typically softens prices + rents 12–24 months out; constrained supply supports both.
Investment metrics
- 1% rule
- 1.56% ✓
- Cap rate
- 9.47%
- Cash-on-cash
- 11.33%
- DSCR
- 1.50
- GRM
- 5.3
CMA / ARV
- ARV (on-the-fly)
- $277,915
- Comps found
- 12
Show comp detail 12 sales within ~0.75 mi
| Address | Dist | Beds/Ba | Sqft | Sold | Price | $/sf | Match |
|---|---|---|---|---|---|---|---|
| 3610 Maple Pass Ct | 0.14mi | 4/2.0 (-1) | 1,803 (+1%) | 1mo | $299,999 | $166 | 87 |
| 3511 Sweetspire Rd | 0.20mi | 4/2.0 (-1) | 1,934 (+8%) | 4mo | $299,900 | $155 | 69 |
| 3238 Lindenfield Dr | 0.53mi | 4/2.0 (-1) | 1,824 (+2%) | 22mo | $279,000 | $153 | 49 |
| 3714 E Piper Grove Dr | 0.26mi | 4/2.5 (-1) | 1,953 (+9%) | 22mo | $304,990 | $156 | 48 |
| 19326 Bristlestar Dr | 0.41mi | 4/2.0 (-1) | 2,021 (+13%) | 10mo | $299,995 | $148 | 46 |
| 3130 Lanville Ln | 0.70mi | 4/2.0 (-1) | 1,888 (+5%) | 10mo | $245,000 | $130 | 45 |
| 4307 Hawk Meadow Dr | 0.67mi | 4/2.5 (-1) | 1,704 (-5%) | 19mo | $274,000 | $161 | 38 |
| 19202 Bristlestar Dr | 0.53mi | 4/2.0 (-1) | 2,030 (+13%) | 16mo | $299,000 | $147 | 35 |
| 3102 Williams Cir | 0.74mi | 4/2.0 (-1) | 1,916 (+7%) | 17mo | $250,000 | $130 | 35 |
| 3103 Hartcliff Cir | 0.71mi | 4/2.5 (-1) | 2,055 (+15%) | 4mo | $290,000 | $141 | 32 |
| 19011 Appletree Hill Ln | 0.73mi | 4/2.0 (-1) | 2,006 (+12%) | 19mo | $325,000 | $162 | 25 |
| 18926 Rising Mesquite St | 0.75mi | 4/3.5 (-1) | 1,995 (+11%) | 16mo | $397,415 | $199 | 22 |
Match score weights: distance 35% · size 25% · config 20% · recency 20%. Top-matched comps best support the ARV.
Projected returns pro-forma
-1.27% appreciation · 0.0% rent growth · sell at horizon
- IRR
- 3.2%
- Equity multiple
- 1.13×
- Total profit
- $5,584
- Equity at exit
- $34,268
- IRR
- 6.6%
- Equity multiple
- 1.53×
- Total profit
- $22,456
- Equity at exit
- $34,356
Cash invested: $42,000 (down + closing). Projections, not guarantees.
Landlord ↔ Tenant lean methodology
- Overall (STATE)
- 87 Strongly Landlord-Friendly
- State Texas
- 87 Strongly Landlord-Friendly · R+5
- County
- — inherits STATE
- City
- — inherits STATE
ZIP-level market 77449
- Home prices YoY
- -0.5%
- Rents YoY
- -2.9%
- Active inventory
- 744
- Price-to-rent
- 5.3×
Monthly cashflow live
- Estimated rent
- $2,338 high interval (Pro) →
- Mortgage (P&I)
- −$787
- Tax from tax record
- −$557 /mo · $6,682/yr
- Insurance
- −$62
- HOA
- −$44
- Vacancy / Maint / Mgmt
- −$491
- Net cashflow
- $397
Break-even live
Sensitivity live
| Price | -10% $482 | -5% $439 | +0% $397 | +5% $354 | +10% $312 |
|---|---|---|---|---|---|
| Rent | -10% $212 | -5% $304 | +0% $397 | +5% $489 | +10% $581 |
| Rate | -1.0pp $472 | -0.5pp $435 | base $397 | +0.5pp $358 | +1.0pp $318 |
UW: 25.0% down · 7.5% · 30yr · 1.5% tax · 5.0% vac · 8.0% maint · 8.0% mgmt
Financing live
Cash to close
- Down payment
- $37,500
- Closing costs
- $4,500
- Reserves months
- —
- Total cash needed
- —
Loan-product check · same deal, 3 products live
Conventional
25% down · 7.5% · 30yr
- Down + closing
- —
- Monthly P&I
- —
- Monthly cashflow
- —
- DSCR
- —
- Eligible?
- —
Personal DTI + credit; lowest rate.
DSCR
20% down · 8.5% · 30yr
- Down + closing
- —
- Monthly P&I
- —
- Monthly cashflow
- —
- DSCR
- —
- Eligible?
- —
No personal income docs; deal must DSCR.
Hard money
10% down · 12.0% · 12mo
- Down + closing
- —
- Monthly P&I
- —
- Monthly cashflow
- —
- DSCR
- —
- Eligible?
- —
Short-term bridge; refi at stabilization.
Rent comps 10 comps
| Address | Beds | Baths | Sqft | Rent | $/sqft | DOM | Units | Dist |
|---|---|---|---|---|---|---|---|---|
| 19810 Hoppers Creek Dr Katy, TX | 4.0 | 2.0 | 2400 | $1,956 | $0.81 | 22d | 1 | 0.33mi |
| 19403 Misty Cove Dr Katy, TX | 4.0 | 2.0 | 1714 | $1,999 | $1.17 | 6d | 1 | 0.36mi |
| 19319 Cypress Arbor Ct Katy, TX | 4.0 | 3.0 | 1794 | $1,940 | $1.08 | 8d | 1 | 0.63mi |
| 4211 Fair Country Ln Katy, TX | 4.0 | 3.0 | 2342 | $2,275 | $0.97 | 25d | 1 | 1.19mi |
| 20102 Twilight Canyon Rd Katy, TX | 4.0 | 2.5 | 1633 | $3,395 | $2.08 | 3d | 1 | 1.23mi |
| 2923 Granite Vale Rd Houston, TX | 4.0 | 2.0 | 2319 | $2,350 | $1.01 | 44d | 1 | 1.38mi |
| 4818 Twisting Rd Houston, TX | 4.0 | 2.5 | 2516 | $2,245 | $0.89 | 21d | 1 | 1.40mi |
| 3331 Dale Ridge Trl Houston, TX | 4.0 | 2.5 | 2216 | $2,121 | $0.96 | 22d | 1 | 1.45mi |
| 20811 Trenton Valley Ln Katy, TX | 4.0 | 3.0 | 2350 | $2,200 | $0.94 | 44d | 1 | 1.47mi |
| 5039 Lamppost Hill Ct Katy, TX | 4.0 | 2.5 | 2384 | $1,896 | $0.80 | 23d | 1 | 1.47mi |
HOA detail
- Monthly dues
- $44 · $528/yr
- Likely covers
- gas
Listing history 5 events
-
2026-06-07statusdays on market $150,000 Pending 2 DOM
-
2026-06-04statusdays on market $150,000 Active 1 DOM
-
2026-06-03days on market $150,000 Coming Soon 2 DOM
-
2026-06-02remarks 410-char remark
-
2026-06-02$150,000 Coming Soon 1 DOM
ⓘ Source: listings_history table (triggers on properties + properties_extension) + one-shot
backfill from property_details.listing_events for pre-trigger history.
Tax reassessment forecast TX · Resets to sale price
- Current annual tax
- $6,682 · $557/mo
- Projected year-2 tax
- $6,682 · $557/mo
- Expected delta
- $0/yr ($0/mo · 0.0%)
ⓘ Screening estimate from a state-policy table — verify with the county assessor before closing.
Climate risk First Street
- Flood 1/10 Low FEMA zone X (unshaded) · 0% chance over 30 yrs
- Wildfire 3/10 Moderate
- Heat 9/10 Extreme 7 d/yr ≥110°F today · 23 d/yr by 30 yrs out
- Wind 8/10 Severe 99% chance of damaging wind over 30 yrs
- Air quality 2/10 Low 2 unhealthy d/yr today · 2 by 30 yrs out
Nearby sold comps map
Loading sold comps map…
Walkable amenities ~0.75 mi
Loading nearby amenities…
Taxation est. · year 1
- Rental income
- $28,050
- − Mortgage interest
- −$8,402
- − Property taxes
- −$6,682
- − Insurance
- −$750
- − Repairs & maintenance
- −$2,244
- − Management
- −$2,244
- − HOA
- −$528
- − Depreciation
- −$4,364
- Taxable income
- $2,836
- Est. tax owed @ 24.0%
- −$681
- After-tax cash flow
- $4,079/yr
For passive investors: Depreciation is non-cash, so a rental often shows a tax loss while cash-flowing — sheltering income. Rental losses are passive: they offset passive income freely, and up to $25,000/yr can offset ordinary (W-2) income if you actively participate and your MAGI is under $100k (phasing out to $0 by $150k); unused losses carry forward. On sale, claimed depreciation is recaptured at up to 25%, and gains may owe capital-gains tax (a 1031 exchange can defer both). Figures are a year-1 estimate at your 24.0% rate — not tax advice; consult a CPA.
Schools (NCES district)
- District
- Katy ISD
- NCES district ID
- 4825170
- Math proficiency
- 61% ▼ -7.00%
- Reading proficiency
- 63% ▼ -3.00%
- Median HH income
- $90,312
- Composite
- 56.59/100
- National rank
- #1146
- State rank
- #29 of 826 in TX
Livability — Houston
- Score
- 74/100
- State rank
- #184
- US rank
- #4771
Category grades
Schools grade is shown separately in the Schools card above.
Census & demographics
- County
- Harris County · 4,702,590 people
- City population
- 3,226,434
- Metro
- Houston-The Woodlands-Sugar Land, TX
- Population (ZIP)
- 130,028
- Household income
- $87,808
- Rent vs Own
- Severe rent burden
- 3088.0
Population outlook (Harris County) Hauer SSP2
- Today (2025)
- 5,571,493 people
- By 2030
- 6,089,821 · +9.3%
- By 2040
- 7,142,806 · +28.2%
- By 2050
- 8,185,864 · +46.9%
- By 2075
- 10,574,329 · +89.8%
- By 2100
- 12,109,958 · +117.4%
Race, ethnicity, and origin ACS 2023
- Neighborhood character
- Diverse neighborhood (Simpson 0.68)
- Race & ethnicity
- Hispanic / Latino 49% Two or more races 22% Black 20% White 19% Asian 6%
- Hispanic origin (detail)
- Mexican 26% Puerto Rican 1% Cuban 4%
- Common ancestry
- Lithuanian 1% Italian 1%
- Foreign-born
- 32% · Canada, Jamaica, Vietnam
- Languages at home
- 48% English-only · Spanish 40% Other Indo-European 3% Vietnamese 1%
Political lean MEDSL · Harris
- 2024 margin
- Lean D (+5.5) · D 52.0% · R 46.4% · Other 1.6%
- 2008→2024 swing
- +3.9pp toward D · 2008: 1.6pp · 2024: 5.5pp
- All cycles
- 2024: D+5.5 2020: D+13.3 2016: D+12.4 2012: D+0.1 2008: D+1.6
Not yet ingested
- Civics
- —
Market trends
- HPI YoY
- ▼ -1.27%
- Current HPI
- 254.6622
- Rent YoY
- ▼ -2.86%
- Metro
- Houston-The Woodlands-Sugar Land, TX
- State GDP YoY
- ▲ 3.95%
- F500 in state
- 110
Industry mix (Fortune 500 HQ in TX)
| Industry | F500 HQs | Revenue |
|---|---|---|
| Energy | 16 | $1,198B |
|
||
| Technology | 5 | $198B |
|
||
| Engineering / Construction | 4 | $72B |
|
||
| Energy Services | 3 | $60B |
|
||
| Utilities | 3 | $41B |
|
||
| Healthcare | 2 | $330B |
|
||
Price history
+15.5% since first listed5 events — show timeline
- 2026-06-02 Coming Soon $150,000 HARMLS
- 2009-08-07 Sold (Public Records) — Public Records
- 2009-07-31 Sold (MLS) — HARMLS
- 2009-07-30 Listing Removed — HARMLS
- 2009-02-27 Listed $129,900 HARMLS
Property tax history
+3.7%/yrLatest (2025): $6,682 · +1.4% YoY. Source: county tax records.
Cash-flow waterfall
monthlySold comps — $/sqft
last 12 mo · ≤1 miLoading sold comps…