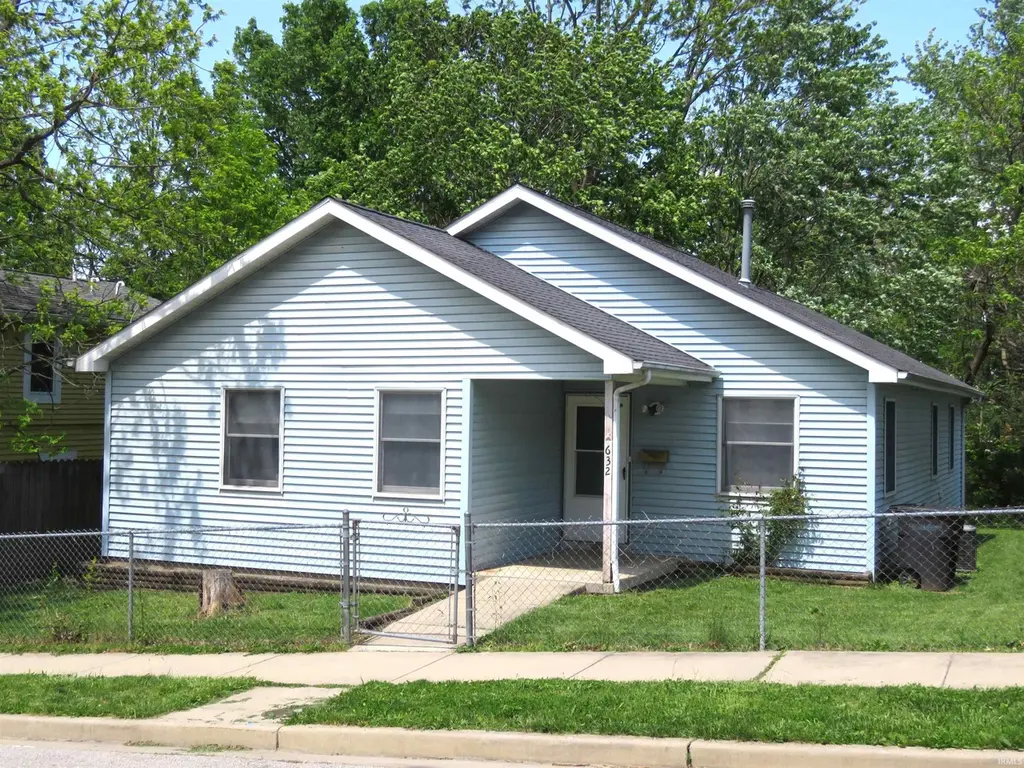
632 Romig St · Lafayette, IN
Flood risk 1/10 · Minimal
- FEMA flood zone
- X (unshaded)
- Chance of flooding over 30 yrs
- 0.0%
- Est. flood insurance / yr
- $507 – $1,088
Fire risk 1/10 · Minimal
- Est. fire insurance / yr
- $717 – $1,331
Heat risk 3/10 · Minor
- Hot days now (above 102°F)
- 7 days/yr
- Hot days in 30 yrs
- 18 days/yr
Wind risk 2/10 · Minimal
- Chance of severe wind over 30 yrs
- —
Air-quality risk 2/10 · Minimal
- Unhealthy air days now
- 1 days/yr
- Unhealthy air days in 30 yrs
- 2 days/yr
Risk factors via First Street. Map © Google.
Why this score? — see what drove the C+ grade
The composite is a weighted blend of 9 inputs, each scored 0–100. Each bar is that input's sub-score; the figure is the points it added to the 100-point composite (weight × sub-score).
- Cash flow +17.9/30.0
- ARV discount +14.0/15.0
- Appreciation +6.8/10.0
- DSCR +5.6/10.0
- 1% rule +3.7/10.0
- Rent growth +3.7/5.0
- Livability +3.7/5.0
- Schools +2.6/10.0
- Condition / age +2.5/5.0
$189,000
🖨 Deal sheet 📄 Offer letter ✓ Due diligence
Listing remarks
Rare 4 bedroom, 2 bath within walking distance of downtown Lafayette.
Key facts
- 6,970 sq ft lot
- Built 1988
Property features AI
Exterior
- Parking: No designated parking
- Utilities: Public water; Public sewer
- Home design: Single-family residential, site-built home; Single-story
- Construction: Vinyl siding; Asphalt roof
- Exterior features: Chain link and privacy fencing; Sidewalks (community feature)
Interior
- Bedrooms: Total of 7 rooms (bedrooms included in room count)
- Flooring: Carpet; Laminate
- Bathrooms: 2 full bathrooms, both on the main level
- Heating & cooling: Central air conditioning; Forced air heating
- Interior features: Carpet and laminate flooring; Crawl space basement
- Laundry & utility: Washer hookup on main level; Electric dryer hookup on main level
Neighborhood map
What this means for you Summary
Snapshot
- This is a 4-bed/1.0-bath single-family listed at $189k.
Deal economics
- At list price, monthly cash flow is $160 ($2k/yr) — positive.
- The deal already cash-flows at list — no discount required.
- To meet the 1% rule (rent ≥ 1% of price), the offer needs to be $165k (12.7% below list).
- Recommended offer: $165k (12.7% below list) — sets the bar for 1% rule.
- Cap rate 7.3% vs local median 4.2% in Lafayette — top-decile yield for the area; either an underpriced asset or a hidden risk that comps aren't pricing in. Stress-test before assuming the spread holds.
Location & tenants
- Location reads 74/100 on livability (#68 in IN, #4,374 nationally) — a middle-class / working-renter tenant base. Strengths: cost of living A+, housing A+, health & safety A+; Watch: amenities D+, employment D+, crime F.
- Lafayette School Corporation (urban): math 29% / reading 34% proficiency, ranked #235 of 301 in IN (top 78%) — families likely to look elsewhere, expect single-tenant / working-renter base with shorter leases; 63% free/reduced lunch — lower-income household profile, screen leases tightly.
- Zoned schools: Thomas Miller Elementary School (math 27% / reading 22%, grade F, #762 of 994 statewide, top 78%, 343 students, 85% FRL); Jefferson High School (math 23% / reading 55%, grade F, #235 of 369 statewide, top 65%, 2,118 students, 69% FRL).
- Market conditions: Rents rising fast (+4.8%/yr); 16 active listings in the ZIP; 16 comparable units currently listed for rent nearby; rentals at typical pace (median 21d on market — plan ~3-4 weeks tenant-placement turnaround); 1,341 units permitted in Tippecanoe County in 2024 (869 in 5+ unit buildings).
- This rent runs 42% of the median local income ($47k/yr) — at the standard rent-burdened threshold; future hikes will face affordability resistance.
Forward outlook
- In year one you build about $8k of equity ($1k loan paydown + $7k appreciation (3.5% local appreciation)).
- Tippecanoe County population projected at +41% by 2050 — long-run rental-demand tailwind backs the buy-and-hold thesis.
- At projected returns (3.5% appreciation + 4.8% rent growth), your $53k cash investment doubles in ~5 years — after that, you're playing with house money.
- By year 5, paydown + projected appreciation supports a ~$34k cash-out refi (75% LTV) — recoverable capital for the next deal without selling this one.
Negotiation context
- Only 1 days on market — expect competitive offers; lowballing is unlikely to land.
Questions for the listing agent
- Is there a deadline driving the sale (1031 exchange, divorce, estate, relocation)? That informs how much negotiation room exists.
- Schools are D-rated, which usually means shorter tenancies and higher turnover. Who's the typical renter profile here, and what's been the actual vacancy rate?
- Crime grade is F in this area — have there been break-ins, vandalism, or insurance claims at this property in the last 3 years? What carrier currently insures it and at what premium?
- What's the average days-on-market for RENTAL listings here right now (not sales)? A rising rental-DOM trend means longer vacancies and softer asking-rent achievability than the comps imply.
- What's the recent tenant-quality profile in this submarket — average credit score on applications, eviction rate, late-payment / NSF rate, and stable-employment percentage? A property-management company in the area should have these aggregated.
- How much new for-sale + rental construction is in the pipeline within 1–3 miles? Heavy new supply typically softens prices + rents 12–24 months out; constrained supply supports both.
Investment metrics
- 1% rule
- 0.87% ✗
- Cap rate
- 7.31%
- Cash-on-cash
- 3.63%
- DSCR
- 1.16
- GRM
- 9.5
CMA / ARV
- ARV (on-the-fly)
- $220,932
- Comps found
- 12
Show comp detail 12 sales within ~0.75 mi
| Address | Dist | Beds/Ba | Sqft | Sold | Price | $/sf | Match |
|---|---|---|---|---|---|---|---|
| 632 Romig St | 0.00mi | 4/2.0 | 1,292 (0%) | 1mo | $184,900 | $143 | 95 |
| 1500 El Prado St | 0.53mi | 3/1.0 (-1) | 1,282 (-1%) | 12mo | $225,000 | $176 | 59 |
| 1204 Central St | 0.63mi | 3/1.5 (-1) | 1,246 (-4%) | 2mo | $270,000 | $217 | 56 |
| 1413 Franklin St | 0.65mi | 3/1.0 (-1) | 1,344 (+4%) | 10mo | $220,000 | $164 | 50 |
| 282 Smith St | 0.41mi | 3/1.0 (-1) | 1,480 (+15%) | 4mo | $225,000 | $152 | 48 |
| 1722 Shortridge Dr | 0.69mi | 3/1.5 (-1) | 1,344 (+4%) | 8mo | $230,000 | $171 | 48 |
| 222 Washington St | 0.50mi | 3/2.0 (-1) | 1,200 (-7%) | 11mo | $207,000 | $173 | 47 |
| 1415 Virginia St | 0.57mi | 3/2.0 (-1) | 1,380 (+7%) | 9mo | $205,000 | $149 | 46 |
| 1207 S 2nd St | 0.70mi | 3/2.0 (-1) | 1,284 (-1%) | 14mo | $125,000 | $97 | 45 |
| 1415 Franklin St | 0.65mi | 3/2.0 (-1) | 1,316 (+2%) | 15mo | $260,000 | $198 | 45 |
| 1118 S 14th St | 0.71mi | 3/1.5 (-1) | 1,152 (-11%) | 8mo | $217,000 | $188 | 35 |
| 1214 King St | 0.74mi | 3/1.5 (-1) | 1,460 (+13%) | 6mo | $248,000 | $170 | 32 |
Match score weights: distance 35% · size 25% · config 20% · recency 20%. Top-matched comps best support the ARV.
Projected returns pro-forma
3.53% appreciation · 4.83% rent growth · sell at horizon
- IRR
- 13.2%
- Equity multiple
- 1.78×
- Total profit
- $41,356
- Equity at exit
- $90,694
- IRR
- 15.5%
- Equity multiple
- 3.48×
- Total profit
- $131,214
- Equity at exit
- $144,384
Cash invested: $52,920 (down + closing). Projections, not guarantees.
Landlord ↔ Tenant lean methodology
- Overall (STATE)
- 90 Strongly Landlord-Friendly
- State Indiana
- 90 Strongly Landlord-Friendly · R+11
- County
- — inherits STATE
- City
- — inherits STATE
ZIP-level market 47901
- Home prices YoY
- 1.9%
- Rents YoY
- 4.8%
- Active inventory
- 16
- Price-to-rent
- 9.5×
Monthly cashflow live
- Estimated rent
- $1,651 high interval (Pro) →
- Mortgage (P&I)
- −$991
- Tax from tax record
- −$74 /mo · $889/yr
- Insurance
- −$79
- HOA
- −$0
- Vacancy / Maint / Mgmt
- −$347
- Net cashflow
- $160
Break-even live
UW: 25.0% down · 7.5% · 30yr · 1.5% tax · 5.0% vac · 8.0% maint · 8.0% mgmt
Financing live
Cash to close
- Down payment
- $47,250
- Closing costs
- $5,670
- Reserves months
- —
- Total cash needed
- —
Loan-product check · same deal, 3 products live
Conventional
25% down · 7.5% · 30yr
- Down + closing
- —
- Monthly P&I
- —
- Monthly cashflow
- —
- DSCR
- —
- Eligible?
- —
Personal DTI + credit; lowest rate.
DSCR
20% down · 8.5% · 30yr
- Down + closing
- —
- Monthly P&I
- —
- Monthly cashflow
- —
- DSCR
- —
- Eligible?
- —
No personal income docs; deal must DSCR.
Hard money
10% down · 12.0% · 12mo
- Down + closing
- —
- Monthly P&I
- —
- Monthly cashflow
- —
- DSCR
- —
- Eligible?
- —
Short-term bridge; refi at stabilization.
Rent comps 16 comps
| Address | Beds | Baths | Sqft | Rent | $/sqft | DOM | Units | Dist |
|---|---|---|---|---|---|---|---|---|
| 6 S 4th St Lafayette, IN | 1.0–3.0 | 1.0–3.0 | 1102 | $1,649 | $1.50 | 13d | 1 | 0.32mi |
| 1611 Grove St Lafayette, IN | 3.0 | 1.5 | 1250 | $1,195 | $0.96 | 13d | 1 | 0.59mi |
| 915 N 6th St Lafayette, IN | 2.0–3.0 | 1.0–2.0 | 850 | $2,100 | $2.47 | 43d | 4 | 0.85mi |
| 320 Brown St West Lafayette, IN | 1.0–4.0 | 1.0–2.0 | 835 | $1,599 | $1.91 | 13d | 12 | 0.92mi |
| 1213 S 19th St Lafayette, IN | 3.0 | 2.0 | 1484 | $1,900 | $1.28 | 13d | 1 | 0.96mi |
| 120 S Salisbury St West Lafayette, IN | 3.0 | 2.0 | 935 | $1,399 | $1.50 | 13d | 1 | 1.04mi |
| 1038 Heath St Unit 1038 1/2 Lafayette, IN | 4.0 | 2.0 | 1650 | $1,850 | $1.12 | 21d | 1 | 1.07mi |
| 407 N 24th St Lafayette, IN | 3.0 | 2.0 | 1388 | $2,200 | $1.59 | 43d | 1 | 1.10mi |
| 270 Littleton St West Lafayette, IN | 4.0 | 1.0–2.5 | 972 | $1,115 | $1.15 | 21d | 1 | 1.14mi |
| 400 N River Rd West Lafayette, IN | 3.0 | 1.0–3.0 | 693 | $1,229 | $1.77 | 13d | 42 | 1.15mi |
| 1510 N 10th St Unit FP205 Lafayette, IN | 3.0 | 1.0 | 1050 | $1,197 | $1.14 | 13d | 1 | 1.28mi |
| 2773 PROSPERITY WAY West Lafayette, IN | 3.0 | 2.0 | 1691 | $3,095 | $1.83 | 21d | 1 | 1.30mi |
| 1502 N 13th St Lafayette, IN | 3.0 | 1.0 | 1000 | $1,050 | $1.05 | 43d | 1 | 1.30mi |
| 419 Vine St West Lafayette, IN | 3.0 | 3.0 | 880 | $2,295 | $2.61 | 21d | 1 | 1.42mi |
| 1707 Meharry St Lafayette, IN | 3.0 | 2.0 | 1348 | $1,500 | $1.11 | 21d | 1 | 1.46mi |
| 1714 N 9th St Rd Lafayette, IN | 1.0–3.0 | 1.0–2.0 | 800 | $1,099 | $1.37 | 13d | 1 | 1.48mi |
Listing history 2 events
-
2026-05-05status Pending
-
2026-05-05$189,000 Active
ⓘ Source: listings_history table (triggers on properties + properties_extension) + one-shot
backfill from property_details.listing_events for pre-trigger history.
Tax reassessment forecast IN · Partial reset (capped growth)
- Current annual tax
- $889 · $74/mo
- Projected year-2 tax
- $1,248 · $104/mo
- Expected delta
- +$359/yr (+$30/mo · 40.3%)
ⓘ Screening estimate from a state-policy table — verify with the county assessor before closing.
Climate risk First Street
- Flood 1/10 Low FEMA zone X (unshaded) · 0% chance over 30 yrs
- Wildfire 1/10 Low
- Heat 3/10 Moderate 7 d/yr ≥102°F today · 18 d/yr by 30 yrs out
- Wind 2/10 Low
- Air quality 2/10 Low 1 unhealthy d/yr today · 2 by 30 yrs out
Nearby sold comps map
Loading sold comps map…
Walkable amenities ~0.75 mi
Loading nearby amenities…
Taxation est. · year 1
- Rental income
- $19,809
- − Mortgage interest
- −$10,587
- − Property taxes
- −$889
- − Insurance
- −$945
- − Repairs & maintenance
- −$1,585
- − Management
- −$1,585
- − Depreciation
- −$5,498
- Taxable loss
- −$1,279
- Est. tax savings @ 24.0%
- +$307
- After-tax cash flow
- $2,229/yr
For passive investors: Depreciation is non-cash, so a rental often shows a tax loss while cash-flowing — sheltering income. Rental losses are passive: they offset passive income freely, and up to $25,000/yr can offset ordinary (W-2) income if you actively participate and your MAGI is under $100k (phasing out to $0 by $150k); unused losses carry forward. On sale, claimed depreciation is recaptured at up to 25%, and gains may owe capital-gains tax (a 1031 exchange can defer both). Figures are a year-1 estimate at your 24.0% rate — not tax advice; consult a CPA.
Schools (NCES district)
- District
- Lafayette School Corporation
- NCES district ID
- 1805400
- Math proficiency
- 29% ▼ -9.00%
- Reading proficiency
- 34% ▼ -7.00%
- Median HH income
- $39,817
- Composite
- 26.46/100
- National rank
- #7217
- State rank
- #235 of 301 in IN
Livability — Lafayette
- Score
- 74/100
- State rank
- #68
- US rank
- #4374
Category grades
Schools grade is shown separately in the Schools card above.
Census & demographics
- Census place
- Lafayette, IN
- County
- Tippecanoe County · 181,820 people
- City population
- 106,622
- Metro
- Lafayette-West Lafayette, IN
- Population (ZIP)
- 4,585
- Household income
- $47,206
- Rent vs Own
- Severe rent burden
- 314.0
Population outlook (Tippecanoe County) Hauer SSP2
- Today (2025)
- 215,327 people
- By 2030
- 232,284 · +7.9%
- By 2040
- 266,517 · +23.8%
- By 2050
- 302,826 · +40.6%
- By 2075
- 394,445 · +83.2%
- By 2100
- 463,500 · +115.3%
Race, ethnicity, and origin ACS 2023
- Neighborhood character
- Predominantly White (73%)
- Race & ethnicity
- White 73% Black 15% Asian 6% Two or more races 4% Hispanic / Latino 4%
- Common ancestry
- Italian 5% Romanian 4% Slovak 3%
- Foreign-born
- 15% · China, Canada, South Korea
- Languages at home
- 87% English-only · Spanish 3% Other Indo-European 3% Chinese 2%
Political lean MEDSL · Tippecanoe
- 2024 margin
- Toss-up / Even · D 49.0% · R 49.1% · Other 1.9%
- 2008→2024 swing
- -11.8pp toward R · 2008: 11.6pp · 2024: -0.1pp
- All cycles
- 2024: R+0.1 2020: D+0.6 2016: R+5.7 2012: R+3.6 2008: D+11.6
Not yet ingested
- Civics
- —
Market trends
- HPI YoY
- ▲ 3.53%
- Current HPI
- 192.353
- Rent YoY
- ▲ 4.83%
- Metro
- Lafayette-West Lafayette, IN
- State GDP YoY
- ▲ 2.90%
- F500 in state
- 18
Industry mix (Fortune 500 HQ in IN)
| Industry | F500 HQs | Revenue |
|---|---|---|
| Industrial Machinery | 2 | $37B |
|
||
| Healthcare | 1 | $177B |
|
||
| Pharmaceuticals | 1 | $45B |
|
||
| Metals / Steel | 1 | $18B |
|
||
| Agriculture | 1 | $17B |
|
||
| Packaging | 1 | $12B |
|
||
Price history
2 events — show timeline
- 2026-05-05 Pending — IRMLS
- 2026-05-05 Listed $189,000 IRMLS
Property tax history
+8.6%/yrLatest (2024): $889 · +1.1% YoY. Source: county tax records.
Cash-flow waterfall
monthlySold comps — $/sqft
last 12 mo · ≤1 miLoading sold comps…