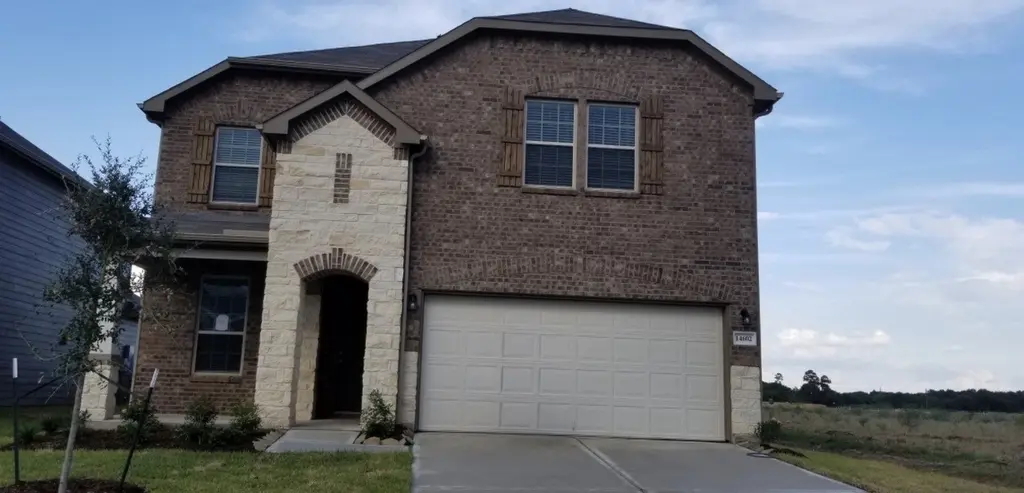
14602 Jasper Stream Ct · Houston, TX
Flood risk 1/10 · Minimal
- FEMA flood zone
- X (unshaded)
- Chance of flooding over 30 yrs
- 0.0%
- Est. flood insurance / yr
- $507 – $1,088
Fire risk 1/10 · Minimal
- Est. fire insurance / yr
- $1,222 – $2,270
Heat risk 9/10 · Severe
- Hot days now (above 111°F)
- 7 days/yr
- Hot days in 30 yrs
- 24 days/yr
Wind risk 9/10 · Severe
- Chance of severe wind over 30 yrs
- 99.0%
Air-quality risk 3/10 · Minor
- Unhealthy air days now
- 3 days/yr
- Unhealthy air days in 30 yrs
- 3 days/yr
Risk factors via First Street. Map © Google.
Why this score? — see what drove the C- grade
The composite is a weighted blend of 9 inputs, each scored 0–100. Each bar is that input's sub-score; the figure is the points it added to the 100-point composite (weight × sub-score).
- Cash flow +15.7/30.0
- 1% rule +6.2/10.0
- ARV discount +5.2/15.0
- DSCR +4.8/10.0
- Appreciation +4.5/10.0
- Schools +4.1/10.0
- Livability +3.7/5.0
- Rent growth +3.4/5.0
- Condition / age +2.5/5.0
$325,900
🖨 Deal sheet 📄 Offer letter ✓ Due diligence
Listing remarks
Beautiful two-story traditional style home. This open concept floor plan is designed for modern living and entertaining. Features a spacious kitchen that flows into the living room and dining area. It has generously sized bedrooms and a Primary suite with a private bath and walk-in closet. There is convenient access to major roadways, shopping, dining and Klein ISD schools.
Key facts
- Private bath
- Walk-in closet
- Spacious kitchen
Tags
Property features AI
Finance
- HOA & community: Community managed by Vanmor Properties; Annual association fee of $500
Exterior
- Parking: Attached 2-car garage
- Utilities: Public water; Public sewer
- Home design: Residential property; Built in 2019; Slab foundation; Shingle and wood roof; Brick, stone, and wood siding
- Construction: Brick, stone, and wood siding construction; Shingle and wood roof; Slab foundation; Built in 2019
- Exterior features: Covered patio; Patio; Deck; Fenced backyard; Located on a cul-de-sac
Interior
- Kitchen: Dishwasher; Electric oven; Gas cooktop; Disposal; Microwave; Refrigerator
- Bedrooms: Primary bedroom on the first floor (13 x 15); Secondary bedrooms on the second floor (11 x 11; 12 x 11; 12 x 12); Total rooms: 10; Office on the first floor (10 x 11); Game room on the second floor (18 x 20); Family room on the first floor (17 x 16)
- Flooring: Carpet; Vinyl
- Bathrooms: 2 full bathrooms; 1 half bathroom
- Heating & cooling: Central heating (gas); Central air conditioning (electric)
- Interior features: Gas log fireplace (1); Double vanity; Kitchen island; Kitchen/Family room combo; Primary bedroom with attached bath; Tub/shower; Ceiling fans
- Laundry & utility: Washer and dryer included (washer, dryer listed); Washer hookup; Electric dryer hookup
Neighborhood map
What this means for you Summary
Snapshot
- This is a 4-bed/2.5-bath single-family listed at $326k.
Deal economics
- At list price, monthly cash flow is $143 ($2k/yr) — positive.
- The deal already cash-flows at list — no discount required.
- Meets the 1% rule at list price ($4k rent vs $326k).
- Cap rate 6.8% vs local median 3.2% in Houston — top-decile yield for the area; either an underpriced asset or a hidden risk that comps aren't pricing in. Stress-test before assuming the spread holds.
Location & tenants
- Location reads 74/100 on livability (#184 in TX, #4,771 nationally) — a middle-class / working-renter tenant base. Strengths: amenities A+, cost of living A+, housing A+; Watch: crime F.
- Klein ISD (suburban): math 41% / reading 48% proficiency, ranked #213 of 826 in TX (top 26%) — families likely to look elsewhere, expect single-tenant / working-renter base with shorter leases.
- Zoned schools: Greenwood Forest El (math 30% / reading 34%, grade F, #2,268 of 4,322 statewide, top 55%, 672 students, 75% FRL); Wunderlich Int (math 24% / reading 34%, grade F, #1,103 of 1,662 statewide, top 67%, 1,316 students, 77% FRL); Klein H S (math 58% / reading 67%, grade B-, #234 of 1,632 statewide, top 14%, 3,352 students, 45% FRL) — zoned schools average 66% FRL vs 37% district-wide (28 pts higher); higher-poverty schools than district average — tighter screening recommended.
- Market conditions: Rents rising (+3.5%/yr); 187 active listings in the ZIP; 3 comparable units currently listed for rent nearby; rentals lingering (median 44d on market — plan ~5-8 weeks vacancy on turnover, expect pricing pressure); 67% of comp listings sitting > 30 days — soft ceiling on asking rent; solid renter incomes; 29,883 units permitted in Harris County in 2024 (8,621 in 5+ unit buildings).
- At $3,644/mo this rent would consume 54% of the median local household income ($80k/yr) (locally 1259% of renters already pay >50% of income on rent) — very limited rent-growth headroom before tenants either downsize or default.
Forward outlook
- Local home prices are declining (-1.1%/yr); year-one equity from $2k of loan paydown is wiped out by about $4k of value loss. Plan a longer hold.
- Harris County population projected at +47% by 2050 — long-run rental-demand tailwind backs the buy-and-hold thesis.
Negotiation context
- Only 6 days on market — expect competitive offers; lowballing is unlikely to land.
Risks & watch-outs
- Watch-outs: property tax is 3.1% of price.
- Climate carrying-cost: severe wind risk, 99% chance of damaging wind over 30y; extreme-heat days projected 7→24/yr by 2055 (HVAC capex compounding) — expect insurance premiums to compound above CPI over the hold.
Questions for the listing agent
- Property tax is high relative to price — has the assessment been appealed recently, and will the sale trigger a re-assessment?
- What does the HOA fee cover, when was the last increase, and are there any pending special assessments or reserve-fund shortfalls?
- Is there a deadline driving the sale (1031 exchange, divorce, estate, relocation)? That informs how much negotiation room exists.
- Schools are D-rated, which usually means shorter tenancies and higher turnover. Who's the typical renter profile here, and what's been the actual vacancy rate?
- Crime grade is F in this area — have there been break-ins, vandalism, or insurance claims at this property in the last 3 years? What carrier currently insures it and at what premium?
- What's the average days-on-market for RENTAL listings here right now (not sales)? A rising rental-DOM trend means longer vacancies and softer asking-rent achievability than the comps imply.
- What's the recent tenant-quality profile in this submarket — average credit score on applications, eviction rate, late-payment / NSF rate, and stable-employment percentage? A property-management company in the area should have these aggregated.
- How much new for-sale + rental construction is in the pipeline within 1–3 miles? Heavy new supply typically softens prices + rents 12–24 months out; constrained supply supports both.
Investment metrics
- 1% rule
- 1.12% ✓
- Cap rate
- 6.82%
- Cash-on-cash
- 1.88%
- DSCR
- 1.08
- GRM
- 7.5
CMA / ARV
- ARV (on-the-fly)
- $309,837
- Comps found
- 12
Show comp detail 12 sales within ~0.75 mi
| Address | Dist | Beds/Ba | Sqft | Sold | Price | $/sf | Match |
|---|---|---|---|---|---|---|---|
| 4422 Windmill Run Dr | 0.22mi | 3/2.5 (-1) | 2,432 (-4%) | 1mo | $299,900 | $123 | 78 |
| 4418 Windmill Run Dr | 0.23mi | 4/3.0 | 2,760 (+10%) | 0mo | $332,000 | $120 | 71 |
| 4714 Cashel Castle Dr | 0.36mi | 3/2.5 (-1) | 2,362 (-6%) | 1mo | $249,900 | $106 | 67 |
| 4726 Cashel Castle Dr | 0.36mi | 4/3.0 | 2,250 (-11%) | 1mo | $135,200 | $60 | 63 |
| 105 Old Bridge Lk | 0.54mi | 3/2.5 (-1) | 2,622 (+4%) | 1mo | $269,900 | $103 | 62 |
| 13710 Balmore Cir | 0.45mi | 4/2.5 | 2,742 (+9%) | 3mo | $350,000 | $128 | 62 |
| 4206 Tulip Oak Dr | 0.63mi | 4/2.5 | 2,362 (-6%) | 2mo | $310,000 | $131 | 59 |
| 14205 Cashel Forest Dr | 0.48mi | 3/3.0 (-1) | 2,268 (-10%) | 2mo | $299,900 | $132 | 52 |
| 5111 Olympia Fields Ln | 0.60mi | 4/3.0 | 2,801 (+11%) | 2mo | $373,500 | $133 | 50 |
| 4731 N Cashel Cir | 0.54mi | 3/2.5 (-1) | 2,222 (-12%) | 0mo | $249,000 | $112 | 50 |
| 14041 Cashel Forest Dr | 0.60mi | 3/2.5 (-1) | 2,222 (-12%) | 3mo | $225,000 | $101 | 45 |
| 13607 Wendelyn Ln | 0.57mi | 4/3.5 | 2,885 (+14%) | 2mo | $385,000 | $133 | 44 |
Match score weights: distance 35% · size 25% · config 20% · recency 20%. Top-matched comps best support the ARV.
Projected returns pro-forma
-1.09% appreciation · 3.55% rent growth · sell at horizon
- IRR
- -3.6%
- Equity multiple
- 0.84×
- Total profit
- $-14,450
- Equity at exit
- $77,197
- IRR
- 3.9%
- Equity multiple
- 1.37×
- Total profit
- $34,095
- Equity at exit
- $79,815
Cash invested: $91,252 (down + closing). Projections, not guarantees.
Landlord ↔ Tenant lean methodology
- Overall (STATE)
- 87 Strongly Landlord-Friendly
- State Texas
- 87 Strongly Landlord-Friendly · R+5
- County
- — inherits STATE
- City
- — inherits STATE
ZIP-level market 77069
- Home prices YoY
- -0.5%
- Rents YoY
- 3.5%
- Active inventory
- 187
- Price-to-rent
- 7.5×
Monthly cashflow live
- Estimated rent
- $3,644 medium interval (Pro) →
- Mortgage (P&I)
- −$1,709
- Tax from tax record
- −$849 /mo · $10,191/yr
- Insurance
- −$136
- HOA
- −$42
- Vacancy / Maint / Mgmt
- −$765
- Net cashflow
- $143
Break-even live
UW: 25.0% down · 7.5% · 30yr · 1.5% tax · 5.0% vac · 8.0% maint · 8.0% mgmt
Financing live
Cash to close
- Down payment
- $81,475
- Closing costs
- $9,777
- Reserves months
- —
- Total cash needed
- —
Loan-product check · same deal, 3 products live
Conventional
25% down · 7.5% · 30yr
- Down + closing
- —
- Monthly P&I
- —
- Monthly cashflow
- —
- DSCR
- —
- Eligible?
- —
Personal DTI + credit; lowest rate.
DSCR
20% down · 8.5% · 30yr
- Down + closing
- —
- Monthly P&I
- —
- Monthly cashflow
- —
- DSCR
- —
- Eligible?
- —
No personal income docs; deal must DSCR.
Hard money
10% down · 12.0% · 12mo
- Down + closing
- —
- Monthly P&I
- —
- Monthly cashflow
- —
- DSCR
- —
- Eligible?
- —
Short-term bridge; refi at stabilization.
Rent comps 3 comps
| Address | Beds | Baths | Sqft | Rent | $/sqft | DOM | Units | Dist |
|---|---|---|---|---|---|---|---|---|
| 4622 Falling Sun Dr Houston, TX | 4.0 | 3.0 | 2485 | $2,500 | $1.01 | 43d | 1 | 0.13mi |
| 4807 Wellington Way Houston, TX | 3.0 | 2.5 | 2876 | $2,500 | $0.87 | 43d | 1 | 0.23mi |
| 5135 Westerham Pl Unit 1262307P Houston, TX | 5.0 | 3.5 | 3358 | $17,582 | $5.24 | 22d | 1 | 0.44mi |
HOA detail
- Monthly dues
- $42 · $504/yr
Listing history 6 events
-
2026-06-18days on market $325,900 Active 6 DOM
-
2026-06-17days on market $325,900 Active 5 DOM
-
2026-06-16days on market $325,900 Active 4 DOM
-
2026-06-15days on market $325,900 Active 3 DOM
-
2026-06-13remarks 376-char remark
-
2026-06-13$325,900 Active 1 DOM
ⓘ Source: listings_history table (triggers on properties + properties_extension) + one-shot
backfill from property_details.listing_events for pre-trigger history.
Tax reassessment forecast TX · Resets to sale price
- Current annual tax
- $10,191 · $849/mo
- Projected year-2 tax
- $10,191 · $849/mo
- Expected delta
- $0/yr ($0/mo · 0.0%)
ⓘ Screening estimate from a state-policy table — verify with the county assessor before closing.
Climate risk First Street
- Flood 1/10 Low FEMA zone X (unshaded) · 0% chance over 30 yrs
- Wildfire 1/10 Low
- Heat 9/10 Extreme 7 d/yr ≥111°F today · 24 d/yr by 30 yrs out
- Wind 9/10 Extreme 99% chance of damaging wind over 30 yrs
- Air quality 3/10 Moderate 3 unhealthy d/yr today · 3 by 30 yrs out
Nearby sold comps map
Loading sold comps map…
Walkable amenities ~0.75 mi
Loading nearby amenities…
Taxation est. · year 1
- Rental income
- $43,730
- − Mortgage interest
- −$18,255
- − Property taxes
- −$10,191
- − Insurance
- −$1,630
- − Repairs & maintenance
- −$3,498
- − Management
- −$3,498
- − HOA
- −$504
- − Depreciation
- −$9,481
- Taxable loss
- −$3,328
- Est. tax savings @ 24.0%
- +$799
- After-tax cash flow
- $2,512/yr
For passive investors: Depreciation is non-cash, so a rental often shows a tax loss while cash-flowing — sheltering income. Rental losses are passive: they offset passive income freely, and up to $25,000/yr can offset ordinary (W-2) income if you actively participate and your MAGI is under $100k (phasing out to $0 by $150k); unused losses carry forward. On sale, claimed depreciation is recaptured at up to 25%, and gains may owe capital-gains tax (a 1031 exchange can defer both). Figures are a year-1 estimate at your 24.0% rate — not tax advice; consult a CPA.
Schools (NCES district)
- District
- Klein ISD
- NCES district ID
- 4825740
- Math proficiency
- 41% ▼ -12.00%
- Reading proficiency
- 48% ▼ -3.00%
- Median HH income
- $78,288
- Composite
- 40.91/100
- National rank
- #3615
- State rank
- #213 of 826 in TX
Livability — Houston
- Score
- 74/100
- State rank
- #184
- US rank
- #4771
Category grades
Schools grade is shown separately in the Schools card above.
Census & demographics
- County
- Harris County · 4,702,590 people
- City population
- 3,226,434
- Metro
- Houston-The Woodlands-Sugar Land, TX
- Population (ZIP)
- 20,608
- Household income
- $80,257
- Rent vs Own
- Severe rent burden
- 1259.0
Population outlook (Harris County) Hauer SSP2
- Today (2025)
- 5,571,493 people
- By 2030
- 6,089,821 · +9.3%
- By 2040
- 7,142,806 · +28.2%
- By 2050
- 8,185,864 · +46.9%
- By 2075
- 10,574,329 · +89.8%
- By 2100
- 12,109,958 · +117.4%
Race, ethnicity, and origin ACS 2023
- Neighborhood character
- Diverse neighborhood (Simpson 0.69)
- Race & ethnicity
- White 43% Black 30% Hispanic / Latino 19% Two or more races 12% Asian 5%
- Hispanic origin (detail)
- Mexican 11% Puerto Rican 2% Salvadoran 2%
- Common ancestry
- Slovak 2% Lithuanian 2% Italian 2%
- Foreign-born
- 12% · Canada, Vietnam, Jamaica
- Languages at home
- 79% English-only · Spanish 14% Other Indo-European 2% German/W. Germanic 1%
Political lean MEDSL · Harris
- 2024 margin
- Lean D (+5.5) · D 52.0% · R 46.4% · Other 1.6%
- 2008→2024 swing
- +3.9pp toward D · 2008: 1.6pp · 2024: 5.5pp
- All cycles
- 2024: D+5.5 2020: D+13.3 2016: D+12.4 2012: D+0.1 2008: D+1.6
Not yet ingested
- Civics
- —
Market trends
- HPI YoY
- ▼ -1.09%
- Current HPI
- 201.0894
- Rent YoY
- ▲ 3.55%
- Metro
- Houston-The Woodlands-Sugar Land, TX
- State GDP YoY
- ▲ 3.95%
- F500 in state
- 110
Industry mix (Fortune 500 HQ in TX)
| Industry | F500 HQs | Revenue |
|---|---|---|
| Energy | 16 | $1,198B |
|
||
| Technology | 5 | $198B |
|
||
| Engineering / Construction | 4 | $72B |
|
||
| Energy Services | 3 | $60B |
|
||
| Utilities | 3 | $41B |
|
||
| Healthcare | 2 | $330B |
|
||
Price history
1 event — show timeline
- 2026-06-12 Listed $325,900 HARMLS
Property tax history
+53.0%/yrLatest (2025): $10,191 · -1.7% YoY. Source: county tax records.
Cash-flow waterfall
monthlySold comps — $/sqft
last 12 mo · ≤1 miLoading sold comps…