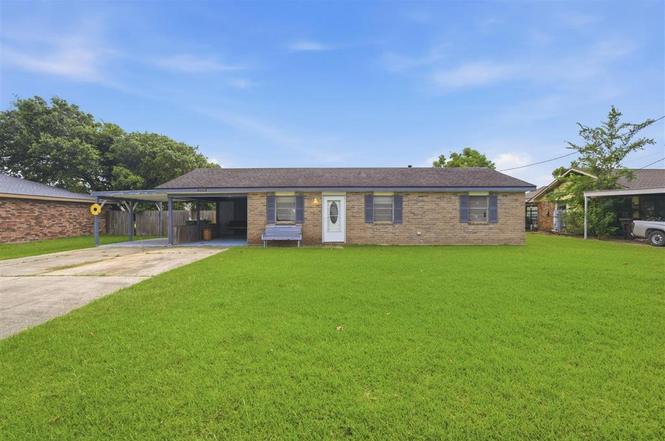
1734 Myrtle St · Westlake, LA
Flood risk 1/10 · Minimal
- FEMA flood zone
- X (shaded)
- Chance of flooding over 30 yrs
- 0.0%
- Est. flood insurance / yr
- $507 – $1,088
Fire risk 3/10 · Minor
- Est. fire insurance / yr
- $1,269 – $2,357
Heat risk 9/10 · Severe
- Hot days now (above 109°F)
- 7 days/yr
- Hot days in 30 yrs
- 23 days/yr
Wind risk 9/10 · Severe
- Chance of severe wind over 30 yrs
- 99.0%
Air-quality risk 2/10 · Minimal
- Unhealthy air days now
- 1 days/yr
- Unhealthy air days in 30 yrs
- 1 days/yr
Risk factors via First Street. Map © Google.
Why this score? — see what drove the C grade
The composite is a weighted blend of 9 inputs, each scored 0–100. Each bar is that input's sub-score; the figure is the points it added to the 100-point composite (weight × sub-score).
- Cash flow +27.9/30.0
- DSCR +9.9/10.0
- 1% rule +6.7/10.0
- Livability +3.3/5.0
- Schools +3.1/10.0
- Rent growth +2.5/5.0
- Condition / age +2.5/5.0
- ARV discount +0.0/15.0
- Appreciation +0.0/10.0
$144,500
🖨 Deal sheet 📄 Offer letter ✓ Due diligence
Listing remarks
Some homes simply tell a story. Lovingly maintained by the same owner for decades, this 3-bedroom, 1-bath brick home is ready for its next chapter. Offering over 1,100 square feet of living space, a spacious fenced backyard, covered patio, detached workshop, and additional covered storage, the property provides flexibility for a variety of lifestyles and needs. Whether you're looking for extra workspace, storage, room for projects, or simply a place to make your own, you'll appreciate the possibilities this property offers. With a convenient Westlake location and features that are increasingly difficult to find at this price point, this home is ready for its next owner to bring their vision
Key facts
- Covered storage
- Detached workshop
- Covered patio
Tags
Property features AI
Finance
- Other: Residential zoning; Lot dimensions approximately 120' x 78' (0.21 acres); Paved city street frontage; Has a view; Located in Western Heights Subdivision
Exterior
- Parking: Attached carport; Carport provides 2 covered spaces; Total of 2 parking spaces; Open parking available
- Utilities: Public water; Public sewer; Electricity connected; Water connected; Sewer connected
- Home design: Single-family house; Single story; East-facing; Fixer condition; No shared walls
- Construction: Brick construction; Shingle roof; Slab foundation; Built on a rectangular city lot
- Exterior features: Outdoor lighting; Rear covered porch and patio; Privacy wood fencing; Outbuilding/storage
Interior
- Kitchen: Laminate counters
- Bedrooms: 3 bedrooms on the main level
- Bathrooms: 1 full bathroom on the main level
- Heating & cooling: Central heating; Central air conditioning
- Interior features: Ceiling fans; Laminate countertops; No fireplace
- Laundry & utility: Indoor laundry room
Neighborhood map
What this means for you Summary
Snapshot
- This is a 3-bed/1.0-bath single-family listed at $144k.
Deal economics
- At list price, monthly cash flow is $445 ($5k/yr) — positive.
- The deal already cash-flows at list — no discount required.
- Meets the 1% rule at list price ($2k rent vs $144k).
- Cap rate 10.0% vs local median 6.4% in Westlake — top-decile yield for the area; either an underpriced asset or a hidden risk that comps aren't pricing in. Stress-test before assuming the spread holds.
Location & tenants
- Location reads 66/100 on livability (#120 in LA) — a middle-class / working-renter tenant base. Strengths: cost of living A+, housing A+, health & safety A; Watch: amenities F, commute F.
- Calcasieu Parish (other): math 30% / reading 44% proficiency, ranked #29 of 98 in LA (top 30%) — families likely to look elsewhere, expect single-tenant / working-renter base with shorter leases.
- Zoned schools: Westwood Elementary School (411 students, 62% FRL); S. P. Arnett Middle School (math 25% / reading 51%, grade F, #73 of 218 statewide, top 34%, 370 students, 55% FRL); Westlake High School (math 37% / reading 42%, grade F, #80 of 265 statewide, top 32%, 529 students, 44% FRL) — zoned schools at 53% FRL track the district average.
- Market conditions: 148 active listings in the ZIP; 1,298 units permitted in Calcasieu Parish in 2024 (526 in 5+ unit buildings).
Forward outlook
- Local home prices are declining (-3.0%/yr); year-one equity from $999 of loan paydown is wiped out by about $4k of value loss. Plan a longer hold.
- Calcasieu County population projected at +11% by 2050 — modest demand growth; plan on rents tracking national, not racing it.
- At projected returns (-3.0% appreciation + 3.0% rent growth), your $40k cash investment doubles in ~9 years — after that, you're playing with house money.
Negotiation context
- Only 9 days on market — expect competitive offers; lowballing is unlikely to land.
Risks & watch-outs
- Climate carrying-cost: severe wind risk, 99% chance of damaging wind over 30y; extreme-heat days projected 7→23/yr by 2055 (HVAC capex compounding) — expect insurance premiums to compound above CPI over the hold.
Questions for the listing agent
- Built in 1978 — when were the roof, HVAC, electrical panel, plumbing, and water heater last replaced?
- Is there a deadline driving the sale (1031 exchange, divorce, estate, relocation)? That informs how much negotiation room exists.
- Schools are A-rated — typically a magnet for longer-tenancy family renters. What's the average tenant stay here, and is there a school-zone premium baked into asking?
- What's the average days-on-market for RENTAL listings here right now (not sales)? A rising rental-DOM trend means longer vacancies and softer asking-rent achievability than the comps imply.
- What's the recent tenant-quality profile in this submarket — average credit score on applications, eviction rate, late-payment / NSF rate, and stable-employment percentage? A property-management company in the area should have these aggregated.
- How much new for-sale + rental construction is in the pipeline within 1–3 miles? Heavy new supply typically softens prices + rents 12–24 months out; constrained supply supports both.
Investment metrics
- 1% rule
- 1.17% ✓
- Cap rate
- 9.99%
- Cash-on-cash
- 13.19%
- DSCR
- 1.59
- GRM
- 7.1
CMA / ARV
- ARV (on-the-fly)
- $121,065
- Comps found
- 5
Show comp detail 5 sales within ~0.75 mi
| Address | Dist | Beds/Ba | Sqft | Sold | Price | $/sf | Match |
|---|---|---|---|---|---|---|---|
| 1733 Myrtle St | 0.03mi | 3/1.5 | 1,193 (+4%) | 5mo | $125,000 | $105 | 86 |
| 1226 Shady Ln | 0.07mi | 3/2.0 | 1,258 (+9%) | 20mo | $132,000 | $105 | 61 |
| 2203 Ellis Dr | 0.43mi | 3/1.0 | 1,243 (+8%) | 9mo | $105,000 | $84 | 60 |
| 1724 Saint John Bosco St | 0.47mi | 3/1.0 | 1,250 (+8%) | 15mo | $135,000 | $108 | 52 |
| 1401 Clarence St St | 0.36mi | 2/1.0 (-1) | 1,013 (-12%) | 8mo | $77,500 | $77 | 51 |
Match score weights: distance 35% · size 25% · config 20% · recency 20%. Top-matched comps best support the ARV.
Projected returns pro-forma
-3.0% appreciation · 3.0% rent growth · sell at horizon
- IRR
- 3.1%
- Equity multiple
- 1.12×
- Total profit
- $4,873
- Equity at exit
- $21,545
- IRR
- 12.7%
- Equity multiple
- 2.00×
- Total profit
- $40,563
- Equity at exit
- $12,494
Cash invested: $40,460 (down + closing). Projections, not guarantees.
Landlord ↔ Tenant lean methodology
- Overall (STATE)
- 90 Strongly Landlord-Friendly
- State Louisiana
- 90 Strongly Landlord-Friendly · R+12
- County
- — inherits STATE
- City
- — inherits STATE
ZIP-level market 70669
- Active inventory
- 148
- Price-to-rent
- 7.1×
Monthly cashflow live
- Estimated rent
- $1,695 medium interval (Pro) →
- Mortgage (P&I)
- −$758
- Tax from tax record
- −$76 /mo · $915/yr
- Insurance
- −$60
- HOA
- −$0
- Vacancy / Maint / Mgmt
- −$356
- Net cashflow
- $445
Break-even live
UW: 25.0% down · 7.5% · 30yr · 1.5% tax · 5.0% vac · 8.0% maint · 8.0% mgmt
Financing live
Cash to close
- Down payment
- $36,125
- Closing costs
- $4,335
- Reserves months
- —
- Total cash needed
- —
Loan-product check · same deal, 3 products live
Conventional
25% down · 7.5% · 30yr
- Down + closing
- —
- Monthly P&I
- —
- Monthly cashflow
- —
- DSCR
- —
- Eligible?
- —
Personal DTI + credit; lowest rate.
DSCR
20% down · 8.5% · 30yr
- Down + closing
- —
- Monthly P&I
- —
- Monthly cashflow
- —
- DSCR
- —
- Eligible?
- —
No personal income docs; deal must DSCR.
Hard money
10% down · 12.0% · 12mo
- Down + closing
- —
- Monthly P&I
- —
- Monthly cashflow
- —
- DSCR
- —
- Eligible?
- —
Short-term bridge; refi at stabilization.
Listing history 8 events
-
2026-06-19days on market $144,500 Active 9 DOM
-
2026-06-18days on market $144,500 Active 8 DOM
-
2026-06-17days on market $144,500 Active 7 DOM
-
2026-06-16days on market $144,500 Active 6 DOM
-
2026-06-15days on market $144,500 Active 5 DOM
-
2026-06-14days on market $144,500 Active 3 DOM
-
2026-06-13remarks 699-char remark
-
2026-06-13$144,500 Active 2 DOM
ⓘ Source: listings_history table (triggers on properties + properties_extension) + one-shot
backfill from property_details.listing_events for pre-trigger history.
Tax reassessment forecast LA · Resets to sale price
- Current annual tax
- $915 · $76/mo
- Projected year-2 tax
- $915 · $76/mo
- Expected delta
- $0/yr ($0/mo · -0.0%)
ⓘ Screening estimate from a state-policy table — verify with the county assessor before closing.
Climate risk First Street
- Flood 1/10 Low FEMA zone X (shaded) · 0% chance over 30 yrs
- Wildfire 3/10 Moderate
- Heat 9/10 Extreme 7 d/yr ≥109°F today · 23 d/yr by 30 yrs out
- Wind 9/10 Extreme 99% chance of damaging wind over 30 yrs
- Air quality 2/10 Low 1 unhealthy d/yr today · 1 by 30 yrs out
Nearby sold comps map
Loading sold comps map…
Walkable amenities ~0.75 mi
Loading nearby amenities…
Taxation est. · year 1
- Rental income
- $20,340
- − Mortgage interest
- −$8,094
- − Property taxes
- −$915
- − Insurance
- −$722
- − Repairs & maintenance
- −$1,627
- − Management
- −$1,627
- − Depreciation
- −$4,204
- Taxable income
- $3,150
- Est. tax owed @ 24.0%
- −$756
- After-tax cash flow
- $4,581/yr
For passive investors: Depreciation is non-cash, so a rental often shows a tax loss while cash-flowing — sheltering income. Rental losses are passive: they offset passive income freely, and up to $25,000/yr can offset ordinary (W-2) income if you actively participate and your MAGI is under $100k (phasing out to $0 by $150k); unused losses carry forward. On sale, claimed depreciation is recaptured at up to 25%, and gains may owe capital-gains tax (a 1031 exchange can defer both). Figures are a year-1 estimate at your 24.0% rate — not tax advice; consult a CPA.
Schools (NCES district)
- District
- Calcasieu Parish
- NCES district ID
- 2200330
- Math proficiency
- 30% ▼ -39.00%
- Reading proficiency
- 44% ▼ -33.00%
- Median HH income
- $44,700
- Composite
- 31.45/100
- National rank
- #5979
- State rank
- #29 of 98 in LA
Livability — Westlake
- Score
- 66/100
- State rank
- #120
- US rank
- #11457
Category grades
Schools grade is shown separately in the Schools card above.
Census & demographics
- Census place
- Westlake, LA
- County
- Calcasieu Parish · 170,889 people
- City population
- 9,552
- Metro
- Lake Charles, LA
- Population (ZIP)
- 9,552
- Household income
- $69,106
- Rent vs Own
- Severe rent burden
- 178.0
Population outlook (Calcasieu County) Hauer SSP2
- Today (2025)
- 212,179 people
- By 2030
- 218,199 · +2.8%
- By 2040
- 228,486 · +7.7%
- By 2050
- 236,208 · +11.3%
- By 2075
- 251,696 · +18.6%
- By 2100
- 247,848 · +16.8%
Race, ethnicity, and origin ACS 2023
- Neighborhood character
- Predominantly White (82%)
- Race & ethnicity
- White 82% Black 9% Two or more races 4% Hispanic / Latino 4% Asian 3%
- Common ancestry
- Lithuanian 7% Serbian 2% Italian 1%
- Foreign-born
- 3% · Canada, South Korea
- Languages at home
- 93% English-only · Other Asian/Pacific 3% Spanish 2% French/Haitian/Cajun 1%
Political lean MEDSL · Calcasieu
- 2024 margin
- Solid R (+39.6) · D 29.5% · R 69.0% · Other 1.5%
- 2008→2024 swing
- -15.0pp toward R · 2008: -24.6pp · 2024: -39.6pp
- All cycles
- 2024: R+39.6 2020: R+35.2 2016: R+33.3 2012: R+28.7 2008: R+24.6
Not yet ingested
- Civics
- —
Market trends
- HPI YoY
- ▼ -107.45%
- Current HPI
- 81.9801
- Rent YoY
- —
- Metro
- Lake Charles, LA
- State GDP YoY
- ▲ 3.29%
- F500 in state
- 10
Industry mix (Fortune 500 HQ in LA)
| Industry | F500 HQs | Revenue |
|---|---|---|
| Telecommunications | 2 | $23B |
|
||
| Utilities | 1 | $12B |
|
||
| Wholesale / Distribution | 1 | $5B |
|
||
| Advertising | 1 | $2B |
|
||
Price history
1 event — show timeline
- 2026-06-10 Listed $144,500 SWLAR
Property tax history
+4.0%/yrLatest (2025): $915 · +3.2% YoY. Source: county tax records.
Cash-flow waterfall
monthlySold comps — $/sqft
last 12 mo · ≤1 miLoading sold comps…