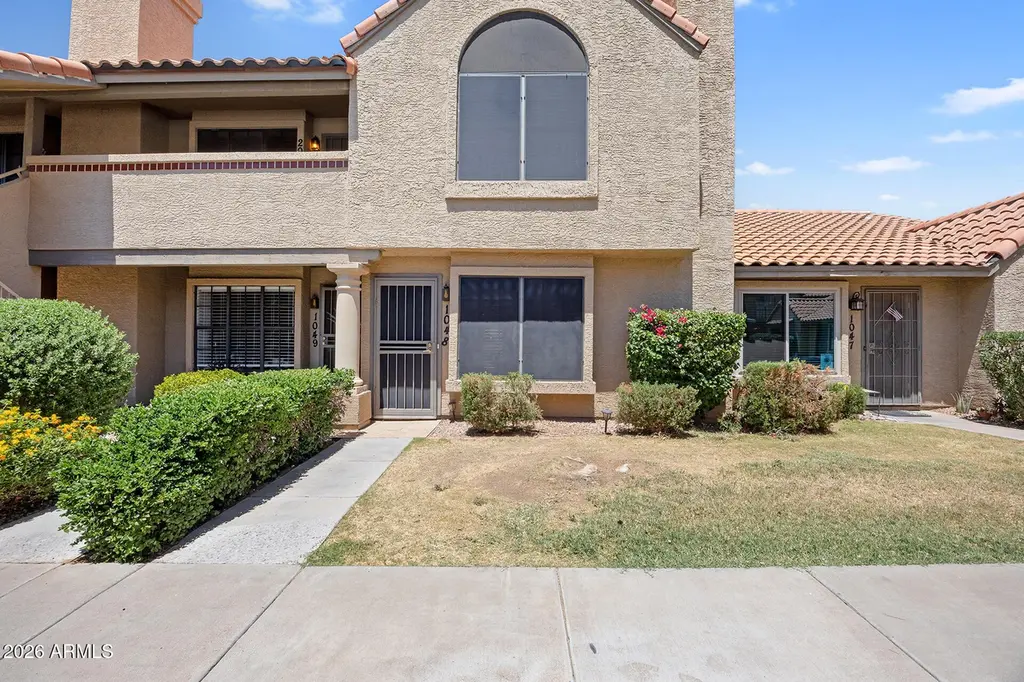
5704 E Aire Libre Ave #1048 · Phoenix, AZ
Flood risk 1/10 · Minimal
- FEMA flood zone
- X (shaded)
- Chance of flooding over 30 yrs
- 0.0%
- Est. flood insurance / yr
- $507 – $1,088
Fire risk 4/10 · Minor
- Est. fire insurance / yr
- $610 – $1,132
Heat risk 8/10 · Major
- Hot days now (above 111°F)
- 5 days/yr
- Hot days in 30 yrs
- 14 days/yr
Wind risk 1/10 · Minimal
- Chance of severe wind over 30 yrs
- —
Air-quality risk 3/10 · Minor
- Unhealthy air days now
- 2 days/yr
- Unhealthy air days in 30 yrs
- 3 days/yr
Risk factors via First Street. Map © Google.
Why this score? — see what drove the D grade
The composite is a weighted blend of 9 inputs, each scored 0–100. Each bar is that input's sub-score; the figure is the points it added to the 100-point composite (weight × sub-score).
- Cash flow +11.6/30.0
- ARV discount +9.9/15.0
- Schools +3.8/10.0
- Livability +3.8/5.0
- 1% rule +3.4/10.0
- DSCR +3.4/10.0
- Rent growth +3.4/5.0
- Condition / age +2.5/5.0
- Appreciation +0.0/10.0
$310,000
🖨 Deal sheet (PDF) 📄 Offer letter ✓ Due diligence
Listing remarks MLS
Charming 2-bedroom, 2.5-bath townhome in a desirable North Scottsdale community! This light-filled home features wood and tile flooring throughout and vaulted ceilings in both bedrooms that create an open, airy feel. Each spacious bedroom includes its own private ensuite bath. The inviting living area offers a cozy fireplace and flows into a bright kitchen with ample cabinetry, dining space, and natural light. A convenient in-unit stacked washer and dryer and half bath complete the main level. Step outside to a private north-facing patio--perfect for relaxing or weekend BBQs. The community features a large resort-style pool with cabanas and well-maintained grounds. Prime location near Loop 101, SR-51, shopping, dining, golf, and everything North Scottsdale has to offer!
Key facts
- $289 HOA
- Parking
- Community pool
Neighborhood map
What this means for you Summary
Snapshot
- This is a 2-bed/3.0-bath condo listed at $310k.
Deal economics
- At list price, monthly cash flow is $-95 ($-1k/yr) — negative.
- To cash-flow at today's rent, offer at most $293k (5.4% below list).
- To meet the 1% rule (rent ≥ 1% of price), the offer needs to be $260k (16.0% below list).
- Recommended offer: $260k (16.0% below list) — sets the bar for 1% rule.
- Cap rate 5.9% vs local median 3.3% in Phoenix — top-decile yield for the area; either an underpriced asset or a hidden risk that comps aren't pricing in. Stress-test before assuming the spread holds.
Location & tenants
- Location reads 75/100 on livability (#16 in AZ, #3,924 nationally) — a middle-class / working-renter tenant base. Strengths: amenities A+, commute A+, housing A+; Watch: health & safety C-, crime F.
- Paradise Valley Unified District (4241) (urban): math 39% / reading 46% proficiency, ranked #56 of 249 in AZ (top 22%) — families likely to look elsewhere, expect single-tenant / working-renter base with shorter leases.
- Zoned schools: North Ranch Elementary School (math 58% / reading 70%, grade B, #115 of 1,109 statewide, top 11%, 459 students, 11% FRL); Desert Shadows Middle School (math 45% / reading 52%, grade C-, #32 of 218 statewide, top 15%, 780 students, 7% FRL); Horizon High School (math 39% / reading 40%, grade F, #72 of 381 statewide, top 20%, 1,905 students, 7% FRL) — zoned schools average 8% FRL vs 29% district-wide (21 pts lower); this property's tenant base skews higher-income than the district average.
- Market conditions: Rents rising (+3.4%/yr); 398 active listings in the ZIP; 27 comparable units currently listed for rent nearby; rentals at typical pace (median 15d on market — plan ~3-4 weeks tenant-placement turnaround); high-income renter base; 36,011 units permitted in Maricopa County in 2024 (12,801 in 5+ unit buildings).
Forward outlook
- Local home prices are declining (-3.0%/yr); year-one equity from $2k of loan paydown is wiped out by about $9k of value loss. Plan a longer hold.
- Maricopa County population projected at +38% by 2050 — long-run rental-demand tailwind backs the buy-and-hold thesis.
Negotiation context
- It's been on market 45 days — a 3% lower offer ($301k) is reasonable based on typical stale-listing flexibility.
- 7 sale attempts since 20y ago with the ask held roughly flat each time — persistent listings suggest the price (not the market) is what's stuck; bring a comps-based counter.
- Current owner paid $130k; list at $310k implies a 138% gain — meaningful room to come down on a strong offer.
Risks & watch-outs
- Climate carrying-cost: extreme-heat days projected 5→14/yr by 2055 (HVAC capex compounding) — expect insurance premiums to compound above CPI over the hold.
Questions for the listing agent
- What do current leases actually rent for vs. the listed asking? Can we see a recent rent roll and the last 12 months of T-12 income?
- It's been on market 45 days. Have you received any prior offers? Is the seller open to a 16% concession, seller financing, or rate buy-down credit?
- What does the HOA fee cover, when was the last increase, and are there any pending special assessments or reserve-fund shortfalls?
- Any open or pending special assessments — roof, HVAC, plumbing, elevator, façade? What's the per-unit balance and payoff schedule, and is the seller paying it off at close or rolling it to the buyer?
- Is there a deadline driving the sale (1031 exchange, divorce, estate, relocation)? That informs how much negotiation room exists.
- Crime grade is F in this area — have there been break-ins, vandalism, or insurance claims at this property in the last 3 years? What carrier currently insures it and at what premium?
- The area grade is low — what's the realistic commute time and amenity access for the typical tenant pool here? Any planned neighborhood developments (good or bad) we should know about?
- What's the average days-on-market for RENTAL listings here right now (not sales)? A rising rental-DOM trend means longer vacancies and softer asking-rent achievability than the comps imply.
- What's the recent tenant-quality profile in this submarket — average credit score on applications, eviction rate, late-payment / NSF rate, and stable-employment percentage? A property-management company in the area should have these aggregated.
- How much new apartment / multifamily construction is in the pipeline within 1–3 miles? Heavy new supply (>2% of stock underway) typically softens rents 12–24 months out; light construction supports rent growth.
Investment metrics
- 1% rule
- 0.84% ✗
- Cap rate
- 5.93%
- Cash-on-cash
- -1.31%
- DSCR
- 0.94
- GRM
- 9.9
CMA / ARV
- ARV (median comp)
- $327,431
- List price
- $310,000
- Delta
- -5.32%
- Verdict
- FAIR
- Comps
- 20 within 1.0 mi
Projected returns pro-forma
-3.0% appreciation · 3.42% rent growth · sell at horizon
- IRR
- -18.0%
- Equity multiple
- 0.37×
- Total profit
- $-55,107
- Equity at exit
- $46,222
- IRR
- -9.3%
- Equity multiple
- 0.41×
- Total profit
- $-50,986
- Equity at exit
- $26,803
Cash invested: $86,800 (down + closing). Projections, not guarantees.
Landlord ↔ Tenant lean methodology
- Overall (STATE)
- 87 Strongly Landlord-Friendly
- State Arizona
- 87 Strongly Landlord-Friendly · R+3
- County
- — inherits STATE
- City
- — inherits STATE
ZIP-level market 85254
- Rents YoY
- 3.4%
- Active inventory
- 398
- Price-to-rent
- 9.9×
Monthly cashflow live
- Estimated rent
- $2,604 high interval (Pro) →
- Mortgage (P&I)
- −$1,626
- Tax from tax record
- −$108 /mo · $1,298/yr
- Insurance
- −$129
- HOA
- −$289
- Vacancy / Maint / Mgmt
- −$547
- Net cashflow
- $-95
Break-even live
Sensitivity live
| Price | -10% $81 | -5% $-7 | +0% $-95 | +5% $-182 | +10% $-270 |
|---|---|---|---|---|---|
| Rent | -10% $-300 | -5% $-197 | +0% $-95 | +5% $8 | +10% $111 |
| Rate | -1.0pp $62 | -0.5pp $-16 | base $-95 | +0.5pp $-175 | +1.0pp $-257 |
UW: 25.0% down · 7.5% · 30yr · 1.5% tax · 5.0% vac · 8.0% maint · 8.0% mgmt
Financing live
Cash to close
- Down payment
- $77,500
- Closing costs
- $9,300
- Reserves months
- —
- Total cash needed
- —
Loan-product check · same deal, 3 products live
Conventional
25% down · 7.5% · 30yr
- Down + closing
- —
- Monthly P&I
- —
- Monthly cashflow
- —
- DSCR
- —
- Eligible?
- —
Personal DTI + credit; lowest rate.
DSCR
20% down · 8.5% · 30yr
- Down + closing
- —
- Monthly P&I
- —
- Monthly cashflow
- —
- DSCR
- —
- Eligible?
- —
No personal income docs; deal must DSCR.
Hard money
10% down · 12.0% · 12mo
- Down + closing
- —
- Monthly P&I
- —
- Monthly cashflow
- —
- DSCR
- —
- Eligible?
- —
Short-term bridge; refi at stabilization.
Rent comps 27 comps
| Address | Beds | Baths | Sqft | Rent | $/sqft | DOM | Units | Dist |
|---|---|---|---|---|---|---|---|---|
| 5704 E Aire Libre Ave Scottsdale, AZ | 1.0–2.0 | 1.0–2.5 | 816 | $4,000 | $4.90 | 7d | 4 | 0.04mi |
| 5704 E Aire Libre Ave Scottsdale, AZ | 2.0 | 2.5 | 1088 | $4,000 | $3.68 | 45d | 1 | 0.04mi |
| 16636 N 58th St Scottsdale, AZ | 1.0–3.0 | 1.0–2.0 | 921 | $1,692 | $1.84 | 1d | 29 | 0.08mi |
| 5624 E Kelton Ln Scottsdale, AZ | 3.0 | 3.0 | 1375 | $2,425 | $1.76 | 26d | 1 | 0.08mi |
| 5635 E Bell Rd Scottsdale, AZ | 1.0 | 1.0 | 750 | $1,534 | $2.05 | 6d | 1 | 0.17mi |
| 5704 E Aire Libre Ave #1242 Scottsdale, AZ | 2.0 | 2.0 | 1088 | $1,750 | $1.61 | 18d | 1 | 0.21mi |
| 5704 E Aire Libre Ave #1242 Scottsdale, AZ | 2.0 | 2.5 | 1088 | $1,900 | $1.75 | 26d | 1 | 0.21mi |
| 16818 N 56th St Scottsdale, AZ | 2.0 | 2.0 | 1100 | $1,645 | $1.50 | 5d | 2 | 0.25mi |
| 16653 N 59th St Scottsdale, AZ | 3.0 | 2.0 | 1287 | $3,800 | $2.95 | 26d | 1 | 0.26mi |
| 5924 E Aire Libre Ln Scottsdale, AZ | 3.0 | 2.0 | 1498 | $3,795 | $2.53 | 14d | 1 | 0.28mi |
| 5640 E Bell Rd Scottsdale, AZ | 2.0 | 2.0–2.5 | 1293 | $2,875 | $2.22 | 14d | 2 | 0.34mi |
| 5640 E Bell Rd Scottsdale, AZ | 2.0 | 2.0–2.5 | 1293 | $2,875 | $2.22 | 16d | 2 | 0.34mi |
| 5640 E Bell Rd #1010 Scottsdale, AZ | 2.0 | 2.5 | 1268 | $3,500 | $2.76 | 15d | 1 | 0.34mi |
| 16801 N 49th St Scottsdale, AZ | 1.0–2.0 | 1.0–2.0 | 850 | $1,850 | $2.18 | 0d | 8 | 0.95mi |
| 6444 E Sandra Ter Scottsdale, AZ | 3.0 | 2.0 | 1376 | $5,500 | $4.00 | 45d | 1 | 0.99mi |
| 17030 N 49th St Scottsdale, AZ | 1.0–3.0 | 1.0–2.0 | 944 | $1,812 | $1.92 | 4d | 7 | 1.01mi |
| 4901 E Kelton Ln Scottsdale, AZ | 1.0–3.0 | 1.0–2.0 | 1142 | $2,250 | $1.97 | 0d | 3 | 1.06mi |
| 4901 E Kelton Ln Scottsdale, AZ | 1.0–3.0 | 1.0–2.5 | 872 | $2,175 | $2.49 | 26d | 7 | 1.06mi |
| 4901 E Kelton Ln Scottsdale, AZ | 1.0–3.0 | 1.0–2.5 | 870 | $2,148 | $2.47 | 4d | 5 | 1.06mi |
| 6533 E Grandview Dr Scottsdale, AZ | 3.0 | 2.0 | 1390 | $4,000 | $2.88 | 45d | 1 | 1.10mi |
| 4901 E Kelton Ln #1033 Scottsdale, AZ | 2.0 | 1.5 | 1088 | $3,500 | $3.22 | 45d | 1 | 1.12mi |
| 4722 E Bell Rd Phoenix, AZ | 1.0–2.0 | 1.0 | 664 | $1,657 | $2.50 | 0d | 43 | 1.25mi |
| 15425 N Tatum Blvd Unit 246 Phoenix, AZ | 1.0 | 1.0 | 749 | $1,089 | $1.45 | 26d | 1 | 1.27mi |
| 4637 E Hartford Ave Phoenix, AZ | 3.0 | 2.0 | 1301 | $2,525 | $1.94 | 0d | 1 | 1.39mi |
| 15221 N Clubgate Dr Scottsdale, AZ | 2.0–3.0 | 2.0 | 1577 | $2,600 | $1.65 | 20d | 4 | 1.42mi |
| 15221 N Clubgate Dr Scottsdale, AZ | 2.0–3.0 | 2.0 | 1546 | $4,450 | $2.88 | 45d | 2 | 1.42mi |
| 6830 E Paradise Ln Scottsdale, AZ | 3.0 | 2.0 | 1428 | $3,200 | $2.24 | 4d | 1 | 1.47mi |
HOA detail condo
- Monthly dues
- $289 · $3,468/yr
- Likely covers
- landscapingpool
- Assessments
- None detected in remarks — confirm with the listing agent.
Listing history 37 events
-
2026-06-21days on market $310,000 Active 45 DOM
-
2026-06-18days on market $310,000 Active 42 DOM
-
2026-06-17days on market $310,000 Active 41 DOM
-
2026-06-16days on market $310,000 Active 40 DOM
-
2026-06-15days on market $310,000 Active 39 DOM
-
2026-06-13days on market $310,000 Active 37 DOM
-
2026-06-13days on market $310,000 Active 36 DOM
-
2026-06-09days on market $310,000 Active 33 DOM
-
2026-06-08days on market $310,000 Active 32 DOM
-
2026-06-07days on market $310,000 Active 31 DOM
-
2026-06-04days on market $310,000 Active 28 DOM
-
2026-06-03days on market $310,000 Active 27 DOM
-
2026-06-02days on market $310,000 Active 26 DOM
-
2026-06-01days on market $310,000 Active 25 DOM
-
2026-05-31price $310,000 Active 24 DOM
-
2026-05-31days on market $315,000 Active 24 DOM
-
2026-05-07$315,000 Active 780-char remark
Show marketing remark (780 chars)
Charming 2-bedroom, 2.5-bath townhome in a desirable North Scottsdale community! This light-filled home features wood and tile flooring throughout and vaulted ceilings in both bedrooms that create an open, airy feel. Each spacious bedroom includes its own private ensuite bath. The inviting living area offers a cozy fireplace and flows into a bright kitchen with ample cabinetry, dining space, and natural light. A convenient in-unit stacked washer and dryer and half bath complete the main level. Step outside to a private north-facing patio--perfect for relaxing or weekend BBQs. The community features a large resort-style pool with cabanas and well-maintained grounds. Prime location near Loop 101, SR-51, shopping, dining, golf, and everything North Scottsdale has to offer!
-
2025-03-31historical $1,795
-
2025-03-23price $1,795
-
2025-03-11$1,845
-
2014-05-10soldstatus $130,000 Closed 114-char remark
Show marketing remark (114 chars)
Great Investment Oppertunity! NOT A SHORT SALE OR BANK OWNED! Priced Way BELOW Comps! Property is in Great Shape!!
-
2014-05-09historical
-
2014-05-09soldstatus $130,000
-
2014-04-17status Pending 114-char remark
Show marketing remark (114 chars)
Great Investment Oppertunity! NOT A SHORT SALE OR BANK OWNED! Priced Way BELOW Comps! Property is in Great Shape!!
-
2014-04-11$139,900 Active 114-char remark
Show marketing remark (114 chars)
Great Investment Oppertunity! NOT A SHORT SALE OR BANK OWNED! Priced Way BELOW Comps! Property is in Great Shape!!
-
2013-12-21status Pending
-
2013-10-31price $139,000 Active
-
2013-10-31status Active
-
2013-08-15historical
-
2013-08-09$100,900
-
2006-10-17soldstatus $200,000
-
2006-10-17soldstatus $200,000
-
2006-09-27historical
-
2006-04-13historical
-
2006-04-12$249,000
-
2006-04-11$219,000
-
1985-05-30soldstatus $70,356
ⓘ Source: listings_history table (triggers on properties + properties_extension) + one-shot
backfill from property_details.listing_events for pre-trigger history.
Tax reassessment forecast AZ · Resets to sale price
- Current annual tax
- $1,298 · $108/mo
- Projected year-2 tax
- $2,046 · $170/mo
- Expected delta
- +$748/yr (+$62/mo · 57.6%)
ⓘ Screening estimate from a state-policy table — verify with the county assessor before closing.
Climate risk First Street
- Flood 1/10 Low FEMA zone X (shaded) · 0% chance over 30 yrs
- Wildfire 4/10 Moderate
- Heat 8/10 Severe 5 d/yr ≥111°F today · 14 d/yr by 30 yrs out
- Wind 1/10 Low
- Air quality 3/10 Moderate 2 unhealthy d/yr today · 3 by 30 yrs out
Nearby sold comps map
Loading sold comps map…
Walkable amenities ~0.75 mi
Loading nearby amenities…
Taxation est. · year 1
- Rental income
- $31,252
- − Mortgage interest
- −$17,365
- − Property taxes
- −$1,298
- − Insurance
- −$1,550
- − Repairs & maintenance
- −$2,500
- − Management
- −$2,500
- − HOA
- −$3,468
- − Depreciation
- −$9,018
- Taxable loss
- −$6,447
- Est. tax savings @ 24.0%
- +$1,547
- After-tax cash flow
- $412/yr
For passive investors: Depreciation is non-cash, so a rental often shows a tax loss while cash-flowing — sheltering income. Rental losses are passive: they offset passive income freely, and up to $25,000/yr can offset ordinary (W-2) income if you actively participate and your MAGI is under $100k (phasing out to $0 by $150k); unused losses carry forward. On sale, claimed depreciation is recaptured at up to 25%, and gains may owe capital-gains tax (a 1031 exchange can defer both). Figures are a year-1 estimate at your 24.0% rate — not tax advice; consult a CPA.
Schools (NCES district)
- District
- Paradise Valley Unified District (4241)
- NCES district ID
- 0405930
- Math proficiency
- 39% ▼ -11.00%
- Reading proficiency
- 46% ▼ -7.00%
- Median HH income
- $64,106
- Composite
- 37.89/100
- National rank
- #4316
- State rank
- #56 of 249 in AZ
Livability — Phoenix
- Score
- 75/100
- State rank
- #16
- US rank
- #3924
Category grades
Schools grade is shown separately in the Schools card above.
Census & demographics
- Census place
- Phoenix, AZ
- County
- Maricopa County · 4,537,380 people
- City population
- 1,500,198
- Metro
- Phoenix-Mesa-Chandler, AZ
- Population (ZIP)
- 45,558
- Household income
- $123,203
- Rent vs Own
- Severe rent burden
- 1263.0
Population outlook (Maricopa County) Hauer SSP2
- Today (2025)
- 4,979,203 people
- By 2030
- 5,378,229 · +8.0%
- By 2040
- 6,156,598 · +23.6%
- By 2050
- 6,872,376 · +38.0%
- By 2075
- 8,401,270 · +68.7%
- By 2100
- 9,247,439 · +85.7%
Race, ethnicity, and origin ACS 2023
- Neighborhood character
- Predominantly White (76%)
- Race & ethnicity
- White 76% Asian 9% Hispanic / Latino 9% Two or more races 8%
- Hispanic origin (detail)
- Mexican 5%
- Common ancestry
- Romanian 4% Italian 4% Slovak 3%
- Foreign-born
- 14% · Canada, Vietnam, China
- Languages at home
- 85% English-only · Other Indo-European 6% Spanish 3% Other Asian/Pacific 3%
Political lean MEDSL · Maricopa
- 2024 margin
- Toss-up / Even · D 47.7% · R 51.2% · Other 1.1%
- 2008→2024 swing
- +7.1pp toward D · 2008: -10.6pp · 2024: -3.5pp
- All cycles
- 2024: R+3.5 2020: D+2.2 2016: R+3.5 2012: R+12.0 2008: R+10.6
Not yet ingested
- Civics
- —
Market trends
- HPI YoY
- ▼ -544.56%
- Current HPI
- 398.7261
- Rent YoY
- ▲ 3.42%
- Metro
- Phoenix-Mesa-Chandler, AZ
- State GDP YoY
- ▲ 4.54%
- F500 in state
- 20
Industry mix (Fortune 500 HQ in AZ)
| Industry | F500 HQs | Revenue |
|---|---|---|
| Technology | 2 | $13B |
|
||
| Mining / Metals | 1 | $23B |
|
||
| Environmental Services | 1 | $16B |
|
||
| Metals / Steel | 1 | $14B |
|
||
| Technology Distribution | 1 | $9B |
|
||
| Homebuilding | 1 | $8B |
|
||
Price history
+347.7% since first listed21 events — show timeline
- 2026-05-07 Listed $315,000 ARMLS
- 2025-03-31 Rental Removed $1,795 APPFOLIO
- 2025-03-23 Price Changed $1,795 APPFOLIO
- 2025-03-11 Listed for Rent $1,845 APPFOLIO
- 2014-05-10 Sold (MLS) $130,000 ARMLS
- 2014-05-09 Listing Removed — ARMLS
- 2014-05-09 Sold (Public Records) $130,000 Public Records
- 2014-04-17 Pending — ARMLS
- 2014-04-11 Listed $139,900 ARMLS
- 2013-12-21 Pending — ARMLS
- 2013-10-31 Relisted — ARMLS
- 2013-10-31 Price Changed $139,000 ARMLS
- 2013-08-15 Listing Removed — ARMLS
- 2013-08-09 Listed $100,900 ARMLS
- 2006-10-17 Sold (Public Records) $200,000 Public Records
- 2006-10-17 Sold (MLS) $200,000 ARMLS
- 2006-09-27 Listing Removed — ARMLS
- 2006-04-13 Listing Removed — ARMLS
- 2006-04-12 Listed $249,000 ARMLS
- 2006-04-11 Listed $219,000 ARMLS
- 1985-05-30 Sold (Public Records) $70,356 Public Records
Property tax history
+0.6%/yrLatest (2025): $1,298 · +2.7% YoY. Source: county tax records.
Cash-flow waterfall
monthlySold comps — $/sqft
last 12 mo · ≤1 miLoading sold comps…