 Multi-family
1614-1618 Balboa St · San Francisco, CA
Flood risk No data
- FEMA flood zone
- —
- Chance of flooding over 30 yrs
- —
- Est. flood insurance / yr
- —
Fire risk No data
- Est. fire insurance / yr
- —
Heat risk No data
- Hot days now (above threshold)
- —
- Hot days in 30 yrs
- —
Wind risk No data
- Chance of severe wind over 30 yrs
- —
Air-quality risk No data
- Unhealthy air days now
- —
- Unhealthy air days in 30 yrs
- —
Risk factors via First Street. Map © Google.
Why this score? — see what drove the B- grade
The composite is a weighted blend of 9 inputs, each scored 0–100. Each bar is that input's sub-score; the figure is the points it added to the 100-point composite (weight × sub-score).
- Cash flow +21.2/30.0
- ARV discount +15.0/15.0
- DSCR +6.8/10.0
- 1% rule +5.6/10.0
- Rent growth +5.0/5.0
- Schools +5.0/10.0
- Livability +3.8/5.0
- Condition / age +3.8/5.0
- Appreciation +0.0/10.0
$1,498,000
🖨 Deal sheet (PDF) 📄 Offer letter ✓ Due diligence
Multi-family units
County records classify this as Multi-Family (2-4 Unit). Listing-text estimate: 1 unit. estimate disagrees with records
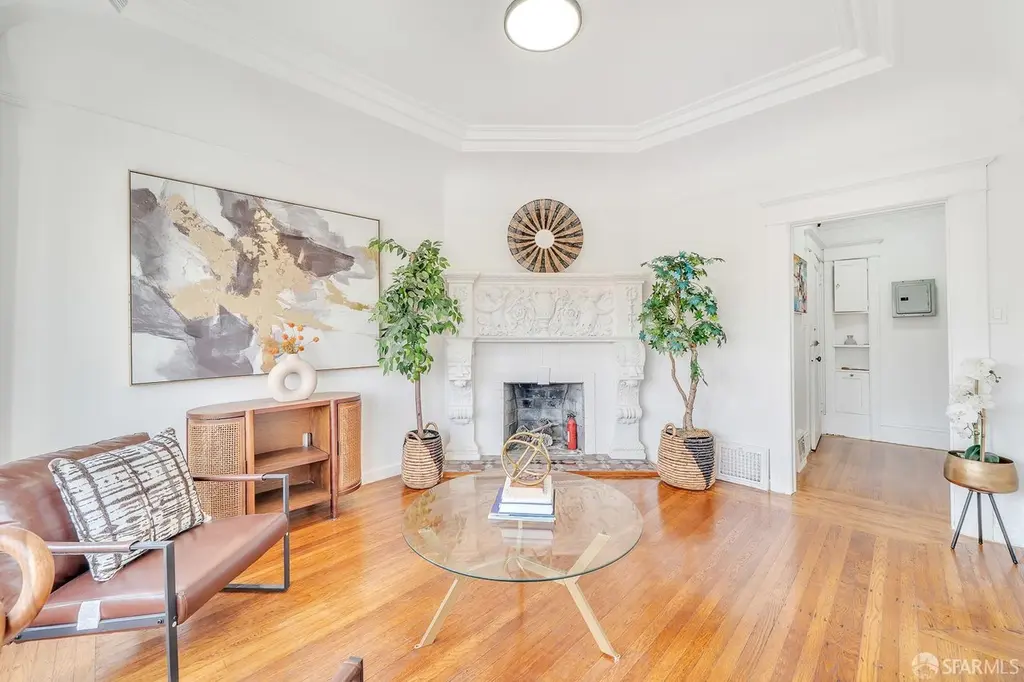
Listing remarks
Rare mixed-use opportunity in a prime San Francisco location at 1614-1618 Balboa St. Ideally situated near Golden Gate Park and close to public transportation, this versatile property offers the perfect blend of convenience, flexibility, and city living. The ground floor features two commercial units, while the 2nd and 3rd floors offer residential living space, creating an ideal setup for owner-users, entrepreneurs, or investors seeking a live/work opportunity. The entire property is vacant, offering immediate occupancy and exceptional potential for both business and residential use. Recent improvements include a new roof, new central heating system, new interior paint, new exterior paint,
Key facts
- Two commercial units
- Immediate occupancy
- 2,495 sq ft lot
Tags
Property features AI
Finance
- Other: Total living/building area approximately 3263 (source: assessor)
- Financial info: Four units total with four currently vacant
- HOA & community: No association fee
Exterior
- Home design: Quadruplex mixed-use property (residential income); Built in 1922
- Construction: 1922 construction
- Exterior features: Curbs and gutters; Sidewalk
Interior
- Bedrooms: Five bedrooms total across residential units
- Bathrooms: Two full bathrooms; Two commercial units each include a half bath
- Interior features: Mixed-use residential income property with commercial storefronts; Four total units (two residential flats and two commercial storefronts); Units furnished: Varies by unit
Neighborhood map
What this means for you Summary
Snapshot
- This is a 5-bed/2.0-bath multifamily listed at $1.50M. Condition is rated good.
Deal economics
- At list price, monthly cash flow is $2k ($26k/yr) — positive.
- The deal already cash-flows at list — no discount required.
- Meets the 1% rule at list price ($16k rent vs $1.50M).
- Recommended offer: $1.48M (1.5% below list) — sets the bar for market timing.
- Cap rate 8.0% vs local median 2.1% in San Francisco — top-decile yield for the area; either an underpriced asset or a hidden risk that comps aren't pricing in. Stress-test before assuming the spread holds.
Location & tenants
- Location reads 76/100 on livability (#90 in CA, #3,143 nationally) — a middle-class / working-renter tenant base. Strengths: amenities A+, commute A+, employment A+; Watch: crime F, cost of living F.
- San Francisco Unified (urban): math 50% / reading 56% proficiency, ranked #322 of 1,400 in CA (top 23%) — acceptable for families but not a draw, mixed tenant base, ~2y average lease.
- Market conditions: Rents rising fast (+13.0%/yr); 74 active listings in the ZIP; 1 comparable units currently listed for rent nearby; high-income renter base; 750 units permitted in San Francisco County in 2024 (688 in 5+ unit buildings).
- At $15,860/mo this rent would consume 143% of the median local household income ($133k/yr) (locally 2072% of renters already pay >50% of income on rent) — very limited rent-growth headroom before tenants either downsize or default.
Forward outlook
- Local home prices are declining (-3.0%/yr); year-one equity from $10k of loan paydown is wiped out by about $45k of value loss. Plan a longer hold.
- San Francisco County population projected at +39% by 2050 — long-run rental-demand tailwind backs the buy-and-hold thesis.
- At projected returns (-3.0% appreciation + 8.0% rent growth), your $419k cash investment doubles in ~9 years — after that, you're playing with house money.
Negotiation context
- It's been on market 29 days — a 2% lower offer ($1.48M) is reasonable based on typical stale-listing flexibility.
- 5 sale attempts since 2y ago; this cycle's ask is 900% above the opening price — seller raised mid-cycle; expect resistance to lowballs.
Risks & watch-outs
- Watch-outs: built in 1922 — expect roof / HVAC / electrical / plumbing capex.
Questions for the listing agent
- Built in 1922 — when were the roof, HVAC, electrical panel, plumbing, and water heater last replaced?
- Is there a deadline driving the sale (1031 exchange, divorce, estate, relocation)? That informs how much negotiation room exists.
- Schools are B-rated — typically a magnet for longer-tenancy family renters. What's the average tenant stay here, and is there a school-zone premium baked into asking?
- Crime grade is F in this area — have there been break-ins, vandalism, or insurance claims at this property in the last 3 years? What carrier currently insures it and at what premium?
- What's the average days-on-market for RENTAL listings here right now (not sales)? A rising rental-DOM trend means longer vacancies and softer asking-rent achievability than the comps imply.
- What's the recent tenant-quality profile in this submarket — average credit score on applications, eviction rate, late-payment / NSF rate, and stable-employment percentage? A property-management company in the area should have these aggregated.
- How much new apartment / multifamily construction is in the pipeline within 1–3 miles? Heavy new supply (>2% of stock underway) typically softens rents 12–24 months out; light construction supports rent growth.
Investment metrics
- 1% rule
- 1.06% ✓
- Cap rate
- 8.04%
- Cash-on-cash
- 6.23%
- DSCR
- 1.28
- GRM
- 7.9
CMA / ARV
- ARV (on-the-fly)
- $2,153,580
- Comps found
- 12
Show comp detail 12 sales within ~0.75 mi
| Address | Dist | Beds/Ba | Sqft | Sold | Price | $/sf | Match |
|---|---|---|---|---|---|---|---|
| 1614-1618 Balboa St | 0.00mi | 5/2.0 | 3,263 (0%) | 1mo | $1,600,000 | $490 | 99 |
| 563-565 20th Ave | 0.17mi | 4/2.0 (-1) | 3,210 (-2%) | 3mo | $1,300,000 | $405 | 82 |
| 171 23rd Ave | 0.65mi | 5/2.0 | 3,220 (-1%) | 3mo | $2,125,000 | $660 | 65 |
| 874 27th Ave | 0.60mi | 4/2.0 (-1) | 3,290 (+1%) | 2mo | $2,600,000 | $790 | 64 |
| 814-816 25th Ave | 0.47mi | 4/2.0 (-1) | 3,100 (-5%) | 3mo | $2,120,000 | $684 | 63 |
| 1721 Clement St | 0.37mi | 5/4.0 | 3,010 (-8%) | 2mo | $1,700,000 | $565 | 61 |
| 167-169 11th Ave | 0.66mi | 5/2.0 | 3,098 (-5%) | 2mo | $2,910,000 | $939 | 59 |
| 779-781 24th Ave | 0.42mi | 4/2.0 (-1) | 3,600 (+10%) | 2mo | $2,100,000 | $583 | 56 |
| 1714-1718 Anza St | 0.55mi | 5/3.0 | 3,572 (+10%) | 1mo | $2,505,000 | $701 | 54 |
| 119-121 16th Ave | 0.61mi | 4/2.0 (-1) | 3,011 (-8%) | 2mo | $2,800,000 | $930 | 52 |
| 674 10th Ave | 0.47mi | 4/2.0 (-1) | 2,800 (-14%) | 2mo | $1,038,000 | $371 | 48 |
| 326 11th Ave | 0.52mi | 4/4.0 (-1) | 3,580 (+10%) | 2mo | $1,825,000 | $510 | 45 |
Match score weights: distance 35% · size 25% · config 20% · recency 20%. Top-matched comps best support the ARV.
Projected returns pro-forma
-3.0% appreciation · 8.0% rent growth · sell at horizon
- IRR
- -1.2%
- Equity multiple
- 0.95×
- Total profit
- $-20,027
- Equity at exit
- $223,357
- IRR
- 13.2%
- Equity multiple
- 2.30×
- Total profit
- $543,561
- Equity at exit
- $129,520
Cash invested: $419,440 (down + closing). Projections, not guarantees.
Landlord ↔ Tenant lean methodology
- Overall (CITY)
- 0 Strongly Tenant-Friendly
- State California
- 18 Strongly Tenant-Friendly · D+13
- County
- — inherits STATE
- City San Francisco
- 0 Strongly Tenant-Friendly · D+57
ZIP-level market 94121
- Rents YoY
- 13.0%
- Active inventory
- 74
- Price-to-rent
- 23.6×
Monthly cashflow live
- Estimated rent
- $15,860 high interval (Pro) →
- Mortgage (P&I)
- −$7,856
- Tax est. 1.5%
- −$1,872 /mo · $22,470/yr
- Insurance
- −$624
- HOA
- −$0
- Vacancy / Maint / Mgmt
- −$3,331
- Net cashflow
- $2,177
Break-even live
Sensitivity live
| Price | -10% $3,212 | -5% $2,695 | +0% $2,177 | +5% $1,659 | +10% $1,142 |
|---|---|---|---|---|---|
| Rent | -10% $924 | -5% $1,551 | +0% $2,177 | +5% $2,804 | +10% $3,430 |
| Rate | -1.0pp $2,931 | -0.5pp $2,558 | base $2,177 | +0.5pp $1,789 | +1.0pp $1,394 |
3-unit breakdown (identical units grouped — click to expand)
| Units | Beds | Baths | Est. rent |
|---|---|---|---|
| 3× units | 2 | 1.5 | $15,861 |
| #1 | 2 | 1.5 | $5,287 |
| #2 | 2 | 1.5 | $5,287 |
| #3 | 2 | 1.5 | $5,287 |
| Total (3 units) | $15,860 | ||
UW: 25.0% down · 7.5% · 30yr · 1.5% tax · 5.0% vac · 8.0% maint · 8.0% mgmt
Financing live
Cash to close
- Down payment
- $374,500
- Closing costs
- $44,940
- Reserves months
- —
- Total cash needed
- —
Loan-product check · same deal, 3 products live
Conventional
25% down · 7.5% · 30yr
- Down + closing
- —
- Monthly P&I
- —
- Monthly cashflow
- —
- DSCR
- —
- Eligible?
- —
Personal DTI + credit; lowest rate.
DSCR
20% down · 8.5% · 30yr
- Down + closing
- —
- Monthly P&I
- —
- Monthly cashflow
- —
- DSCR
- —
- Eligible?
- —
No personal income docs; deal must DSCR.
Hard money
10% down · 12.0% · 12mo
- Down + closing
- —
- Monthly P&I
- —
- Monthly cashflow
- —
- DSCR
- —
- Eligible?
- —
Short-term bridge; refi at stabilization.
Rent comps 1 comps
| Address | Beds | Baths | Sqft | Rent | $/sqft | DOM | Units | Dist |
|---|---|---|---|---|---|---|---|---|
| 806 35th Ave San Francisco, CA | 5.0 | 3.0 | 2296 | $13,995 | $6.10 | 3d | 1 | 1.05mi |
Listing history 9 events
-
2026-04-26status Pending
-
2026-03-27price $1,498,000
-
2026-03-27$149,800 Active
-
2025-08-06$1,500,000 Active
-
2025-02-16status Active
-
2025-01-29status Pending
-
2025-01-22price $1,500,000
-
2025-01-09status Active
-
2024-09-19$1,650,000 Active
ⓘ Source: listings_history table (triggers on properties + properties_extension) + one-shot
backfill from property_details.listing_events for pre-trigger history.
Nearby sold comps map
Loading sold comps map…
Walkable amenities ~0.75 mi
Loading nearby amenities…
Taxation est. · year 1
- Rental income
- $190,320
- − Mortgage interest
- −$83,911
- − Property taxes
- −$22,470
- − Insurance
- −$7,490
- − Repairs & maintenance
- −$15,226
- − Management
- −$15,226
- − Depreciation
- −$43,578
- Taxable income
- $2,419
- Est. tax owed @ 24.0%
- −$581
- After-tax cash flow
- $25,544/yr
For passive investors: Depreciation is non-cash, so a rental often shows a tax loss while cash-flowing — sheltering income. Rental losses are passive: they offset passive income freely, and up to $25,000/yr can offset ordinary (W-2) income if you actively participate and your MAGI is under $100k (phasing out to $0 by $150k); unused losses carry forward. On sale, claimed depreciation is recaptured at up to 25%, and gains may owe capital-gains tax (a 1031 exchange can defer both). Figures are a year-1 estimate at your 24.0% rate — not tax advice; consult a CPA.
Condition & rehab AI · 2 photos
This multi-family property in San Francisco is in good condition with recent improvements. It offers a prime location and versatile use, making it an attractive investment opportunity.
Value-add opportunities
- Both Painting the exterior and interior walls — Fresh paint enhances curb appeal and interior aesthetics.
- Both Updating the kitchen and bathrooms — Modernizing these spaces can attract more buyers and renters.
- Both Landscaping the front yard — A well-maintained front yard improves curb appeal and adds value to the property.
Renovation cost estimate screening
Value-add ROI direction
- Both Painting the exterior and interior walls — Fresh paint enhances curb appeal and interior aesthetics. ↑
- Both Updating the kitchen and bathrooms — Modernizing these spaces can attract more buyers and renters. ↑
- Both Landscaping the front yard — A well-maintained front yard improves curb appeal and adds value to the property. ↑
ⓘ Cost ranges are severity-bucket heuristics (US national rule-of-thumb). Get contractor quotes + a written scope before underwriting a rehab budget.
Schools (NCES district)
- District
- San Francisco Unified
- NCES district ID
- 0634410
- Math proficiency
- 50% ▬ 0.00%
- Reading proficiency
- 56% ▲ 1.00%
- Median HH income
- $81,249
- Composite
- 50.14/100
- National rank
- #4088
- State rank
- #322 of 1400 in CA
Livability — San Francisco
- Score
- 76/100
- State rank
- #90
- US rank
- #3143
Category grades
Schools grade is shown separately in the Schools card above.
Census & demographics
- Census place
- San Francisco, CA
- County
- San Francisco County · 827,552 people
- City population
- 827,552
- Metro
- San Francisco-Oakland-Berkeley, CA
- Population (ZIP)
- 41,995
- Household income
- $133,358
- Rent vs Own
- Severe rent burden
- 2072.0
Population outlook (San Francisco County) Hauer SSP2
- Today (2025)
- 1,030,936 people
- By 2030
- 1,110,409 · +7.7%
- By 2040
- 1,270,010 · +23.2%
- By 2050
- 1,435,001 · +39.2%
- By 2075
- 1,779,074 · +72.6%
- By 2100
- 1,966,767 · +90.8%
Race, ethnicity, and origin ACS 2023
- Neighborhood character
- Diverse neighborhood (Simpson 0.65)
- Race & ethnicity
- Asian 42% White 41% Two or more races 10% Hispanic / Latino 8% Black 2%
- Hispanic origin (detail)
- Mexican 4%
- Common ancestry
- Scotch-Irish 3% Lithuanian 2% Romanian 2%
- Foreign-born
- 35% · China, Canada, Vietnam
- Languages at home
- 59% English-only · Chinese 22% Russian/Polish/Slavic 4% Spanish 4%
Political lean MEDSL · San Francisco
- 2024 margin
- Solid D (+64.8) · D 80.3% · R 15.5% · Other 4.1%
- 2008→2024 swing
- -5.7pp toward R · 2008: 70.5pp · 2024: 64.8pp
- All cycles
- 2024: D+64.8 2020: D+72.5 2016: D+76.1 2012: D+70.2 2008: D+70.5
Not yet ingested
- Civics
- —
Market trends
- HPI YoY
- ▼ -1078.57%
- Current HPI
- 266.5786
- Rent YoY
- ▲ 13.03%
- Metro
- San Francisco-Oakland-Berkeley, CA
- State GDP YoY
- ▲ 3.21%
- F500 in state
- 116
Industry mix (Fortune 500 HQ in CA)
| Industry | F500 HQs | Revenue |
|---|---|---|
| Technology | 27 | $1,492B |
|
||
| Financial Services | 3 | $174B |
|
||
| Retail | 3 | $44B |
|
||
| Insurance | 3 | $26B |
|
||
| Media / Entertainment | 2 | $115B |
|
||
| Pharmaceuticals / Biotech | 2 | $62B |
|
||
Price history
-9.2% since first listed9 events — show timeline
- 2026-04-26 Pending — San Francisco MLS
- 2026-03-27 Price Changed $1,498,000 San Francisco MLS
- 2026-03-27 Listed $149,800 San Francisco MLS
- 2025-08-06 Listed $1,500,000 San Francisco MLS
- 2025-02-16 Relisted — San Francisco MLS
- 2025-01-29 Pending — San Francisco MLS
- 2025-01-22 Price Changed $1,500,000 San Francisco MLS
- 2025-01-09 Relisted — San Francisco MLS
- 2024-09-19 Listed $1,650,000 San Francisco MLS
Cash-flow waterfall
monthlySold comps — $/sqft
last 12 mo · ≤1 miLoading sold comps…