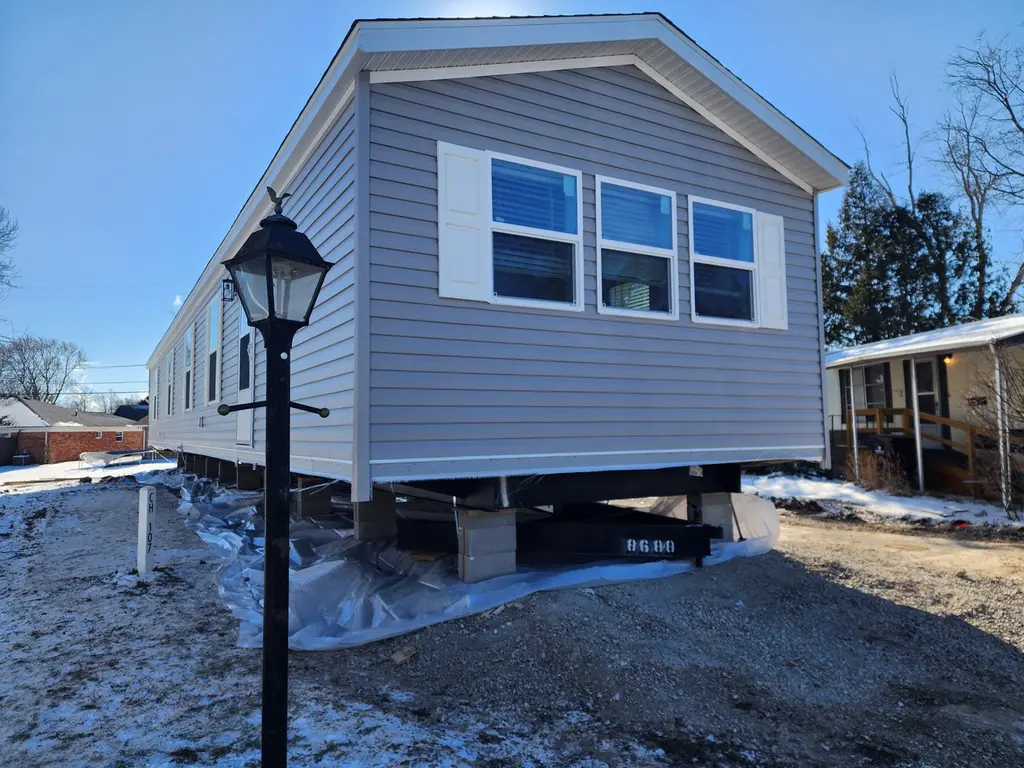
107 Charwood Unit CH107 · Lima, OH
Flood risk 1/10 · Minimal
- FEMA flood zone
- X (unshaded)
- Chance of flooding over 30 yrs
- 0.0%
- Est. flood insurance / yr
- $507 – $1,088
Fire risk 1/10 · Minimal
- Est. fire insurance / yr
- $713 – $1,323
Heat risk 3/10 · Minor
- Hot days now (above 100°F)
- 6 days/yr
- Hot days in 30 yrs
- 16 days/yr
Wind risk 2/10 · Minimal
- Chance of severe wind over 30 yrs
- —
Air-quality risk 2/10 · Minimal
- Unhealthy air days now
- 1 days/yr
- Unhealthy air days in 30 yrs
- 2 days/yr
Risk factors via First Street. Map © Google.
Why this score? — see what drove the B- grade
The composite is a weighted blend of 9 inputs, each scored 0–100. Each bar is that input's sub-score; the figure is the points it added to the 100-point composite (weight × sub-score).
- Cash flow +30.0/30.0
- 1% rule +10.0/10.0
- DSCR +10.0/10.0
- ARV discount +7.5/15.0
- Condition / age +4.0/5.0
- Livability +3.2/5.0
- Schools +2.6/10.0
- Rent growth +2.5/5.0
- Appreciation +0.0/10.0
$49,400
🖨 Deal sheet 📄 Offer letter ✓ Due diligence
Listing remarks MLS
Your brand new 3 bedroom, 2 bathroom home is waiting for you to move in! This comfortable home features premium entry doors, a modern bathroom, as well as new brand name appliances. In the community, enjoy with your friends and family all the amenities we have to offer such as community events, , and . This home won't be on the market long, so call us today for more information or to schedule a tour. Deposits & Fees are subject to change.
Key facts
- Built 2026
- Listed 76 days
Neighborhood map
What this means for you Summary
Snapshot
- This is a 3-bed/2.0-bath manufactured listed at $49k. Condition is rated good.
Deal economics
- At list price, monthly cash flow is $868 ($10k/yr) — positive.
- The deal already cash-flows at list — no discount required.
- Meets the 1% rule at list price ($2k rent vs $49k).
- Recommended offer: $46k (6.0% below list) — sets the bar for market timing.
- Cap rate 27.4% vs local median 7.7% in Lima — top-decile yield for the area; either an underpriced asset or a hidden risk that comps aren't pricing in. Stress-test before assuming the spread holds.
Location & tenants
- Location reads 64/100 on livability (#787 in OH) — a middle-class / working-renter tenant base. Strengths: cost of living A+, housing A+, health & safety A-; Watch: crime F, amenities F, commute F.
- Lima City (urban): math 29% / reading 36% proficiency, ranked #575 of 656 in OH (top 88%) — families likely to look elsewhere, expect single-tenant / working-renter base with shorter leases; 83% free/reduced lunch — lower-income household profile, screen leases tightly.
- Market conditions: 105 active listings in the ZIP; 5 comparable units currently listed for rent nearby; rentals lingering (median 44d on market — plan ~5-8 weeks vacancy on turnover, expect pricing pressure); 100% of comp listings sitting > 30 days — soft ceiling on asking rent; 88 units permitted in Allen County in 2024 (0 in 5+ unit buildings).
Forward outlook
- Local home prices are declining (-3.0%/yr); year-one equity from $342 of loan paydown is wiped out by about $1k of value loss. Plan a longer hold.
- Allen County population projected at -14% by 2050 — secular population decline; favor cash flow + early exit over multi-decade hold.
- At projected returns (-3.0% appreciation + 3.0% rent growth), your $14k cash investment doubles in ~2 years — after that, you're playing with house money.
Negotiation context
- It's been on market 77 days — a 6% lower offer ($46k) is reasonable based on typical stale-listing flexibility.
Questions for the listing agent
- It's been on market 77 days. Have you received any prior offers? Is the seller open to a 6% concession, seller financing, or rate buy-down credit?
- Why hasn't it sold? Are there any deal-killer items the seller is aware of (foundation, flood, title, zoning, code violations)?
- Is there a deadline driving the sale (1031 exchange, divorce, estate, relocation)? That informs how much negotiation room exists.
- Crime grade is F in this area — have there been break-ins, vandalism, or insurance claims at this property in the last 3 years? What carrier currently insures it and at what premium?
- What's the average days-on-market for RENTAL listings here right now (not sales)? A rising rental-DOM trend means longer vacancies and softer asking-rent achievability than the comps imply.
- What's the recent tenant-quality profile in this submarket — average credit score on applications, eviction rate, late-payment / NSF rate, and stable-employment percentage? A property-management company in the area should have these aggregated.
- How much new for-sale + rental construction is in the pipeline within 1–3 miles? Heavy new supply typically softens prices + rents 12–24 months out; constrained supply supports both.
Investment metrics
- 1% rule
- 3.10% ✓
- Cap rate
- 27.38%
- Cash-on-cash
- 75.31%
- DSCR
- 4.35
- GRM
- 2.7
CMA / ARV
- ARV (median comp)
- $27,278
- List price
- $49,400
- Delta
- 81.10%
- Verdict
- OVERPRICED
- Comps
- 4 within 1.0 mi
Show comp detail 3 sales within ~0.75 mi
| Address | Dist | Beds/Ba | Sqft | Sold | Price | $/sf | Match |
|---|---|---|---|---|---|---|---|
| 105 Concord Pl | 0.06mi | 3/2.0 | 1,216 (0%) | 21mo | $58,900 | $48 | 80 |
| 102 Charwood Dr | 0.04mi | 3/1.5 | 1,344 (+10%) | 2mo | $29,900 | $22 | 77 |
| 1101 Russell Ave | 0.73mi | 2/1.0 (-1) | 1,080 (-11%) | 8mo | $54,200 | $50 | 31 |
Match score weights: distance 35% · size 25% · config 20% · recency 20%. Top-matched comps best support the ARV.
Projected returns pro-forma
-3.0% appreciation · 3.0% rent growth · sell at horizon
- IRR
- 75.2%
- Equity multiple
- 4.42×
- Total profit
- $47,303
- Equity at exit
- $7,366
- IRR
- 78.9%
- Equity multiple
- 9.13×
- Total profit
- $112,473
- Equity at exit
- $4,271
Cash invested: $13,832 (down + closing). Projections, not guarantees.
Landlord ↔ Tenant lean methodology
- Overall (STATE)
- 73 Landlord-Friendly
- State Ohio
- 73 Landlord-Friendly · R+6
- County
- — inherits STATE
- City
- — inherits STATE
ZIP-level market 45805
- Active inventory
- 105
- Price-to-rent
- 2.7×
Monthly cashflow live
- Estimated rent
- $1,531 high interval (Pro) →
- Mortgage (P&I)
- −$259
- Tax est. 1.5%
- −$62 /mo · $741/yr
- Insurance
- −$21
- HOA
- −$0
- Vacancy / Maint / Mgmt
- −$321
- Net cashflow
- $868
Break-even live
UW: 25.0% down · 7.5% · 30yr · 1.5% tax · 5.0% vac · 8.0% maint · 8.0% mgmt
Financing live
Cash to close
- Down payment
- $12,350
- Closing costs
- $1,482
- Reserves months
- —
- Total cash needed
- —
Loan-product check · same deal, 3 products live
Conventional
25% down · 7.5% · 30yr
- Down + closing
- —
- Monthly P&I
- —
- Monthly cashflow
- —
- DSCR
- —
- Eligible?
- —
Personal DTI + credit; lowest rate.
DSCR
20% down · 8.5% · 30yr
- Down + closing
- —
- Monthly P&I
- —
- Monthly cashflow
- —
- DSCR
- —
- Eligible?
- —
No personal income docs; deal must DSCR.
Hard money
10% down · 12.0% · 12mo
- Down + closing
- —
- Monthly P&I
- —
- Monthly cashflow
- —
- DSCR
- —
- Eligible?
- —
Short-term bridge; refi at stabilization.
Rent comps 5 comps
| Address | Beds | Baths | Sqft | Rent | $/sqft | DOM | Units | Dist |
|---|---|---|---|---|---|---|---|---|
| 405 N Kenilworth Ave Lima, OH | 3.0 | 1.0 | 1352 | $1,795 | $1.33 | 44d | 1 | 0.93mi |
| 1436 W High St Lima, OH | 2.0 | 1.0 | 1205 | $895 | $0.74 | 44d | 1 | 1.01mi |
| 1014 W Market St Apt 3 Lima, OH | 2.0 | 1.0 | 800 | $1,400 | $1.75 | 44d | 1 | 1.27mi |
| 420 N Baxter St Lima, OH | 3.0 | 2.0 | 1386 | $1,200 | $0.87 | 44d | 1 | 1.43mi |
| 608 S Primrose Pl Lima, OH | 3.0 | 2.0 | 1200 | $2,500 | $2.08 | 44d | 1 | 1.50mi |
Listing history 18 events
-
2026-06-19days on market $49,400 Active 77 DOM
-
2026-06-18days on market $49,400 Active 76 DOM
-
2026-06-17days on market $49,400 Active 75 DOM
-
2026-06-16days on market $49,400 Active 74 DOM
-
2026-06-15days on market $49,400 Active 73 DOM
-
2026-06-14days on market $49,400 Active 71 DOM
-
2026-06-12days on market $49,400 Active 70 DOM
-
2026-06-09days on market $49,400 Active 67 DOM
-
2026-06-08days on market $49,400 Active 66 DOM
-
2026-06-07days on market $49,400 Active 65 DOM
-
2026-06-07days on market $49,400 Active 64 DOM
-
2026-06-04days on market $49,400 Active 61 DOM
-
2026-06-02days on market $49,400 Active 60 DOM
-
2026-06-01price $49,400 Active 59 DOM
-
2026-06-01days on market $48,900 Active 59 DOM
-
2026-05-31days on market $48,900 Active 58 DOM
-
2026-05-31days on market $48,900 Active 57 DOM
-
2026-04-03$48,900 Active 448-char remark
Show marketing remark (448 chars)
Your brand new 3 bedroom, 2 bathroom home is waiting for you to move in! This comfortable home features premium entry doors, a modern bathroom, as well as new brand name appliances. In the community, enjoy with your friends and family all the amenities we have to offer such as community events, , and . This home won't be on the market long, so call us today for more information or to schedule a tour. Deposits & Fees are subject to change.
ⓘ Source: listings_history table (triggers on properties + properties_extension) + one-shot
backfill from property_details.listing_events for pre-trigger history.
Climate risk First Street
- Flood 1/10 Low FEMA zone X (unshaded) · 0% chance over 30 yrs
- Wildfire 1/10 Low
- Heat 3/10 Moderate 6 d/yr ≥100°F today · 16 d/yr by 30 yrs out
- Wind 2/10 Low
- Air quality 2/10 Low 1 unhealthy d/yr today · 2 by 30 yrs out
Nearby sold comps map
Loading sold comps map…
Walkable amenities ~0.75 mi
Loading nearby amenities…
Taxation est. · year 1
- Rental income
- $18,371
- − Mortgage interest
- −$2,767
- − Property taxes
- −$741
- − Insurance
- −$247
- − Repairs & maintenance
- −$1,470
- − Management
- −$1,470
- − Depreciation
- −$1,437
- Taxable income
- $10,239
- Est. tax owed @ 24.0%
- −$2,457
- After-tax cash flow
- $7,959/yr
For passive investors: Depreciation is non-cash, so a rental often shows a tax loss while cash-flowing — sheltering income. Rental losses are passive: they offset passive income freely, and up to $25,000/yr can offset ordinary (W-2) income if you actively participate and your MAGI is under $100k (phasing out to $0 by $150k); unused losses carry forward. On sale, claimed depreciation is recaptured at up to 25%, and gains may owe capital-gains tax (a 1031 exchange can defer both). Figures are a year-1 estimate at your 24.0% rate — not tax advice; consult a CPA.
Condition & rehab AI · 3 photos
This brand new 3-bedroom, 2-bathroom home is move-in ready with modern features and a good condition score.
Value-add opportunities
- Both Landscaping — Enhances curb appeal and adds value
- Both Painting exterior — Fresh paint improves curb appeal and value
- Both Landscaping and curb appeal — Enhances curb appeal and adds value
Renovation cost estimate screening
Value-add ROI direction
- Both Landscaping — Enhances curb appeal and adds value ↑
- Both Painting exterior — Fresh paint improves curb appeal and value ↑
- Both Landscaping and curb appeal — Enhances curb appeal and adds value ↑
ⓘ Cost ranges are severity-bucket heuristics (US national rule-of-thumb). Get contractor quotes + a written scope before underwriting a rehab budget.
Schools (NCES district)
- District
- Lima City
- NCES district ID
- 3904422
- Math proficiency
- 29% ▼ -13.00%
- Reading proficiency
- 36% ▼ -6.00%
- Median HH income
- $29,685
- Composite
- 26.31/100
- National rank
- #7243
- State rank
- #575 of 656 in OH
Livability — Lima
- Score
- 64/100
- State rank
- #787
- US rank
- #14288
Category grades
Schools grade is shown separately in the Schools card above.
Census & demographics
- Census place
- Lima, OH
- County
- Allen · 98,169 people
- City population
- 21,739
- Metro
- Lima, OH
- Population (ZIP)
- 24,746
- Household income
- $65,954
- Rent vs Own
- Severe rent burden
- 8.0
Population outlook (Allen County) Hauer SSP2
- Today (2025)
- 100,321 people
- By 2030
- 97,693 · -2.6%
- By 2040
- 91,802 · -8.5%
- By 2050
- 86,152 · -14.1%
- By 2075
- 73,659 · -26.6%
- By 2100
- 58,716 · -41.5%
Race, ethnicity, and origin ACS 2023
- Neighborhood character
- Predominantly White (74%)
- Race & ethnicity
- White 74% Black 15% Two or more races 6% Hispanic / Latino 4% Asian 1%
- Common ancestry
- Italian 2% Slovak 2% Romanian 2%
- Foreign-born
- 2% · Canada, Vietnam
- Languages at home
- 96% English-only · Spanish 1% Vietnamese 1%
Political lean MEDSL · Allen
- 2024 margin
- Solid R (+44.1) · D 27.5% · R 71.6%
- 2008→2024 swing
- -23.4pp toward R · 2008: -20.7pp · 2024: -44.1pp
- All cycles
- 2024: R+44.1 2020: R+39.5 2016: R+38.2 2012: R+25.7 2008: R+20.7
Not yet ingested
- Civics
- —
Market trends
- HPI YoY
- ▼ -156.78%
- Current HPI
- 210.6397
- Rent YoY
- —
- Metro
- —
- State GDP YoY
- ▲ 1.98%
- F500 in state
- 48
Industry mix (Fortune 500 HQ in OH)
| Industry | F500 HQs | Revenue |
|---|---|---|
| Insurance | 3 | $145B |
|
||
| Industrial Machinery | 3 | $49B |
|
||
| Financial Services | 3 | $24B |
|
||
| Consumer Goods | 2 | $93B |
|
||
| Aerospace / Defense | 2 | $47B |
|
||
| Utilities | 2 | $33B |
|
||
Price history
1 event — show timeline
- 2026-04-03 Listed $48,900 Zillow
Cash-flow waterfall
monthlySold comps — $/sqft
last 12 mo · ≤1 miLoading sold comps…