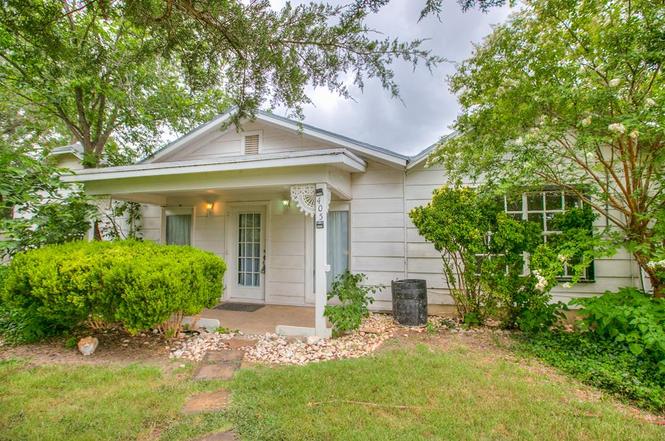
405 W James Ave · Mertzon, TX
Flood risk 1/10 · Minimal
- FEMA flood zone
- —
- Chance of flooding over 30 yrs
- 0.0%
- Est. flood insurance / yr
- —
Fire risk 7/10 · Major
- Est. fire insurance / yr
- $1,222 – $2,270
Heat risk 6/10 · Moderate
- Hot days now (above 104°F)
- 7 days/yr
- Hot days in 30 yrs
- 23 days/yr
Wind risk 4/10 · Minor
- Chance of severe wind over 30 yrs
- 11.0%
Air-quality risk 1/10 · Minimal
- Unhealthy air days now
- 0 days/yr
- Unhealthy air days in 30 yrs
- 0 days/yr
Risk factors via First Street. Map © Google.
Why this score? — see what drove the B+ grade
The composite is a weighted blend of 9 inputs, each scored 0–100. Each bar is that input's sub-score; the figure is the points it added to the 100-point composite (weight × sub-score).
- Cash flow +30.0/30.0
- 1% rule +10.0/10.0
- DSCR +10.0/10.0
- ARV discount +7.5/15.0
- Appreciation +5.7/10.0
- Schools +4.7/10.0
- Livability +3.4/5.0
- Rent growth +2.5/5.0
- Condition / age +2.5/5.0
$65,000
🖨 Deal sheet 📄 Offer letter ✓ Due diligence
Listing remarks
Welcome to 405 W James Ave in the quiet town of Mertzon, TX! Sitting on nearly three-quarters of an acre, this home offers plenty of space both inside and out. Whether you're looking for room to spread out, start a garden, or just enjoy small-town living, this property has it all! The layout is comfortable and functional, perfect for families, with generous living space and a nice-sized yard that's great for kids, pets, or weekend gatherings. Located in the highly regarded Irion County school district, this home is a great option for anyone wanting quality education in a close-knit community.
Key facts
- Close-knit community
- Nice-sized yard
- 0.69 acre lot
Tags
Neighborhood map
What this means for you Summary
Snapshot
- This is a 2-bed/4.0-bath single-family listed at $65k.
Deal economics
- At list price, monthly cash flow is $473 ($6k/yr) — positive.
- The deal already cash-flows at list — no discount required.
- Meets the 1% rule at list price ($1k rent vs $65k).
- Recommended offer: $63k (3.0% below list) — sets the bar for market timing.
Location & tenants
- Location reads 67/100 on livability (#540 in TX) — a middle-class / working-renter tenant base. Strengths: cost of living A+, housing A+; Watch: employment C-, health & safety C-, crime F.
- Irion County ISD (rural): math 50% / reading 55% proficiency, ranked #272 of 1,141 in TX (top 24%) — acceptable for families but not a draw, mixed tenant base, ~2y average lease.
- Market conditions: 20 active listings in the ZIP.
Forward outlook
- In year one you build about $1k of equity ($449 loan paydown + $941 appreciation (1.4% local appreciation)).
- Irion County population projected at -12% by 2050 — secular population decline; favor cash flow + early exit over multi-decade hold.
- At projected returns (1.4% appreciation + 3.0% rent growth), your $18k cash investment doubles in ~3 years — after that, you're playing with house money.
Negotiation context
- It's been on market 39 days — a 3% lower offer ($63k) is reasonable based on typical stale-listing flexibility.
- 3 sale attempts; this cycle's ask has dropped $35k (35%) from the opening price — seller is motivated, your offer sets the floor, not the list.
Risks & watch-outs
- Climate carrying-cost: major wildfire risk; extreme-heat days projected 7→23/yr by 2055 (HVAC capex compounding) — expect insurance premiums to compound above CPI over the hold.
Questions for the listing agent
- It's been on market 39 days. Have you received any prior offers? Is the seller open to a 3% concession, seller financing, or rate buy-down credit?
- Is there a deadline driving the sale (1031 exchange, divorce, estate, relocation)? That informs how much negotiation room exists.
- Schools are B-rated — typically a magnet for longer-tenancy family renters. What's the average tenant stay here, and is there a school-zone premium baked into asking?
- Crime grade is F in this area — have there been break-ins, vandalism, or insurance claims at this property in the last 3 years? What carrier currently insures it and at what premium?
- What's the average days-on-market for RENTAL listings here right now (not sales)? A rising rental-DOM trend means longer vacancies and softer asking-rent achievability than the comps imply.
- What's the recent tenant-quality profile in this submarket — average credit score on applications, eviction rate, late-payment / NSF rate, and stable-employment percentage? A property-management company in the area should have these aggregated.
- How much new for-sale + rental construction is in the pipeline within 1–3 miles? Heavy new supply typically softens prices + rents 12–24 months out; constrained supply supports both.
Investment metrics
- 1% rule
- 1.87% ✓
- Cap rate
- 15.03%
- Cash-on-cash
- 31.21%
- DSCR
- 2.39
- GRM
- 4.4
CMA / ARV
- ARV (on-the-fly)
- $238,182
- Comps found
- 4
Show comp detail 4 sales within ~0.75 mi
| Address | Dist | Beds/Ba | Sqft | Sold | Price | $/sf | Match |
|---|---|---|---|---|---|---|---|
| 405 W James Ave | 0.00mi | 2/4.0 | 1,498 (0%) | 2mo | $65,000 | $43 | 98 |
| 301 W Duncan Ave | 0.32mi | 3/2.0 (+1) | 1,348 (-10%) | 0mo | $215,000 | $159 | 55 |
| 301 N 1st St | 0.55mi | 3/4.0 (+1) | 1,370 (-8%) | 1mo | $260,000 | $190 | 54 |
| 327 N Broadway St | 0.60mi | 3/2.0 (+1) | 1,632 (+9%) | 20mo | $60,000 | $37 | 28 |
Match score weights: distance 35% · size 25% · config 20% · recency 20%. Top-matched comps best support the ARV.
Projected returns pro-forma
1.45% appreciation · 3.0% rent growth · sell at horizon
- IRR
- 34.4%
- Equity multiple
- 2.80×
- Total profit
- $32,846
- Equity at exit
- $23,719
- IRR
- 36.2%
- Equity multiple
- 5.48×
- Total profit
- $81,608
- Equity at exit
- $32,739
Cash invested: $18,200 (down + closing). Projections, not guarantees.
Landlord ↔ Tenant lean methodology
- Overall (STATE)
- 87 Strongly Landlord-Friendly
- State Texas
- 87 Strongly Landlord-Friendly · R+5
- County
- — inherits STATE
- City
- — inherits STATE
ZIP-level market 76941
- Home prices YoY
- 1.1%
- Active inventory
- 20
- Price-to-rent
- 4.4×
Monthly cashflow live
- Estimated rent
- $1,218 medium interval (Pro) →
- Mortgage (P&I)
- −$341
- Tax from tax record
- −$121 /mo · $1,451/yr
- Insurance
- −$27
- HOA
- −$0
- Vacancy / Maint / Mgmt
- −$256
- Net cashflow
- $473
Break-even live
UW: 25.0% down · 7.5% · 30yr · 1.5% tax · 5.0% vac · 8.0% maint · 8.0% mgmt
Financing live
Cash to close
- Down payment
- $16,250
- Closing costs
- $1,950
- Reserves months
- —
- Total cash needed
- —
Loan-product check · same deal, 3 products live
Conventional
25% down · 7.5% · 30yr
- Down + closing
- —
- Monthly P&I
- —
- Monthly cashflow
- —
- DSCR
- —
- Eligible?
- —
Personal DTI + credit; lowest rate.
DSCR
20% down · 8.5% · 30yr
- Down + closing
- —
- Monthly P&I
- —
- Monthly cashflow
- —
- DSCR
- —
- Eligible?
- —
No personal income docs; deal must DSCR.
Hard money
10% down · 12.0% · 12mo
- Down + closing
- —
- Monthly P&I
- —
- Monthly cashflow
- —
- DSCR
- —
- Eligible?
- —
Short-term bridge; refi at stabilization.
Listing history 10 events
-
2026-04-15soldstatus
-
2026-03-30status Pending
-
2026-03-25price $65,000
-
2026-02-19$100,000 Active
-
2025-10-09price $125,000
-
2025-08-26price $135,000
-
2025-07-22price $145,000
-
2025-07-17status Active
-
2025-07-11status Pending
-
2025-07-08$160,000 Active
ⓘ Source: listings_history table (triggers on properties + properties_extension) + one-shot
backfill from property_details.listing_events for pre-trigger history.
Tax reassessment forecast TX · Resets to sale price
- Current annual tax
- $1,451 · $121/mo
- Projected year-2 tax
- $1,451 · $121/mo
- Expected delta
- $0/yr ($0/mo · 0.0%)
ⓘ Screening estimate from a state-policy table — verify with the county assessor before closing.
Climate risk First Street
- Flood 1/10 Low 0% chance over 30 yrs
- Wildfire 7/10 Severe
- Heat 6/10 Major 7 d/yr ≥104°F today · 23 d/yr by 30 yrs out
- Wind 4/10 Moderate 11% chance of damaging wind over 30 yrs
- Air quality 1/10 Low 0 unhealthy d/yr today · 0 by 30 yrs out
Nearby sold comps map
Loading sold comps map…
Walkable amenities ~0.75 mi
Loading nearby amenities…
Taxation est. · year 1
- Rental income
- $14,617
- − Mortgage interest
- −$3,641
- − Property taxes
- −$1,451
- − Insurance
- −$325
- − Repairs & maintenance
- −$1,169
- − Management
- −$1,169
- − Depreciation
- −$1,891
- Taxable income
- $4,970
- Est. tax owed @ 24.0%
- −$1,193
- After-tax cash flow
- $4,488/yr
For passive investors: Depreciation is non-cash, so a rental often shows a tax loss while cash-flowing — sheltering income. Rental losses are passive: they offset passive income freely, and up to $25,000/yr can offset ordinary (W-2) income if you actively participate and your MAGI is under $100k (phasing out to $0 by $150k); unused losses carry forward. On sale, claimed depreciation is recaptured at up to 25%, and gains may owe capital-gains tax (a 1031 exchange can defer both). Figures are a year-1 estimate at your 24.0% rate — not tax advice; consult a CPA.
Schools (NCES district)
- District
- Irion County ISD
- NCES district ID
- 4830360
- Math proficiency
- 50% ▬ 0.00%
- Reading proficiency
- 55% ▬ 0.00%
- Median HH income
- $51,367
- Composite
- 46.9/100
- National rank
- #5180
- State rank
- #272 of 1141 in TX
Livability — Mertzon
- Score
- 67/100
- State rank
- #540
- US rank
- #10515
Category grades
Schools grade is shown separately in the Schools card above.
Census & demographics
- Census place
- Mertzon, TX
- Population (ZIP)
- 1,216
Population outlook (Irion County) Hauer SSP2
- Today (2025)
- 1,467 people
- By 2030
- 1,433 · -2.3%
- By 2040
- 1,363 · -7.1%
- By 2050
- 1,287 · -12.3%
- By 2075
- 1,081 · -26.3%
- By 2100
- 780 · -46.8%
Race, ethnicity, and origin ACS 2023
- Neighborhood character
- Predominantly White (66%)
- Race & ethnicity
- White 66% Hispanic / Latino 33% Two or more races 4%
- Hispanic origin (detail)
- Mexican 33%
- Common ancestry
- Slovak 3% Russian 1%
- Foreign-born
- 4% · Canada
- Languages at home
- 74% English-only · Spanish 26%
Political lean MEDSL · Irion
- 2024 margin
- Solid R (+75.6) · D 12.1% · R 87.7%
- 2008→2024 swing
- -16.8pp toward R · 2008: -58.8pp · 2024: -75.6pp
- All cycles
- 2024: R+75.6 2020: R+71.9 2016: R+75.0 2012: R+70.6 2008: R+58.8
Not yet ingested
- Civics
- —
Market trends
- HPI YoY
- ▲ 1.45%
- Current HPI
- 139.9318
- Rent YoY
- —
- Metro
- —
- State GDP YoY
- ▲ 3.95%
- F500 in state
- 110
Industry mix (Fortune 500 HQ in TX)
| Industry | F500 HQs | Revenue |
|---|---|---|
| Energy | 16 | $1,198B |
|
||
| Technology | 5 | $198B |
|
||
| Engineering / Construction | 4 | $72B |
|
||
| Energy Services | 3 | $60B |
|
||
| Utilities | 3 | $41B |
|
||
| Healthcare | 2 | $330B |
|
||
Price history
-59.4% since first listed10 events — show timeline
- 2026-04-15 Sold (Public Records) — Public Records
- 2026-03-30 Pending — SAAR TX
- 2026-03-25 Price Changed $65,000 SAAR TX
- 2026-02-19 Listed $100,000 SAAR TX
- 2025-10-09 Price Changed $125,000 SAAR TX
- 2025-08-26 Price Changed $135,000 SAAR TX
- 2025-07-22 Price Changed $145,000 SAAR TX
- 2025-07-17 Relisted — SAAR TX
- 2025-07-11 Pending — SAAR TX
- 2025-07-08 Listed $160,000 SAAR TX
Property tax history
+3.4%/yrLatest (2025): $1,451 · +3.0% YoY. Source: county tax records.
Cash-flow waterfall
monthlySold comps — $/sqft
last 12 mo · ≤1 miLoading sold comps…