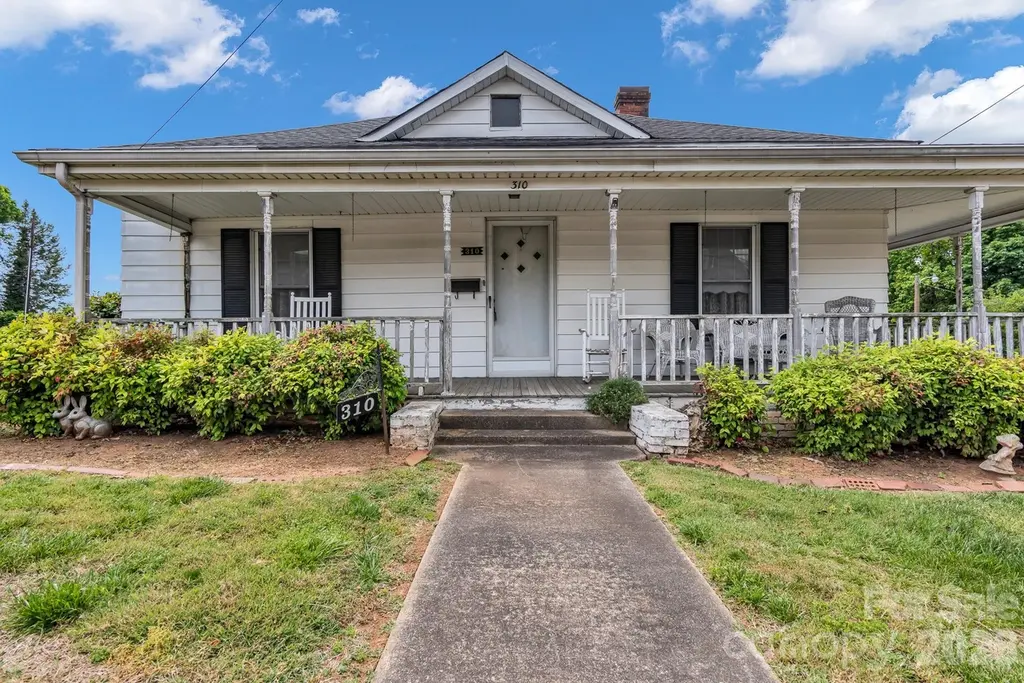
310 E Ryder Ave · Landis, NC
Flood risk 1/10 · Minimal
- FEMA flood zone
- X (unshaded)
- Chance of flooding over 30 yrs
- 0.0%
- Est. flood insurance / yr
- $507 – $1,088
Fire risk 3/10 · Minor
- Est. fire insurance / yr
- $906 – $1,684
Heat risk 5/10 · Moderate
- Hot days now (above 104°F)
- 7 days/yr
- Hot days in 30 yrs
- 17 days/yr
Wind risk 4/10 · Minor
- Chance of severe wind over 30 yrs
- 15.0%
Air-quality risk 2/10 · Minimal
- Unhealthy air days now
- 1 days/yr
- Unhealthy air days in 30 yrs
- 3 days/yr
Risk factors via First Street. Map © Google.
Why this score? — see what drove the C- grade
The composite is a weighted blend of 9 inputs, each scored 0–100. Each bar is that input's sub-score; the figure is the points it added to the 100-point composite (weight × sub-score).
- Cash flow +16.4/30.0
- ARV discount +15.0/15.0
- DSCR +5.1/10.0
- Livability +3.7/5.0
- 1% rule +3.5/10.0
- Schools +2.6/10.0
- Rent growth +2.5/5.0
- Condition / age +2.5/5.0
- Appreciation +0.0/10.0
$190,000
🖨 Deal sheet (PDF) 📄 Offer letter ✓ Due diligence
Listing remarks MLS
Opportunity awaits in the heart of Landis! This charming 2-bed/2-bath home is conveniently located just minutes from shopping, dining & easy interstate access. Filled with timeless character, this home is ready for its next owner to bring their vision & make it shine once again. Step inside to a spacious living room that welcomes you home, flowing into a dining room featuring a brick fireplace with woodstove—perfect for gathering with family & friends. The kitchen offers an eat-in area & includes all appliances. A dedicated laundry room adds everyday convenience. Outside, enjoy relaxing on the covered front porch or the generous yard, offering plenty of space for entertaining, gardening or pets to play. The concrete driveway leads to a 2-car carport & a workshop that's ideal for hobbies or storage. Whether you're looking for your next home or an investment, this property offers endless potential. Bring your imagination & schedule your showing today! Sold As-Is; no repairs will be made.
Key facts
- Covered front porch
- 2 car carport
- Generous yard
Tags
Property features AI
Finance
- HOA & community: No HOA
Exterior
- Parking: Detached carport (2 spaces); Driveway
- Utilities: City water; Public sewer
- Home design: Single-family residence; One level
- Construction: Site-built home; Aluminum exterior; Crawl space foundation
- Exterior features: Covered front porch; Concrete and paved road access; Publicly maintained road
Interior
- Kitchen: Electric oven; Electric range; Microwave; Refrigerator
- Bedrooms: 2 bedrooms on the main level
- Flooring: Carpet; Linoleum
- Bathrooms: 2 full bathrooms (main level)
- Heating & cooling: Forced air heating (natural gas); Central air conditioning
- Interior features: 8 total rooms; Wood-burning stove fireplace; Mud room laundry area
- Laundry & utility: Mud room
Neighborhood map
What this means for you Summary
Snapshot
- This is a 2-bed/2.0-bath single-family listed at $190k.
Deal economics
- At list price, monthly cash flow is $107 ($1k/yr) — positive.
- The deal already cash-flows at list — no discount required.
- To meet the 1% rule (rent ≥ 1% of price), the offer needs to be $162k (14.5% below list).
- Recommended offer: $162k (14.5% below list) — sets the bar for 1% rule.
- Cap rate 7.0% vs local median 2.3% in Landis — top-decile yield for the area; either an underpriced asset or a hidden risk that comps aren't pricing in. Stress-test before assuming the spread holds.
Location & tenants
- Location reads 74/100 on livability (#65 in NC, #4,961 nationally) — a middle-class / working-renter tenant base. Strengths: cost of living A+, housing A+, health & safety A+; Watch: amenities F, commute F.
- Rowan-Salisbury Schools (rural): math 26% / reading 35% proficiency, ranked #142 of 178 in NC (top 80%) — families likely to look elsewhere, expect single-tenant / working-renter base with shorter leases.
- Zoned schools: Landis Elementary (math 57% / reading 47%, grade C-, #354 of 1,410 statewide, top 28%, 589 students, 91% FRL); Corriher Lipe Middle (math 26% / reading 30%, grade F, #360 of 475 statewide, top 77%, 476 students, 64% FRL); South Rowan High (math 27% / reading 38%, grade F, #441 of 535 statewide, top 83%, 952 students, 52% FRL).
- Market conditions: 31 active listings in the ZIP; 8 comparable units currently listed for rent nearby; rentals at typical pace (median 22d on market — plan ~3-4 weeks tenant-placement turnaround); 592 units permitted in Rowan County in 2024 (5 in 5+ unit buildings).
- This rent runs 33% of the median local income ($60k/yr) — at the standard rent-burdened threshold; future hikes will face affordability resistance.
Forward outlook
- Local home prices are declining (-3.0%/yr); year-one equity from $1k of loan paydown is wiped out by about $6k of value loss. Plan a longer hold.
- Rowan County population projected to shrink 6% by 2050 — rents likely to lag national; underwrite the cash flow, not the appreciation.
Negotiation context
- It's been on market 20 days — a 2% lower offer ($187k) is reasonable based on typical stale-listing flexibility.
- 2 sale attempts with the ask held roughly flat each time — persistent listings suggest the price (not the market) is what's stuck; bring a comps-based counter.
Risks & watch-outs
- Watch-outs: built in 1900 — expect roof / HVAC / electrical / plumbing capex.
- Climate carrying-cost: extreme-heat days projected 7→17/yr by 2055 (HVAC capex compounding) — expect insurance premiums to compound above CPI over the hold.
Questions for the listing agent
- Built in 1900 — when were the roof, HVAC, electrical panel, plumbing, and water heater last replaced?
- Is there a deadline driving the sale (1031 exchange, divorce, estate, relocation)? That informs how much negotiation room exists.
- Schools are D-rated, which usually means shorter tenancies and higher turnover. Who's the typical renter profile here, and what's been the actual vacancy rate?
- What's the average days-on-market for RENTAL listings here right now (not sales)? A rising rental-DOM trend means longer vacancies and softer asking-rent achievability than the comps imply.
- What's the recent tenant-quality profile in this submarket — average credit score on applications, eviction rate, late-payment / NSF rate, and stable-employment percentage? A property-management company in the area should have these aggregated.
- How much new for-sale + rental construction is in the pipeline within 1–3 miles? Heavy new supply typically softens prices + rents 12–24 months out; constrained supply supports both.
Investment metrics
- 1% rule
- 0.85% ✗
- Cap rate
- 6.97%
- Cash-on-cash
- 2.42%
- DSCR
- 1.11
- GRM
- 9.8
CMA / ARV
- ARV (on-the-fly)
- $307,998
- Comps found
- 12
Show comp detail 12 sales within ~0.75 mi
| Address | Dist | Beds/Ba | Sqft | Sold | Price | $/sf | Match |
|---|---|---|---|---|---|---|---|
| 310 Town St | 0.34mi | 3/2.5 (+1) | 1,447 (+0%) | 13mo | $313,000 | $216 | 66 |
| 306 N Correll St | 0.22mi | 3/2.0 (+1) | 1,350 (-7%) | 9mo | $285,000 | $211 | 66 |
| 235 N Beaver St | 0.31mi | 3/2.0 (+1) | 1,611 (+11%) | 0mo | $335,000 | $208 | 62 |
| 413 W Ridge Ave | 0.54mi | 3/1.0 (+1) | 1,443 (-0%) | 7mo | $291,000 | $202 | 60 |
| 210 N Correll St | 0.16mi | 3/2.5 (+1) | 1,290 (-11%) | 10mo | $274,900 | $213 | 60 |
| 208 N Correll St | 0.15mi | 3/2.5 (+1) | 1,290 (-11%) | 12mo | $275,000 | $213 | 58 |
| 710 E Mills Dr | 0.33mi | 3/2.0 (+1) | 1,617 (+12%) | 4mo | $355,000 | $220 | 56 |
| 813 S Zion St | 0.72mi | 3/2.0 (+1) | 1,475 (+2%) | 5mo | $315,000 | $214 | 54 |
| 321 E Taylor St | 0.40mi | 3/2.0 (+1) | 1,303 (-10%) | 7mo | $270,000 | $207 | 54 |
| 613 W Mill St | 0.68mi | 3/2.0 (+1) | 1,522 (+5%) | 3mo | $254,000 | $167 | 52 |
| 505 Turner St | 0.52mi | 3/1.0 (+1) | 1,378 (-5%) | 14mo | $242,000 | $176 | 48 |
| 315 W Hoke St W | 0.53mi | 3/2.0 (+1) | 1,572 (+9%) | 11mo | $365,000 | $232 | 47 |
Match score weights: distance 35% · size 25% · config 20% · recency 20%. Top-matched comps best support the ARV.
Projected returns pro-forma
-3.0% appreciation · 3.0% rent growth · sell at horizon
- IRR
- -12.5%
- Equity multiple
- 0.55×
- Total profit
- $-24,024
- Equity at exit
- $28,330
- IRR
- -3.5%
- Equity multiple
- 0.77×
- Total profit
- $-12,376
- Equity at exit
- $16,428
Cash invested: $53,200 (down + closing). Projections, not guarantees.
Landlord ↔ Tenant lean methodology
- Overall (STATE)
- 85 Strongly Landlord-Friendly
- State North Carolina
- 85 Strongly Landlord-Friendly · R+3
- County
- — inherits STATE
- City
- — inherits STATE
ZIP-level market 28088
- Home prices YoY
- -12.1%
- Active inventory
- 31
- Price-to-rent
- 9.8×
Monthly cashflow live
- Estimated rent
- $1,624 high interval (Pro) →
- Mortgage (P&I)
- −$996
- Tax from tax record
- −$100 /mo · $1,199/yr
- Insurance
- −$79
- HOA
- −$0
- Vacancy / Maint / Mgmt
- −$341
- Net cashflow
- $107
Break-even live
Sensitivity live
| Price | -10% $215 | -5% $161 | +0% $107 | +5% $53 | +10% $0 |
|---|---|---|---|---|---|
| Rent | -10% $-21 | -5% $43 | +0% $107 | +5% $171 | +10% $235 |
| Rate | -1.0pp $203 | -0.5pp $155 | base $107 | +0.5pp $58 | +1.0pp $8 |
UW: 25.0% down · 7.5% · 30yr · 1.5% tax · 5.0% vac · 8.0% maint · 8.0% mgmt
Financing live
Cash to close
- Down payment
- $47,500
- Closing costs
- $5,700
- Reserves months
- —
- Total cash needed
- —
Loan-product check · same deal, 3 products live
Conventional
25% down · 7.5% · 30yr
- Down + closing
- —
- Monthly P&I
- —
- Monthly cashflow
- —
- DSCR
- —
- Eligible?
- —
Personal DTI + credit; lowest rate.
DSCR
20% down · 8.5% · 30yr
- Down + closing
- —
- Monthly P&I
- —
- Monthly cashflow
- —
- DSCR
- —
- Eligible?
- —
No personal income docs; deal must DSCR.
Hard money
10% down · 12.0% · 12mo
- Down + closing
- —
- Monthly P&I
- —
- Monthly cashflow
- —
- DSCR
- —
- Eligible?
- —
Short-term bridge; refi at stabilization.
Rent comps 8 comps
| Address | Beds | Baths | Sqft | Rent | $/sqft | DOM | Units | Dist |
|---|---|---|---|---|---|---|---|---|
| 106 S Chapel St Landis, NC | 2.0 | 1.0 | 970 | $1,000 | $1.03 | 26d | 1 | 0.09mi |
| 205 S Upright St Landis, NC | 3.0 | 2.0 | 1593 | $1,900 | $1.19 | 22d | 1 | 0.33mi |
| 310 Town St Landis, NC | 3.0 | 2.5 | 1450 | $2,100 | $1.45 | 26d | 1 | 0.34mi |
| 518 Landis Oak Way Landis, NC | 3.0 | 2.5 | 1630 | $1,400 | $0.86 | 26d | 1 | 0.87mi |
| 516 Landis Oak Way Landis, NC | 3.0 | 2.5 | 1576 | $1,200 | $0.76 | 14d | 1 | 0.87mi |
| 303 Landis Oak Way Landis, NC | 3.0 | 2.5 | 1682 | $1,750 | $1.04 | 6d | 1 | 0.90mi |
| 614 Forest Ridge Rd Kannapolis, NC | 3.0 | 2.0 | 1483 | $2,085 | $1.41 | 0d | 1 | 1.06mi |
| 105 Birch Ct China Grove, NC | 3.0 | 2.0 | 1268 | $1,845 | $1.46 | 6d | 1 | 1.26mi |
Listing history 13 events
-
2026-06-21days on market $190,000 Active 20 DOM
-
2026-06-18days on market $190,000 Active 17 DOM
-
2026-06-17days on market $190,000 Active 16 DOM
-
2026-06-16days on market $190,000 Active 15 DOM
-
2026-06-15days on market $190,000 Active 14 DOM
-
2026-06-13days on market $190,000 Active 12 DOM
-
2026-06-09days on market $190,000 Active 8 DOM
-
2026-06-08days on market $190,000 Active 7 DOM
-
2026-06-07days on market $190,000 Active 6 DOM
-
2026-06-04days on market $190,000 Active 3 DOM
-
2026-06-03days on market $190,000 Active 2 DOM
-
2026-06-02remarks 693-char remark
-
2026-06-02$190,000 Active 1 DOM
ⓘ Source: listings_history table (triggers on properties + properties_extension) + one-shot
backfill from property_details.listing_events for pre-trigger history.
Tax reassessment forecast NC · Resets to sale price
- Current annual tax
- $1,199 · $100/mo
- Projected year-2 tax
- $1,558 · $130/mo
- Expected delta
- +$359/yr (+$30/mo · 29.9%)
ⓘ Screening estimate from a state-policy table — verify with the county assessor before closing.
Climate risk First Street
- Flood 1/10 Low FEMA zone X (unshaded) · 0% chance over 30 yrs
- Wildfire 3/10 Moderate
- Heat 5/10 Major 7 d/yr ≥104°F today · 17 d/yr by 30 yrs out
- Wind 4/10 Moderate 15% chance of damaging wind over 30 yrs
- Air quality 2/10 Low 1 unhealthy d/yr today · 3 by 30 yrs out
Nearby sold comps map
Loading sold comps map…
Walkable amenities ~0.75 mi
Loading nearby amenities…
Taxation est. · year 1
- Rental income
- $19,483
- − Mortgage interest
- −$10,643
- − Property taxes
- −$1,199
- − Insurance
- −$950
- − Repairs & maintenance
- −$1,559
- − Management
- −$1,559
- − Depreciation
- −$5,527
- Taxable loss
- −$1,954
- Est. tax savings @ 24.0%
- +$469
- After-tax cash flow
- $1,755/yr
For passive investors: Depreciation is non-cash, so a rental often shows a tax loss while cash-flowing — sheltering income. Rental losses are passive: they offset passive income freely, and up to $25,000/yr can offset ordinary (W-2) income if you actively participate and your MAGI is under $100k (phasing out to $0 by $150k); unused losses carry forward. On sale, claimed depreciation is recaptured at up to 25%, and gains may owe capital-gains tax (a 1031 exchange can defer both). Figures are a year-1 estimate at your 24.0% rate — not tax advice; consult a CPA.
Schools (NCES district)
- District
- Rowan-Salisbury Schools
- NCES district ID
- 3704050
- Math proficiency
- 26% ▲ 2.00%
- Reading proficiency
- 35% ▲ 1.00%
- Median HH income
- $43,953
- Composite
- 26.01/100
- National rank
- #7317
- State rank
- #142 of 178 in NC
Livability — Landis
- Score
- 74/100
- State rank
- #65
- US rank
- #4961
Category grades
Schools grade is shown separately in the Schools card above.
Census & demographics
- Census place
- Landis, NC
- County
- Rowan County · 103,630 people
- City population
- 3,054
- Metro
- Charlotte-Concord-Gastonia, NC-SC
- Population (ZIP)
- 3,054
- Household income
- $59,872
- Rent vs Own
- Severe rent burden
- 13.0
Population outlook (Rowan County) Hauer SSP2
- Today (2025)
- 140,430 people
- By 2030
- 140,193 · -0.2%
- By 2040
- 137,617 · -2.0%
- By 2050
- 131,826 · -6.1%
- By 2075
- 115,123 · -18.0%
- By 2100
- 92,774 · -33.9%
Race, ethnicity, and origin ACS 2023
- Neighborhood character
- Diverse neighborhood (Simpson 0.62)
- Race & ethnicity
- White 57% Hispanic / Latino 19% Two or more races 18% Asian 9% Black 9%
- Hispanic origin (detail)
- Mexican 4%
- Common ancestry
- Italian 3% Lithuanian 2% Slovak 1%
- Foreign-born
- 12% · Canada, China, Vietnam
- Languages at home
- 78% English-only · Spanish 16% Chinese 6% Other Indo-European 1%
Political lean MEDSL · Rowan
- 2024 margin
- Solid R (+35.9) · D 31.6% · R 67.5%
- 2008→2024 swing
- -13.1pp toward R · 2008: -22.8pp · 2024: -35.9pp
- All cycles
- 2024: R+35.9 2020: R+35.7 2016: R+36.8 2012: R+26.0 2008: R+22.8
Not yet ingested
- Civics
- —
Market trends
- HPI YoY
- ▼ -41.45%
- Current HPI
- 302.1028
- Rent YoY
- —
- Metro
- Charlotte-Concord-Gastonia, NC-SC
- State GDP YoY
- ▲ 3.28%
- F500 in state
- 26
Industry mix (Fortune 500 HQ in NC)
| Industry | F500 HQs | Revenue |
|---|---|---|
| Financial Services | 2 | $213B |
|
||
| Retail | 2 | $95B |
|
||
| Industrial Conglomerate | 1 | $38B |
|
||
| Metals / Steel | 1 | $35B |
|
||
| Utilities | 1 | $30B |
|
||
| Industrial Machinery | 1 | $19B |
|
||
Price history
+0.0% since first listed2 events — show timeline
- 2026-06-01 Listed $190,000 Triad MLS
- 2026-06-01 Listed $190,000 CANOPYMLS as Distributed by MLS Grid
Property tax history
+3.3%/yrLatest (2019): $1,199 · +19.1% YoY. Source: county tax records.
Cash-flow waterfall
monthlySold comps — $/sqft
last 12 mo · ≤1 miLoading sold comps…