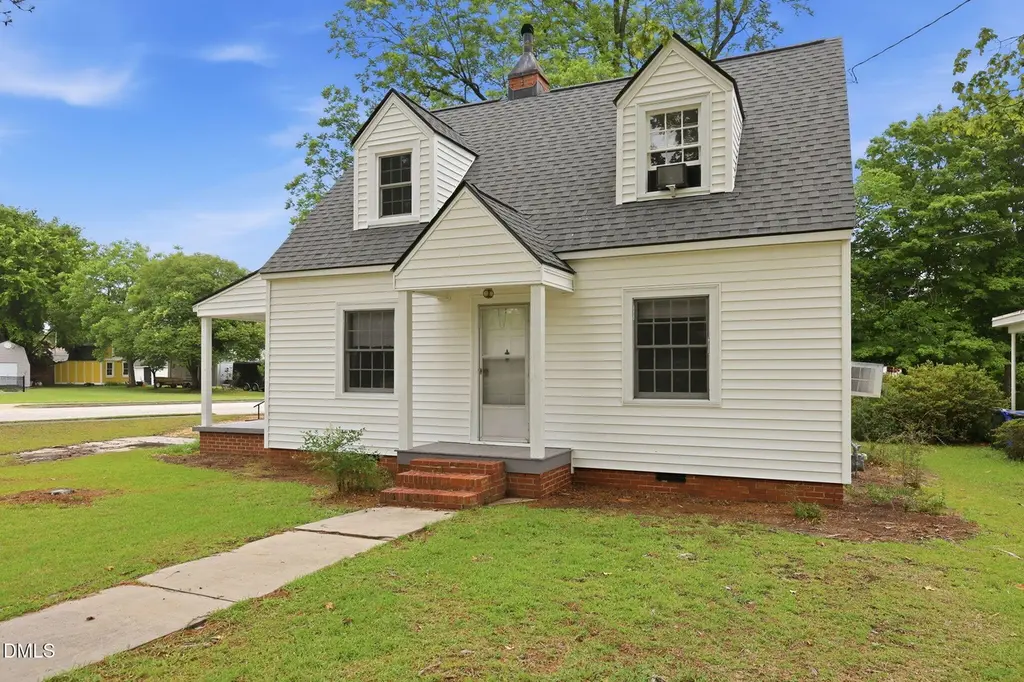
1001 S 9th St · Lillington, NC
Flood risk 1/10 · Minimal
- FEMA flood zone
- X (unshaded)
- Chance of flooding over 30 yrs
- 0.0%
- Est. flood insurance / yr
- $507 – $1,088
Fire risk 4/10 · Minor
- Est. fire insurance / yr
- $906 – $1,684
Heat risk 7/10 · Major
- Hot days now (above 106°F)
- 7 days/yr
- Hot days in 30 yrs
- 17 days/yr
Wind risk 6/10 · Moderate
- Chance of severe wind over 30 yrs
- 69.0%
Air-quality risk 2/10 · Minimal
- Unhealthy air days now
- 1 days/yr
- Unhealthy air days in 30 yrs
- 1 days/yr
Risk factors via First Street. Map © Google.
Why this score? — see what drove the C+ grade
The composite is a weighted blend of 9 inputs, each scored 0–100. Each bar is that input's sub-score; the figure is the points it added to the 100-point composite (weight × sub-score).
- Cash flow +22.7/30.0
- ARV discount +15.0/15.0
- DSCR +7.3/10.0
- 1% rule +5.2/10.0
- Livability +3.6/5.0
- Schools +3.0/10.0
- Rent growth +2.5/5.0
- Condition / age +2.5/5.0
- Appreciation +0.0/10.0
$169,000
🖨 Deal sheet (PDF) 📄 Offer letter ✓ Due diligence
Listing remarks
* * Multiple offers have been received. Calling for all offers to be submitted by 9pm, Friday 6/5. Welcome to this charming three-bedroom, one-and-a-half-bath single-family residence located in the heart of Lillington, NC. This home offers comfortable living space with room to grow and enjoy outdoor areas. Whether you're seeking a starter home, a downsizing opportunity, or an investment property, this residence provides a solid foundation in a convenient location. Discover the potential of this Lillington property today.
Key facts
- 0.24 acre lot
- 4 parking spots
- Built 1940
Property features AI
Finance
- Other: Lot size approximately 0.24 acres; No waterfront; No horse facilities
- HOA & community: No homeowners association
Exterior
- Parking: Open parking for 4 cars; Driveway with gravel surface
- Security: Gated community features listed (also noted as none)
- Utilities: Public water; Public sewer
- Home design: Site-built house; One and one-half stories; Faces west; Zoned R-10
- Construction: Vinyl siding; Brick/mortar foundation; Architectural shingle roof
- Exterior features: Side porch; Grassed and natural-state vegetation; No fencing; City street frontage
Interior
- Kitchen: Electric range; Refrigerator
- Bedrooms: 3 bedrooms total, 1 on the main level
- Flooring: Hardwood; Vinyl
- Bathrooms: 1 full bathroom; 1 half bathroom
- Heating & cooling: Heating present (other type); Cooling via ceiling fans and wall/window unit(s)
- Interior features: Bathtub/shower combination; Ceiling fan(s); Laminate counters; Window treatments; Fireplace with screen in the family room
- Laundry & utility: Laundry located in the kitchen / inside the home
Neighborhood map
What this means for you Summary
Snapshot
- This is a 3-bed/2.0-bath single-family listed at $169k.
Deal economics
- At list price, monthly cash flow is $289 ($3k/yr) — positive.
- The deal already cash-flows at list — no discount required.
- Meets the 1% rule at list price ($2k rent vs $169k).
- Cap rate 8.3% vs local median 4.0% in Lillington — top-decile yield for the area; either an underpriced asset or a hidden risk that comps aren't pricing in. Stress-test before assuming the spread holds.
Location & tenants
- Location reads 71/100 on livability (#101 in NC) — a middle-class / working-renter tenant base. Strengths: cost of living A+, housing A+, health & safety A+; Watch: employment C-, amenities F, commute F.
- Harnett County Schools (rural): math 31% / reading 39% proficiency, ranked #130 of 178 in NC (top 73%) — families likely to look elsewhere, expect single-tenant / working-renter base with shorter leases.
- Zoned schools: Lillington-Shawtown Elementary (math 23% / reading 30%, grade F, #1,073 of 1,410 statewide, top 77%, 694 students, 100% FRL); Harnett Central Middle (math 25% / reading 38%, grade F, #323 of 475 statewide, top 68%, 1,024 students, 63% FRL); Harnett Central High (math 43% / reading 51%, grade D-, #334 of 535 statewide, top 64%, 1,474 students, 56% FRL) — zoned schools average 73% FRL vs 51% district-wide (22 pts higher); higher-poverty schools than district average — tighter screening recommended.
- Market conditions: 834 active listings in the ZIP; 2 comparable units currently listed for rent nearby; 2,080 units permitted in Harnett County in 2024 (12 in 5+ unit buildings).
- This rent runs 31% of the median local income ($67k/yr) — at the standard rent-burdened threshold; future hikes will face affordability resistance.
Forward outlook
- Local home prices are declining (-3.0%/yr); year-one equity from $1k of loan paydown is wiped out by about $5k of value loss. Plan a longer hold.
- Harnett County population projected at +42% by 2050 — long-run rental-demand tailwind backs the buy-and-hold thesis.
Negotiation context
- Only 3 days on market — expect competitive offers; lowballing is unlikely to land.
- Current owner paid $80k; list at $169k implies a 111% gain — meaningful room to come down on a strong offer.
Risks & watch-outs
- Watch-outs: built in 1940 — expect roof / HVAC / electrical / plumbing capex.
- Climate carrying-cost: major wind risk, 69% chance of damaging wind over 30y; extreme-heat days projected 7→17/yr by 2055 (HVAC capex compounding) — expect insurance premiums to compound above CPI over the hold.
Questions for the listing agent
- Built in 1940 — when were the roof, HVAC, electrical panel, plumbing, and water heater last replaced?
- Is there a deadline driving the sale (1031 exchange, divorce, estate, relocation)? That informs how much negotiation room exists.
- Schools are F-rated, which usually means shorter tenancies and higher turnover. Who's the typical renter profile here, and what's been the actual vacancy rate?
- What's the average days-on-market for RENTAL listings here right now (not sales)? A rising rental-DOM trend means longer vacancies and softer asking-rent achievability than the comps imply.
- What's the recent tenant-quality profile in this submarket — average credit score on applications, eviction rate, late-payment / NSF rate, and stable-employment percentage? A property-management company in the area should have these aggregated.
- How much new for-sale + rental construction is in the pipeline within 1–3 miles? Heavy new supply typically softens prices + rents 12–24 months out; constrained supply supports both.
Investment metrics
- 1% rule
- 1.02% ✓
- Cap rate
- 8.35%
- Cash-on-cash
- 7.34%
- DSCR
- 1.33
- GRM
- 8.2
CMA / ARV
- ARV (on-the-fly)
- $247,000
- Comps found
- 12
Show comp detail 12 sales within ~0.75 mi
| Address | Dist | Beds/Ba | Sqft | Sold | Price | $/sf | Match |
|---|---|---|---|---|---|---|---|
| 512 W Lofton St | 0.31mi | 3/2.0 | 1,296 (-0%) | 2mo | $250,000 | $193 | 83 |
| 1106 S 9th St | 0.10mi | 3/2.0 | 1,311 (+1%) | 20mo | $288,000 | $220 | 77 |
| 401 W Mcneill St | 0.29mi | 2/2.0 (-1) | 1,309 (+1%) | 6mo | $225,000 | $172 | 76 |
| 515 W Killiegrey St | 0.31mi | 3/2.0 | 1,228 (-6%) | 8mo | $255,000 | $208 | 69 |
| 104 W Old Rd | 0.26mi | 3/1.0 | 1,410 (+8%) | 1mo | $207,000 | $147 | 69 |
| 1102 S 1st St | 0.22mi | 3/2.0 | 1,380 (+6%) | 16mo | $152,000 | $110 | 66 |
| 510 W Edgar St | 0.58mi | 3/2.5 | 1,396 (+7%) | 18mo | $240,000 | $172 | 44 |
| 409 S 13th St | 0.51mi | 3/1.0 | 1,138 (-12%) | 13mo | $232,000 | $204 | 41 |
| 610 W Old Rd | 0.50mi | 2/2.0 (-1) | 1,483 (+14%) | 13mo | $175,000 | $118 | 38 |
| 802 S Parrish St | 0.68mi | 3/2.0 | 1,448 (+11%) | 16mo | $275,000 | $190 | 36 |
| 1009 Hillside Dr | 0.65mi | 3/2.0 | 1,440 (+11%) | 19mo | $299,500 | $208 | 36 |
| 798 S Parrish St | 0.67mi | 3/2.0 | 1,465 (+13%) | 18mo | $277,500 | $189 | 33 |
Match score weights: distance 35% · size 25% · config 20% · recency 20%. Top-matched comps best support the ARV.
Projected returns pro-forma
-3.0% appreciation · 3.0% rent growth · sell at horizon
- IRR
- -5.1%
- Equity multiple
- 0.81×
- Total profit
- $-8,992
- Equity at exit
- $25,198
- IRR
- 4.5%
- Equity multiple
- 1.33×
- Total profit
- $15,760
- Equity at exit
- $14,612
Cash invested: $47,320 (down + closing). Projections, not guarantees.
Landlord ↔ Tenant lean methodology
- Overall (STATE)
- 85 Strongly Landlord-Friendly
- State North Carolina
- 85 Strongly Landlord-Friendly · R+3
- County
- — inherits STATE
- City
- — inherits STATE
ZIP-level market 27546
- Home prices YoY
- -14.4%
- Active inventory
- 834
- Price-to-rent
- 8.2×
Monthly cashflow live
- Estimated rent
- $1,722 medium interval (Pro) →
- Mortgage (P&I)
- −$886
- Tax from tax record
- −$114 /mo · $1,369/yr
- Insurance
- −$70
- HOA
- −$0
- Vacancy / Maint / Mgmt
- −$362
- Net cashflow
- $289
Break-even live
Sensitivity live
| Price | -10% $385 | -5% $337 | +0% $289 | +5% $241 | +10% $194 |
|---|---|---|---|---|---|
| Rent | -10% $153 | -5% $221 | +0% $289 | +5% $357 | +10% $425 |
| Rate | -1.0pp $374 | -0.5pp $332 | base $289 | +0.5pp $246 | +1.0pp $201 |
UW: 25.0% down · 7.5% · 30yr · 1.5% tax · 5.0% vac · 8.0% maint · 8.0% mgmt
Financing live
Cash to close
- Down payment
- $42,250
- Closing costs
- $5,070
- Reserves months
- —
- Total cash needed
- —
Loan-product check · same deal, 3 products live
Conventional
25% down · 7.5% · 30yr
- Down + closing
- —
- Monthly P&I
- —
- Monthly cashflow
- —
- DSCR
- —
- Eligible?
- —
Personal DTI + credit; lowest rate.
DSCR
20% down · 8.5% · 30yr
- Down + closing
- —
- Monthly P&I
- —
- Monthly cashflow
- —
- DSCR
- —
- Eligible?
- —
No personal income docs; deal must DSCR.
Hard money
10% down · 12.0% · 12mo
- Down + closing
- —
- Monthly P&I
- —
- Monthly cashflow
- —
- DSCR
- —
- Eligible?
- —
Short-term bridge; refi at stabilization.
Rent comps 2 comps
| Address | Beds | Baths | Sqft | Rent | $/sqft | DOM | Units | Dist |
|---|---|---|---|---|---|---|---|---|
| 101 Laura Ln Lillington, NC | 3.0 | 2.0 | 1140 | $1,290 | $1.13 | 25d | 1 | 0.52mi |
| 299 Emilies Crossing Way Lillington, NC | 3.0 | 2.0 | 1317 | $1,649 | $1.25 | 15d | 1 | 0.96mi |
Listing history 4 events
-
2026-06-07remarks 527-char remark
-
2026-06-07statusdays on market $169,000 Pending 3 DOM
-
2026-06-03remarks 427-char remark
-
2026-06-03$169,000 Active 1 DOM
ⓘ Source: listings_history table (triggers on properties + properties_extension) + one-shot
backfill from property_details.listing_events for pre-trigger history.
Tax reassessment forecast NC · Resets to sale price
- Current annual tax
- $1,369 · $114/mo
- Projected year-2 tax
- $1,386 · $115/mo
- Expected delta
- +$17/yr (+$1/mo · 1.2%)
ⓘ Screening estimate from a state-policy table — verify with the county assessor before closing.
Climate risk First Street
- Flood 1/10 Low FEMA zone X (unshaded) · 0% chance over 30 yrs
- Wildfire 4/10 Moderate
- Heat 7/10 Severe 7 d/yr ≥106°F today · 17 d/yr by 30 yrs out
- Wind 6/10 Major 69% chance of damaging wind over 30 yrs
- Air quality 2/10 Low 1 unhealthy d/yr today · 1 by 30 yrs out
Nearby sold comps map
Loading sold comps map…
Walkable amenities ~0.75 mi
Loading nearby amenities…
Taxation est. · year 1
- Rental income
- $20,659
- − Mortgage interest
- −$9,467
- − Property taxes
- −$1,369
- − Insurance
- −$845
- − Repairs & maintenance
- −$1,653
- − Management
- −$1,653
- − Depreciation
- −$4,916
- Taxable income
- $757
- Est. tax owed @ 24.0%
- −$182
- After-tax cash flow
- $3,290/yr
For passive investors: Depreciation is non-cash, so a rental often shows a tax loss while cash-flowing — sheltering income. Rental losses are passive: they offset passive income freely, and up to $25,000/yr can offset ordinary (W-2) income if you actively participate and your MAGI is under $100k (phasing out to $0 by $150k); unused losses carry forward. On sale, claimed depreciation is recaptured at up to 25%, and gains may owe capital-gains tax (a 1031 exchange can defer both). Figures are a year-1 estimate at your 24.0% rate — not tax advice; consult a CPA.
Schools (NCES district)
- District
- Harnett County Schools
- NCES district ID
- 3702010
- Math proficiency
- 31% ▼ -2.00%
- Reading proficiency
- 39% ▼ -1.00%
- Median HH income
- $45,400
- Composite
- 29.88/100
- National rank
- #6397
- State rank
- #130 of 178 in NC
Livability — Lillington
- Score
- 71/100
- State rank
- #101
- US rank
- #6653
Category grades
Schools grade is shown separately in the Schools card above.
Census & demographics
- Census place
- Lillington, NC
- County
- Harnett County · 125,715 people
- City population
- 21,419
- Metro
- Fayetteville, NC
- Population (ZIP)
- 21,419
- Household income
- $66,746
- Rent vs Own
- Severe rent burden
- 642.0
Population outlook (Harnett County) Hauer SSP2
- Today (2025)
- 153,758 people
- By 2030
- 166,581 · +8.3%
- By 2040
- 192,741 · +25.4%
- By 2050
- 218,332 · +42.0%
- By 2075
- 275,422 · +79.1%
- By 2100
- 313,511 · +103.9%
Race, ethnicity, and origin ACS 2023
- Neighborhood character
- Diverse neighborhood (Simpson 0.55)
- Race & ethnicity
- White 64% Black 16% Hispanic / Latino 14% Two or more races 9% Asian 1%
- Hispanic origin (detail)
- Mexican 8% Puerto Rican 3%
- Common ancestry
- Slovak 3% Serbian 2% Italian 2%
- Foreign-born
- 5% · Canada, Jamaica, China
- Languages at home
- 90% English-only · Spanish 9%
Political lean MEDSL · Harnett
- 2024 margin
- Strong R (+25.1) · D 36.9% · R 62.0% · Other 1.1%
- 2008→2024 swing
- -8.4pp toward R · 2008: -16.7pp · 2024: -25.1pp
- All cycles
- 2024: R+25.1 2020: R+22.4 2016: R+24.1 2012: R+19.4 2008: R+16.7
Not yet ingested
- Civics
- —
Market trends
- HPI YoY
- ▼ -33.35%
- Current HPI
- 198.2885
- Rent YoY
- —
- Metro
- Fayetteville, NC
- State GDP YoY
- ▲ 3.28%
- F500 in state
- 26
Industry mix (Fortune 500 HQ in NC)
| Industry | F500 HQs | Revenue |
|---|---|---|
| Financial Services | 2 | $213B |
|
||
| Retail | 2 | $95B |
|
||
| Industrial Conglomerate | 1 | $38B |
|
||
| Metals / Steel | 1 | $35B |
|
||
| Utilities | 1 | $30B |
|
||
| Industrial Machinery | 1 | $19B |
|
||
Price history
+111.2% since first listed2 events — show timeline
- 2026-06-03 Listed $169,000 TMLS
- 2021-08-13 Sold (Public Records) $80,000 Public Records
Property tax history
+5.3%/yrLatest (2025): $1,369 · +0.0% YoY. Source: county tax records.
Cash-flow waterfall
monthlySold comps — $/sqft
last 12 mo · ≤1 miLoading sold comps…