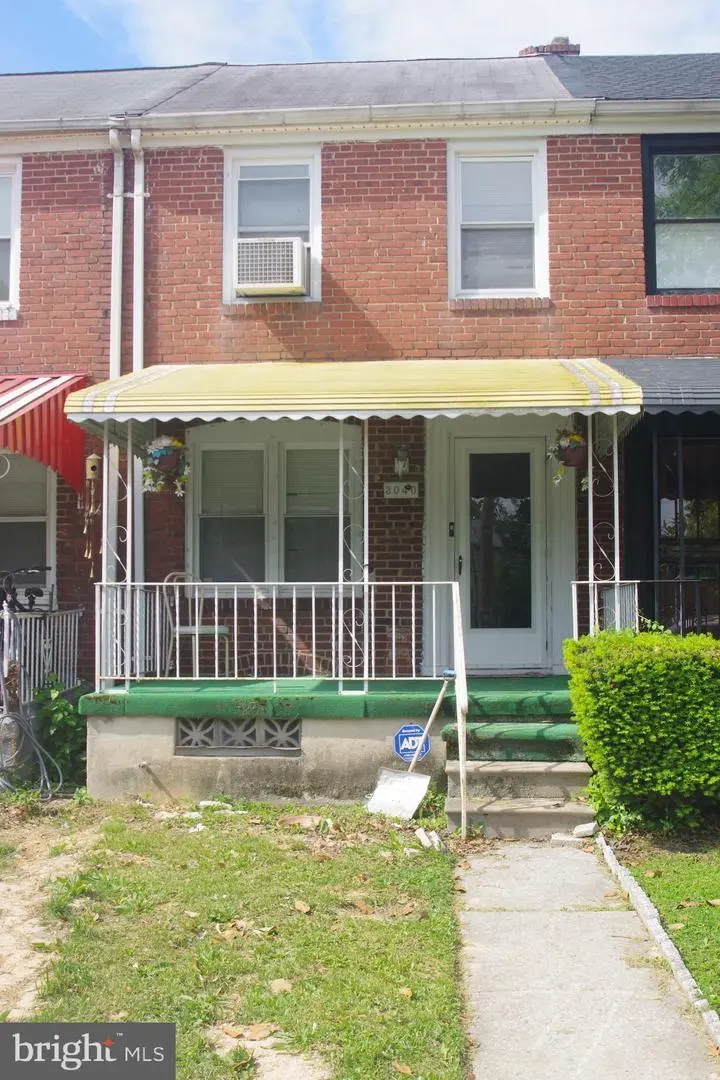
3040 Ascension St · Baltimore, MD
Flood risk 1/10 · Minimal
- FEMA flood zone
- X (unshaded)
- Chance of flooding over 30 yrs
- 0.0%
- Est. flood insurance / yr
- $473 – $860
Fire risk 1/10 · Minimal
- Est. fire insurance / yr
- $755 – $1,403
Heat risk 8/10 · Major
- Hot days now (above 102°F)
- 7 days/yr
- Hot days in 30 yrs
- 15 days/yr
Wind risk 6/10 · Moderate
- Chance of severe wind over 30 yrs
- 27.0%
Air-quality risk 4/10 · Minor
- Unhealthy air days now
- 5 days/yr
- Unhealthy air days in 30 yrs
- 7 days/yr
Risk factors via First Street. Map © Google.
Why this score? — see what drove the B+ grade
The composite is a weighted blend of 9 inputs, each scored 0–100. Each bar is that input's sub-score; the figure is the points it added to the 100-point composite (weight × sub-score).
- Cash flow +30.0/30.0
- ARV discount +15.0/15.0
- 1% rule +10.0/10.0
- DSCR +10.0/10.0
- Livability +3.8/5.0
- Rent growth +3.5/5.0
- Condition / age +2.5/5.0
- Schools +1.0/10.0
- Appreciation +0.0/10.0
$75,000
🖨 Deal sheet 📄 Offer letter ✓ Due diligence
Key facts
- Built 1944
- Listed 2 days
Property features AI
Exterior
- Parking: On-street parking
- Utilities: Public water; Public sewer; Natural gas for heating
- Home design: Interior townhouse/rowhouse; Fee simple ownership; Finished above-grade area approximately 756 (source: assessor)
- Construction: Brick construction; Slab foundation; Year built information from assessor
- Exterior features: Above grade and below grade structures noted; Not on tidal water; Total below-grade area approximately 378 (source: assessor)
Interior
- Kitchen: Gas oven/range
- Bedrooms: 2 bedrooms on the first upper level
- Bathrooms: 1 full bathroom
- Heating & cooling: Hot water baseboard heating; Window air conditioning units (electric)
- Interior features: Tub with shower; Attic; Level entry to main floor
- Laundry & utility: 60+ gallon hot water tank
Neighborhood map
What this means for you Summary
Snapshot
- This is a 2-bed/1.0-bath townhouse listed at $75k.
Deal economics
- At list price, monthly cash flow is $882 ($11k/yr) — positive.
- The deal already cash-flows at list — no discount required.
- Meets the 1% rule at list price ($2k rent vs $75k).
- Cap rate 20.4% vs local median 6.0% in Baltimore — top-decile yield for the area; either an underpriced asset or a hidden risk that comps aren't pricing in. Stress-test before assuming the spread holds.
Location & tenants
- Location reads 76/100 on livability (#90 in MD, #3,396 nationally) — a middle-class / working-renter tenant base. Strengths: amenities A+, commute A+, housing A+; Watch: schools D, crime F.
- Baltimore City Public Schools (urban): math 7% / reading 16% proficiency, ranked #24 of 24 in MD (top 100%) — low school quality limits family demand, transient renter base, plan for 1-2y turnover; 79% free/reduced lunch — lower-income household profile, screen leases tightly.
- Market conditions: Rents rising fast (+4.1%/yr); 165 active listings in the ZIP; 24 comparable units currently listed for rent nearby; rentals at typical pace (median 18d on market — plan ~3-4 weeks tenant-placement turnaround); 1,273 units permitted in Baltimore city in 2024 (1,104 in 5+ unit buildings).
- This rent runs 39% of the median local income ($54k/yr) — at the standard rent-burdened threshold; future hikes will face affordability resistance.
Forward outlook
- Local home prices are declining (-3.0%/yr); year-one equity from $519 of loan paydown is wiped out by about $2k of value loss. Plan a longer hold.
- Baltimore County population projected to shrink 4% by 2050 — rents likely to lag national; underwrite the cash flow, not the appreciation.
- At projected returns (-3.0% appreciation + 4.1% rent growth), your $21k cash investment doubles in ~3 years — after that, you're playing with house money.
Negotiation context
- Only 2 days on market — expect competitive offers; lowballing is unlikely to land.
Risks & watch-outs
- Watch-outs: built in 1944 — expect roof / HVAC / electrical / plumbing capex.
- Climate carrying-cost: major wind risk, 27% chance of damaging wind over 30y; extreme-heat days projected 7→15/yr by 2055 (HVAC capex compounding) — expect insurance premiums to compound above CPI over the hold.
Questions for the listing agent
- Built in 1944 — when were the roof, HVAC, electrical panel, plumbing, and water heater last replaced?
- Is there a deadline driving the sale (1031 exchange, divorce, estate, relocation)? That informs how much negotiation room exists.
- Schools are D-rated, which usually means shorter tenancies and higher turnover. Who's the typical renter profile here, and what's been the actual vacancy rate?
- Crime grade is F in this area — have there been break-ins, vandalism, or insurance claims at this property in the last 3 years? What carrier currently insures it and at what premium?
- What's the average days-on-market for RENTAL listings here right now (not sales)? A rising rental-DOM trend means longer vacancies and softer asking-rent achievability than the comps imply.
- What's the recent tenant-quality profile in this submarket — average credit score on applications, eviction rate, late-payment / NSF rate, and stable-employment percentage? A property-management company in the area should have these aggregated.
- How much new for-sale + rental construction is in the pipeline within 1–3 miles? Heavy new supply typically softens prices + rents 12–24 months out; constrained supply supports both.
Investment metrics
- 1% rule
- 2.33% ✓
- Cap rate
- 20.41%
- Cash-on-cash
- 50.41%
- DSCR
- 3.24
- GRM
- 3.6
CMA / ARV
- ARV (on-the-fly)
- $99,792
- Comps found
- 12
Show comp detail 12 sales within ~0.75 mi
| Address | Dist | Beds/Ba | Sqft | Sold | Price | $/sf | Match |
|---|---|---|---|---|---|---|---|
| 3040 Ascension St | 0.00mi | 2/1.0 | 756 (0%) | 1mo | $75,000 | $99 | 100 |
| 3051 Ascension St | 0.04mi | 2/1.0 | 756 (0%) | 6mo | $100,000 | $132 | 93 |
| 443 Roundview Rd | 0.10mi | 2/1.0 | 756 (0%) | 14mo | $90,000 | $119 | 84 |
| 403 Seagull Ave | 0.09mi | 2/1.5 | 756 (0%) | 14mo | $170,000 | $225 | 82 |
| 462 Roundview Rd | 0.08mi | 2/1.0 | 756 (0%) | 17mo | $71,000 | $94 | 82 |
| 504 Bridgeview Rd | 0.14mi | 2/1.0 | 756 (0%) | 18mo | $100,000 | $132 | 79 |
| 2715 Bookert Dr | 0.45mi | 2/1.0 | 756 (0%) | 3mo | $125,000 | $165 | 77 |
| 2737 Bookert Dr | 0.44mi | 2/1.0 | 756 (0%) | 4mo | $90,000 | $119 | 76 |
| 2820 Bookert Dr | 0.47mi | 2/1.0 | 756 (0%) | 6mo | $85,000 | $112 | 73 |
| 2856 Bookert Dr | 0.49mi | 2/1.0 | 756 (0%) | 12mo | $105,000 | $139 | 67 |
| 2805 Bookert Dr | 0.44mi | 2/2.0 | 756 (0%) | 12mo | $164,900 | $218 | 66 |
| 2712 Woodview Rd | 0.41mi | 3/1.0 (+1) | 774 (+2%) | 17mo | $150,000 | $194 | 58 |
Match score weights: distance 35% · size 25% · config 20% · recency 20%. Top-matched comps best support the ARV.
Projected returns pro-forma
-3.0% appreciation · 4.08% rent growth · sell at horizon
- IRR
- 49.4%
- Equity multiple
- 3.19×
- Total profit
- $45,974
- Equity at exit
- $11,183
- IRR
- 55.3%
- Equity multiple
- 6.74×
- Total profit
- $120,513
- Equity at exit
- $6,485
Cash invested: $21,000 (down + closing). Projections, not guarantees.
Landlord ↔ Tenant lean methodology
- Overall (CITY)
- 12 Strongly Tenant-Friendly
- State Maryland
- 27 Tenant-Leaning · D+14
- County
- — inherits STATE
- City Baltimore
- 12 Strongly Tenant-Friendly · D+58
ZIP-level market 21225
- Home prices YoY
- -31.9%
- Rents YoY
- 4.1%
- Active inventory
- 165
- Price-to-rent
- 3.6×
Monthly cashflow live
- Estimated rent
- $1,750 high interval (Pro) →
- Mortgage (P&I)
- −$393
- Tax from tax record
- −$76 /mo · $912/yr
- Insurance
- −$31
- HOA
- −$0
- Vacancy / Maint / Mgmt
- −$368
- Net cashflow
- $882
Break-even live
UW: 25.0% down · 7.5% · 30yr · 1.5% tax · 5.0% vac · 8.0% maint · 8.0% mgmt
Financing live
Cash to close
- Down payment
- $18,750
- Closing costs
- $2,250
- Reserves months
- —
- Total cash needed
- —
Loan-product check · same deal, 3 products live
Conventional
25% down · 7.5% · 30yr
- Down + closing
- —
- Monthly P&I
- —
- Monthly cashflow
- —
- DSCR
- —
- Eligible?
- —
Personal DTI + credit; lowest rate.
DSCR
20% down · 8.5% · 30yr
- Down + closing
- —
- Monthly P&I
- —
- Monthly cashflow
- —
- DSCR
- —
- Eligible?
- —
No personal income docs; deal must DSCR.
Hard money
10% down · 12.0% · 12mo
- Down + closing
- —
- Monthly P&I
- —
- Monthly cashflow
- —
- DSCR
- —
- Eligible?
- —
Short-term bridge; refi at stabilization.
Rent comps 24 comps
| Address | Beds | Baths | Sqft | Rent | $/sqft | DOM | Units | Dist |
|---|---|---|---|---|---|---|---|---|
| 511 Seagull Ave Brooklyn, MD | 2.0 | 1.0 | 756 | $1,550 | $2.05 | 23d | 1 | 0.09mi |
| 2868 Potee St Baltimore, MD | 1.0–3.0 | 1.0 | 720 | $1,392 | $1.93 | 2d | 22 | 0.28mi |
| 2454 Terra Firma Rd Brooklyn, MD | 3.0 | 1.0 | 1024 | $1,650 | $1.61 | 14d | 1 | 0.38mi |
| 2745 Round Rd Brooklyn, MD | 2.0 | 2.0 | 756 | $1,800 | $2.38 | 43d | 1 | 0.49mi |
| 2500 Insulator Dr Baltimore, MD | 3.0 | 1.0–2.0 | 988 | $3,816 | $3.86 | 2d | 152 | 0.94mi |
| 217 W Edgevale Rd Brooklyn, MD | 3.0 | 1.5 | 992 | $1,800 | $1.81 | 23d | 1 | 0.96mi |
| 3513 Horton Ave Brooklyn, MD | 3.0 | 1.0 | 1020 | $1,600 | $1.57 | 17d | 1 | 1.01mi |
| 3010 Alabama Ave Halethorpe, MD | 2.0 | 1.0 | 900 | $2,200 | $2.44 | 17d | 1 | 1.04mi |
| 205 Arundel Rd W Brooklyn, MD | 1.0 | 1.0 | 608 | $1,200 | $1.97 | 43d | 1 | 1.11mi |
| 520 Baltic Ave Unit B Baltimore, MD | 1.0 | 1.0 | 800 | $1,050 | $1.31 | 43d | 1 | 1.14mi |
| 2450 Rye St Baltimore, MD | 2.0 | 1.0–2.0 | 926 | $3,789 | $4.09 | 1d | 31 | 1.20mi |
| 3528 6th St Brooklyn, MD | 2.0 | 2.5 | 1060 | $1,500 | $1.42 | 17d | 1 | 1.21mi |
| 250 Mission Blvd Baltimore, MD | 2.0 | 1.0–2.0 | 790 | $3,406 | $4.31 | 1d | 21 | 1.22mi |
| 507 Washburn Ave Brooklyn, MD | 3.0 | 1.5 | 1024 | $2,500 | $2.44 | 20d | 1 | 1.29mi |
| 507 Washburn Ave Brooklyn, MD | 3.0 | 1.5 | 1024 | $2,500 | $2.44 | 4d | 1 | 1.29mi |
| 507 Washburn Ave Brooklyn, MD | 3.0 | 1.5 | 1024 | $2,500 | $2.44 | 23d | 1 | 1.29mi |
| 4207 3rd St Unit 3 Brooklyn, MD | 2.0 | 1.0 | 850 | $1,595 | $1.88 | 4d | 1 | 1.33mi |
| 1900 S Hanover St Baltimore, MD | 3.0 | 1.0–2.0 | 875 | $3,119 | $3.56 | 1d | 66 | 1.35mi |
| 103 E Wells St Baltimore, MD | 1.0–2.0 | 1.0 | 1008 | $2,415 | $2.39 | 2d | 11 | 1.40mi |
| 4400 4th St Unit BASEMENT Baltimore, MD | 2.0 | 1.0 | 925 | $1,350 | $1.46 | 43d | 1 | 1.43mi |
| 111 W Heath St Baltimore, MD | 2.0 | 1.0–2.5 | 1263 | $2,850 | $2.26 | 3d | 7 | 1.46mi |
| 3840 8th St Brooklyn, MD | 3.0 | 1.5 | 1088 | $1,606 | $1.48 | 4d | 1 | 1.47mi |
| 1705 Olive St Baltimore, MD | 2.0 | 2.0 | 648 | $2,500 | $3.86 | 20d | 1 | 1.48mi |
| 2200 W Patapsco Ave Baltimore, MD | 3.0 | 1.0 | 890 | $1,569 | $1.76 | 43d | 1 | 1.48mi |
Listing history 3 events
-
2026-05-15status Pending
-
2026-05-14$75,000 Active
-
2026-05-13historical $75,000
ⓘ Source: listings_history table (triggers on properties + properties_extension) + one-shot
backfill from property_details.listing_events for pre-trigger history.
Tax reassessment forecast MD · Partial reset (capped growth)
- Current annual tax
- $912 · $76/mo
- Projected year-2 tax
- $912 · $76/mo
- Expected delta
- $0/yr ($0/mo · 0.0%)
ⓘ Screening estimate from a state-policy table — verify with the county assessor before closing.
Climate risk First Street
- Flood 1/10 Low FEMA zone X (unshaded) · 0% chance over 30 yrs
- Wildfire 1/10 Low
- Heat 8/10 Severe 7 d/yr ≥102°F today · 15 d/yr by 30 yrs out
- Wind 6/10 Major 27% chance of damaging wind over 30 yrs
- Air quality 4/10 Moderate 5 unhealthy d/yr today · 7 by 30 yrs out
Nearby sold comps map
Loading sold comps map…
Walkable amenities ~0.75 mi
Loading nearby amenities…
Taxation est. · year 1
- Rental income
- $21,004
- − Mortgage interest
- −$4,201
- − Property taxes
- −$912
- − Insurance
- −$375
- − Repairs & maintenance
- −$1,680
- − Management
- −$1,680
- − Depreciation
- −$2,182
- Taxable income
- $9,974
- Est. tax owed @ 24.0%
- −$2,394
- After-tax cash flow
- $8,193/yr
For passive investors: Depreciation is non-cash, so a rental often shows a tax loss while cash-flowing — sheltering income. Rental losses are passive: they offset passive income freely, and up to $25,000/yr can offset ordinary (W-2) income if you actively participate and your MAGI is under $100k (phasing out to $0 by $150k); unused losses carry forward. On sale, claimed depreciation is recaptured at up to 25%, and gains may owe capital-gains tax (a 1031 exchange can defer both). Figures are a year-1 estimate at your 24.0% rate — not tax advice; consult a CPA.
Schools (NCES district)
- District
- Baltimore City Public Schools
- NCES district ID
- 2400090
- Math proficiency
- 7% ▼ -9.00%
- Reading proficiency
- 16% ▼ -5.00%
- Median HH income
- $42,108
- Composite
- 10.08/100
- National rank
- #9805
- State rank
- #24 of 24 in MD
Livability — Baltimore
- Score
- 76/100
- State rank
- #90
- US rank
- #3396
Category grades
Schools grade is shown separately in the Schools card above.
Census & demographics
- Census place
- Baltimore, MD
- County
- Anne Arundel County · 535,653 people
- City population
- 588,727
- Metro
- Baltimore-Columbia-Towson, MD
- Population (ZIP)
- 34,062
- Household income
- $54,020
- Rent vs Own
- Severe rent burden
- 1440.0
Population outlook (Baltimore County) Hauer SSP2
- Today (2025)
- 624,249 people
- By 2030
- 621,541 · -0.4%
- By 2040
- 609,756 · -2.3%
- By 2050
- 597,249 · -4.3%
- By 2075
- 552,236 · -11.5%
- By 2100
- 513,934 · -17.7%
Race, ethnicity, and origin ACS 2023
- Neighborhood character
- Diverse neighborhood (Simpson 0.68)
- Race & ethnicity
- Black 42% White 32% Hispanic / Latino 20% Two or more races 8% Native American 3% Asian 2%
- Hispanic origin (detail)
- Mexican 5% Puerto Rican 1%
- Common ancestry
- Romanian 2% Lithuanian 1% Iranian 1%
- Foreign-born
- 12% · Canada, China
- Languages at home
- 81% English-only · Spanish 16% Other Indo-European 1% French/Haitian/Cajun 1%
Political lean MEDSL · Baltimore
- 2024 margin
- Solid D (+73.0) · D 85.2% · R 12.2% · Other 2.6%
- 2008→2024 swing
- -2.5pp toward R · 2008: 75.5pp · 2024: 73.0pp
- All cycles
- 2024: D+73.0 2020: D+76.6 2016: D+74.6 2012: D+76.4 2008: D+75.5
Not yet ingested
- Civics
- —
Market trends
- HPI YoY
- ▼ -119.44%
- Current HPI
- 254.5089
- Rent YoY
- ▲ 4.08%
- Metro
- Baltimore-Columbia-Towson, MD
- State GDP YoY
- ▲ 2.97%
- F500 in state
- 12
Industry mix (Fortune 500 HQ in MD)
| Industry | F500 HQs | Revenue |
|---|---|---|
| Aerospace / Defense | 1 | $71B |
|
||
| Utilities | 1 | $25B |
|
||
| Hotels | 1 | $24B |
|
||
| Consumer Goods | 1 | $7B |
|
||
| Real Estate | 1 | $6B |
|
||
| Chemicals | 1 | $2B |
|
||
Price history
+0.0% since first listed3 events — show timeline
- 2026-05-15 Pending — BRIGHT MLS
- 2026-05-14 Listed $75,000 BRIGHT MLS
- 2026-05-13 Coming Soon $75,000 BRIGHT MLS
Property tax history
-4.0%/yrLatest (2025): $912 · +5.6% YoY. Source: county tax records.
Cash-flow waterfall
monthlySold comps — $/sqft
last 12 mo · ≤1 miLoading sold comps…