 🌊 Lakefront
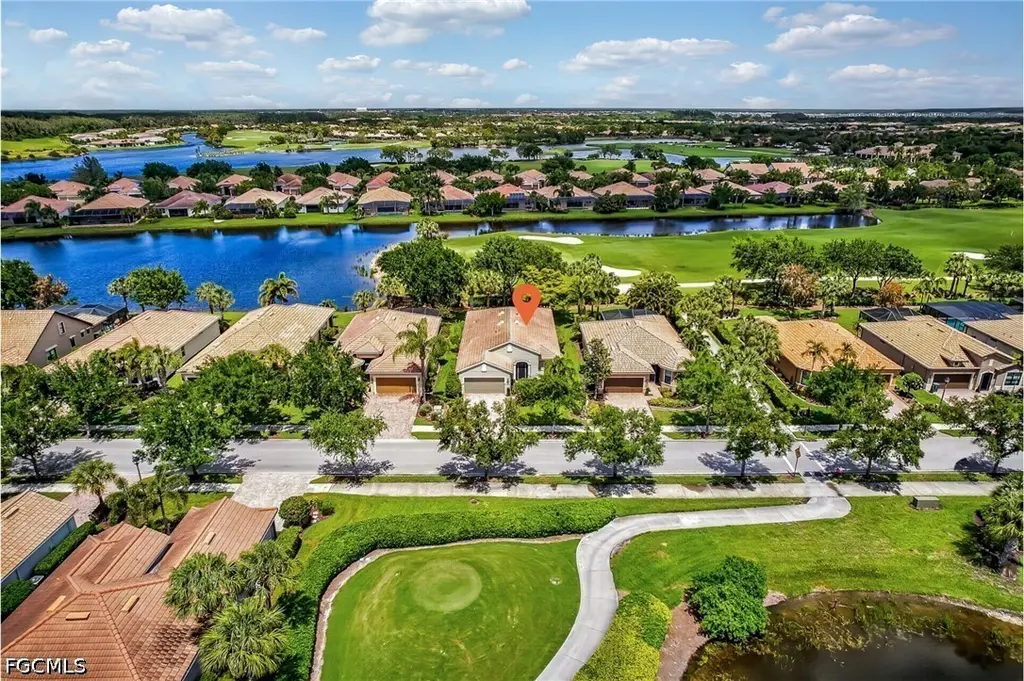
6377 Liberty St · Ave Maria, FL
Flood risk 1/10 · Minimal
- FEMA flood zone
- X (unshaded)
- Chance of flooding over 30 yrs
- 0.0%
- Est. flood insurance / yr
- $507 – $1,088
Fire risk 3/10 · Minor
- Est. fire insurance / yr
- $947 – $1,759
Heat risk 10/10 · Severe
- Hot days now (above 112°F)
- 7 days/yr
- Hot days in 30 yrs
- 29 days/yr
Wind risk 10/10 · Severe
- Chance of severe wind over 30 yrs
- 99.0%
Air-quality risk 2/10 · Minimal
- Unhealthy air days now
- 0 days/yr
- Unhealthy air days in 30 yrs
- 1 days/yr
Risk factors via First Street. Map © Google.
Why this score? — see what drove the C+ grade
The composite is a weighted blend of 9 inputs, each scored 0–100. Each bar is that input's sub-score; the figure is the points it added to the 100-point composite (weight × sub-score).
- Cash flow +22.5/30.0
- ARV discount +7.5/15.0
- DSCR +7.2/10.0
- 1% rule +7.1/10.0
- Schools +5.0/10.0
- Appreciation +4.5/10.0
- Rent growth +3.2/5.0
- Livability +2.5/5.0
- Condition / age +2.5/5.0
$415,000
🖨 Deal sheet 📄 Offer letter ✓ Due diligence
Listing remarks
Gorgeous view of the Panther Run Golf Club's 10th hole and side view of large lake! This Martin Ray Model offers a sprawling layout w/ great room design, gourmet kitchen w/ butler pantry, tile flooring in main living area, picture windows, custom window systems, split bedroom floor plan, screened front entry, huge master suite, dining area & breakfast bar, den/home office w/ French door entry, laundry room w/ cabinetry & utility sink, attached 2-car garage w/ a 4ft extension, and screened rear lanai w/ enough room for lounging area & dining set. Recent updates include- freshly painted interior, new appliances (except for the dishwasher), new carpet in the master bedroom, a
Key facts
- View of large lake
- Picture windows
- Gourmet kitchen
Tags
Property features AI
Finance
- Financial info: Pets allowed with conditions (contact for details)
- HOA & community: Homeowners association (quarterly fees); Association fee includes cable TV and grounds maintenance; Community amenities: clubhouse, fitness center, pool, spa/hot tub, tennis and pickleball courts, basketball court, bocce court, playground, dog park, golf course/putting greens, barbecue/picnic areas, sidewalks, trails, park, management, sidewalks, street lights
Exterior
- Parking: Attached 2-car garage; Driveway with paved parking; Garage door opener; Two covered parking spaces
- Security: Gated community with security gate; Smoke detectors
- Utilities: Public water; Public sewer; Cable available; High-speed internet available; Underground utilities; Irrigation using reclaimed water
- Home design: Single-story home; Tile roof; Block, concrete and stucco construction; Entry level: 1; Resale property; Faces southwest; Has a view
- Construction: Built with block, concrete and stucco; Tile roof
- Exterior features: Patio; Lanai/screened porch (16 x 11); Room for pool; Sprinkler/irrigation system; Shutters (electric and manual); Rectangular landscaped lot; Automatic sprinklers; Paved road access; Northeast exposure; Community pool
Interior
- Kitchen: Dryer; Dishwasher; Electric cooktop; Freezer; Disposal; Microwave; Range; Refrigerator; Self-cleaning oven
- Bedrooms: Master bedroom (16 x 18); Bedroom (10 x 13); Bedroom (14 x 14)
- Flooring: Carpet; Tile; Wood
- Bathrooms: 2 full bathrooms; Dual sinks in at least one bathroom; Separate shower(s)
- Heating & cooling: Central heating (electric); Central air conditioning (electric); Ceiling fans
- Interior features: Breakfast bar; Dual sinks; Entrance foyer; French doors/atrium doors; Kitchen island; Open living/dining area; Pantry; Shower-only bathroom with separate shower; Cable TV available; Walk-in pantry; Walk-in closet(s); Window treatments; High-speed internet available; Split bedrooms; Single hung and sliding windows
- Laundry & utility: Washer; Laundry tub; Utility room (7 x 8)
Neighborhood map
What this means for you Summary
Snapshot
- This is a 3-bed/2.0-bath single-family listed at $415k.
Deal economics
- At list price, monthly cash flow is $700 ($8k/yr) — positive.
- The deal already cash-flows at list — no discount required.
- Meets the 1% rule at list price ($5k rent vs $415k).
- Recommended offer: $390k (6.0% below list) — sets the bar for market timing.
Location & tenants
- Location reads: area grade C — affects rentability + tenant quality, not the cash-flow math above.
- Collier (suburban): math 60% / reading 56% proficiency, ranked #16 of 73 in FL (top 22%) — acceptable for families but not a draw, mixed tenant base, ~2y average lease.
- Market conditions: Rents rising (+3.0%/yr); 449 active listings in the ZIP; 35 comparable units currently listed for rent nearby; rentals at typical pace (median 24d on market — plan ~3-4 weeks tenant-placement turnaround); 3,520 units permitted in Collier County in 2024 (959 in 5+ unit buildings).
- At $5,010/mo this rent would consume 96% of the median local household income ($62k/yr) (locally 1093% of renters already pay >50% of income on rent) — very limited rent-growth headroom before tenants either downsize or default.
Forward outlook
- Local home prices are declining (-1.1%/yr); year-one equity from $3k of loan paydown is wiped out by about $4k of value loss. Plan a longer hold.
- Collier County population projected at +30% by 2050 — long-run rental-demand tailwind backs the buy-and-hold thesis.
- At projected returns (-1.1% appreciation + 3.0% rent growth), your $116k cash investment doubles in ~10 years — after that, you're playing with house money.
Negotiation context
- It's been on market 63 days — a 6% lower offer ($390k) is reasonable based on typical stale-listing flexibility.
- 3 sale attempts; this cycle's ask has dropped $24k (5%) from the opening price — seller is motivated, your offer sets the floor, not the list.
Risks & watch-outs
- Climate carrying-cost: severe wind risk, 99% chance of damaging wind over 30y; extreme-heat days projected 7→29/yr by 2055 (HVAC capex compounding) — expect insurance premiums to compound above CPI over the hold.
Questions for the listing agent
- It's been on market 63 days. Have you received any prior offers? Is the seller open to a 6% concession, seller financing, or rate buy-down credit?
- What does the HOA fee cover, when was the last increase, and are there any pending special assessments or reserve-fund shortfalls?
- Why hasn't it sold? Are there any deal-killer items the seller is aware of (foundation, flood, title, zoning, code violations)?
- Is there a deadline driving the sale (1031 exchange, divorce, estate, relocation)? That informs how much negotiation room exists.
- This sits on a lake — are riparian / water-frontage rights deeded with the parcel? Any dock permits, shoreline easements, or HOA water-use restrictions?
- What's the documented flood / surge / shoreline-erosion history here (FEMA AND non-FEMA — e.g., storm surge, creek backup, septic-field saturation)?
- Any water-quality or seasonal algae-bloom issues that affect tenant satisfaction or short-term-rental demand?
- What's the average days-on-market for RENTAL listings here right now (not sales)? A rising rental-DOM trend means longer vacancies and softer asking-rent achievability than the comps imply.
- What's the recent tenant-quality profile in this submarket — average credit score on applications, eviction rate, late-payment / NSF rate, and stable-employment percentage? A property-management company in the area should have these aggregated.
- How much new for-sale + rental construction is in the pipeline within 1–3 miles? Heavy new supply typically softens prices + rents 12–24 months out; constrained supply supports both.
Investment metrics
- 1% rule
- 1.21% ✓
- Cap rate
- 8.32%
- Cash-on-cash
- 7.22%
- DSCR
- 1.32
- GRM
- 6.9
CMA / ARV
No comps found within radius.
Projected returns pro-forma
-1.05% appreciation · 2.95% rent growth · sell at horizon
- IRR
- 2.4%
- Equity multiple
- 1.11×
- Total profit
- $12,466
- Equity at exit
- $99,216
- IRR
- 9.0%
- Equity multiple
- 1.87×
- Total profit
- $101,347
- Equity at exit
- $103,369
Cash invested: $116,200 (down + closing). Projections, not guarantees.
Landlord ↔ Tenant lean methodology
- Overall (STATE)
- 87 Strongly Landlord-Friendly
- State Florida
- 87 Strongly Landlord-Friendly · R+3
- County
- — inherits STATE
- City
- — inherits STATE
ZIP-level market 34142
- Home prices YoY
- -0.5%
- Rents YoY
- 3.0%
- Active inventory
- 449
- Price-to-rent
- 6.9×
Monthly cashflow live
- Estimated rent
- $5,010 high interval (Pro) →
- Mortgage (P&I)
- −$2,176
- Tax from tax record
- −$420 /mo · $5,041/yr
- Insurance
- −$173
- HOA
- −$489
- Vacancy / Maint / Mgmt
- −$1,052
- Net cashflow
- $700
Break-even live
UW: 25.0% down · 7.5% · 30yr · 1.5% tax · 5.0% vac · 8.0% maint · 8.0% mgmt
Financing live
Cash to close
- Down payment
- $103,750
- Closing costs
- $12,450
- Reserves months
- —
- Total cash needed
- —
Loan-product check · same deal, 3 products live
Conventional
25% down · 7.5% · 30yr
- Down + closing
- —
- Monthly P&I
- —
- Monthly cashflow
- —
- DSCR
- —
- Eligible?
- —
Personal DTI + credit; lowest rate.
DSCR
20% down · 8.5% · 30yr
- Down + closing
- —
- Monthly P&I
- —
- Monthly cashflow
- —
- DSCR
- —
- Eligible?
- —
No personal income docs; deal must DSCR.
Hard money
10% down · 12.0% · 12mo
- Down + closing
- —
- Monthly P&I
- —
- Monthly cashflow
- —
- DSCR
- —
- Eligible?
- —
Short-term bridge; refi at stabilization.
Rent comps 35 comps
| Address | Beds | Baths | Sqft | Rent | $/sqft | DOM | Units | Dist |
|---|---|---|---|---|---|---|---|---|
| 6140 Victory Dr Ave Maria, FL | 3.0 | 3.0 | 2496 | $5,000 | $2.00 | 23d | 1 | 0.09mi |
| 6421 Liberty St Ave Maria, FL | 3.0 | 2.0 | 1922 | $5,800 | $3.02 | 23d | 1 | 0.13mi |
| 6441 Liberty St Ave Maria, FL | 3.0 | 2.0 | 1685 | $5,795 | $3.44 | 23d | 1 | 0.18mi |
| 5988 Mayflower Way Ave Maria, FL | 2.0 | 2.0 | 1602 | $5,200 | $3.25 | 23d | 1 | 0.43mi |
| 5935 Mayflower Way Ave Maria, FL | 2.0 | 2.0 | 1460 | $2,550 | $1.75 | 23d | 1 | 0.52mi |
| 6168 Harmony Dr Immokalee, FL | 3.0 | 2.0 | 1570 | $5,495 | $3.50 | 13d | 1 | 0.71mi |
| 5709 Constitution St Ave Maria, FL | 2.0 | 2.0 | 1900 | $2,400 | $1.26 | 23d | 1 | 0.72mi |
| 5728 Mayflower Way Ave Maria, FL | 3.0 | 3.0 | 2087 | $2,650 | $1.27 | 23d | 1 | 0.74mi |
| 5769 Mayflower Way Ave Maria, FL | 2.0 | 2.0 | 1554 | $4,000 | $2.57 | 23d | 1 | 0.75mi |
| 6189 Harmony Dr Immokalee, FL | 3.0 | 2.0 | 1558 | $6,295 | $4.04 | 23d | 1 | 0.76mi |
| 5939 Gala Dr Immokalee, FL | 3.0 | 3.0 | 2300 | $5,995 | $2.61 | 23d | 1 | 0.77mi |
| 6205 Harmony Dr Immokalee, FL | 3.0 | 2.0 | 1558 | $5,000 | $3.21 | 23d | 1 | 0.78mi |
| 5705 Mayflower Way #1407 Ave Maria, FL | 2.0 | 2.0 | 1536 | $2,250 | $1.46 | 23d | 1 | 0.81mi |
| 5697 Mayflower Way Ave Maria, FL | 2.0 | 2.0 | 1538 | $2,495 | $1.62 | 23d | 1 | 0.89mi |
| 5690 Mayflower Way #601 Ave Maria, FL | 3.0 | 2.0 | 1815 | $5,500 | $3.03 | 23d | 1 | 0.93mi |
| 5690 Mayflower Way Ave Maria, FL | 3.0 | 2.0 | 1815 | $3,295 | $1.82 | 23d | 1 | 0.94mi |
| 8010 Helena Ct Ave Maria, FL | 2.0 | 2.0 | 1554 | $2,500 | $1.61 | 21d | 1 | 1.13mi |
| 6075 Artisan Ct Ave Maria, FL | 3.0 | 3.0 | 2799 | $11,995 | $4.29 | 21d | 1 | 1.16mi |
| 6082 Artisan Ct Ave Maria, FL | 3.0 | 3.0 | 2799 | $11,995 | $4.29 | 21d | 1 | 1.21mi |
| 6036 Ellerston WAY #1311 Ave Maria, FL | 3.0 | 2.0 | 1741 | $4,490 | $2.58 | 23d | 1 | 1.23mi |
| 5704 Melbourne Ct #6712 Ave Maria, FL | 3.0 | 2.0 | 1741 | $7,295 | $4.19 | 23d | 1 | 1.23mi |
| 6012 Ellerston WAY #1121 Ave Maria, FL | 3.0 | 2.0 | 2110 | $6,295 | $2.98 | 23d | 1 | 1.23mi |
| 5445 Double Eagle Cir #3011 Ave Maria, FL | 2.0 | 2.0 | 1569 | $2,495 | $1.59 | 23d | 1 | 1.23mi |
| 5710 Melbourne Ct #6511 Ave Maria, FL | 3.0 | 2.0 | 1741 | $7,295 | $4.19 | 23d | 1 | 1.23mi |
| 6003 Diamonte Pl Ave Maria, FL | 3.0 | 2.5 | 2395 | $11,995 | $5.01 | 23d | 1 | 1.27mi |
| 5309 Beckton Rd Ave Maria, FL | 3.0 | 2.5 | 2051 | $2,395 | $1.17 | 23d | 1 | 1.29mi |
| 6023 Diamonte Pl Ave Maria, FL | 3.0 | 3.0 | 2379 | $4,995 | $2.10 | 23d | 1 | 1.32mi |
| 5476 Katia Ct Ave Maria, FL | 3.0 | 2.5 | 1983 | $4,300 | $2.17 | 23d | 1 | 1.37mi |
| 5909 Berwick Ln Ave Maria, FL | 2.0 | 2.0 | 1850 | $10,995 | $5.94 | 23d | 1 | 1.40mi |
| 6023 Ellerston Way #1823 Ave Maria, FL | 3.0 | 2.0 | 1695 | $2,995 | $1.77 | 23d | 1 | 1.42mi |
| 5538 Useppa Dr Ave Maria, FL | 2.0 | 2.5 | 1850 | $10,995 | $5.94 | 23d | 1 | 1.43mi |
| 5937 Berwick Ln Ave Maria, FL | 3.0 | 2.0 | 2061 | $4,995 | $2.42 | 23d | 1 | 1.45mi |
| 5435 Pikewood Ct Ave Maria, FL | 2.0 | 2.5 | 1850 | $3,695 | $2.00 | 21d | 1 | 1.46mi |
| 5938 Berwick Ln Ave Maria, FL | 3.0 | 3.0 | 2247 | $10,995 | $4.89 | 23d | 1 | 1.48mi |
| 5515 Whistling Straights Ct Ave Maria, FL | 3.0 | 2.5 | 2419 | $6,500 | $2.69 | 21d | 1 | 1.49mi |
HOA detail
- Monthly dues
- $489 · $5,868/yr
Listing history 22 events
-
2026-06-18days on market $415,000 Active 63 DOM
-
2026-06-17days on market $415,000 Active 62 DOM
-
2026-06-16days on market $415,000 Active 61 DOM
-
2026-06-15price $415,000 Active 60 DOM
-
2026-06-15days on market $425,000 Active 60 DOM
-
2026-06-14days on market $425,000 Active 58 DOM
-
2026-06-10days on market $425,000 Active 55 DOM
-
2026-06-09days on market $425,000 Active 54 DOM
-
2026-06-08days on market $425,000 Active 53 DOM
-
2026-06-07days on market $425,000 Active 52 DOM
-
2026-06-03days on market $425,000 Active 48 DOM
-
2026-06-02days on market $425,000 Active 47 DOM
-
2026-06-01days on market $425,000 Active 46 DOM
-
2026-05-31days on market $425,000 Active 45 DOM
-
2026-05-30days on market $425,000 Active 44 DOM
-
2026-05-14price $425,000
-
2026-04-16$439,000 Active
-
2026-03-31historical
-
2026-01-29price $454,000
-
2025-12-22$479,000 Active
-
2025-11-19historical
-
2025-08-20$494,900 Active
ⓘ Source: listings_history table (triggers on properties + properties_extension) + one-shot
backfill from property_details.listing_events for pre-trigger history.
Tax reassessment forecast FL · Resets to sale price
- Current annual tax
- $5,041 · $420/mo
- Projected year-2 tax
- $5,041 · $420/mo
- Expected delta
- $0/yr ($0/mo · 0.0%)
ⓘ Screening estimate from a state-policy table — verify with the county assessor before closing.
Climate risk First Street
- Flood 1/10 Low FEMA zone X (unshaded) · 0% chance over 30 yrs
- Wildfire 3/10 Moderate
- Heat 10/10 Extreme 7 d/yr ≥112°F today · 29 d/yr by 30 yrs out
- Wind 10/10 Extreme 99% chance of damaging wind over 30 yrs
- Air quality 2/10 Low 0 unhealthy d/yr today · 1 by 30 yrs out
Nearby sold comps map
Loading sold comps map…
Walkable amenities ~0.75 mi
Loading nearby amenities…
Taxation est. · year 1
- Rental income
- $60,119
- − Mortgage interest
- −$23,246
- − Property taxes
- −$5,041
- − Insurance
- −$2,075
- − Repairs & maintenance
- −$4,810
- − Management
- −$4,810
- − HOA
- −$5,868
- − Depreciation
- −$12,073
- Taxable income
- $2,197
- Est. tax owed @ 24.0%
- −$527
- After-tax cash flow
- $7,867/yr
For passive investors: Depreciation is non-cash, so a rental often shows a tax loss while cash-flowing — sheltering income. Rental losses are passive: they offset passive income freely, and up to $25,000/yr can offset ordinary (W-2) income if you actively participate and your MAGI is under $100k (phasing out to $0 by $150k); unused losses carry forward. On sale, claimed depreciation is recaptured at up to 25%, and gains may owe capital-gains tax (a 1031 exchange can defer both). Figures are a year-1 estimate at your 24.0% rate — not tax advice; consult a CPA.
Schools (NCES district)
- District
- Collier
- NCES district ID
- 1200330
- Math proficiency
- 60% ▼ -4.00%
- Reading proficiency
- 56% ▼ -2.00%
- Median HH income
- $58,275
- Composite
- 50.23/100
- National rank
- #1892
- State rank
- #16 of 73 in FL
Livability — Ave Maria
No livability data for this city. (Only ~50 U.S. cities are tracked.)
Census & demographics
- Census place
- Ave Maria, FL
- County
- Collier County · 396,295 people
- Metro
- Naples-Marco Island, FL
- Population (ZIP)
- 35,149
- Household income
- $62,333
- Rent vs Own
- Severe rent burden
- 1093.0
Population outlook (Collier County) Hauer SSP2
- Today (2025)
- 420,858 people
- By 2030
- 450,054 · +6.9%
- By 2040
- 502,232 · +19.3%
- By 2050
- 544,932 · +29.5%
- By 2075
- 627,203 · +49.0%
- By 2100
- 659,015 · +56.6%
Race, ethnicity, and origin ACS 2023
- Neighborhood character
- Majority Hispanic (63%)
- Race & ethnicity
- Hispanic / Latino 63% Two or more races 39% Black 19% White 16% Native American 7%
- Hispanic origin (detail)
- Mexican 43% Puerto Rican 3% Cuban 2% Dominican 1%
- Common ancestry
- Hispanic 8% Slovak 1% Serbian 1%
- Foreign-born
- 32% · Canada, Jamaica
- Languages at home
- 34% English-only · Spanish 53% French/Haitian/Cajun 12%
Political lean MEDSL · Collier
- 2024 margin
- Solid R (+33.1) · D 33.1% · R 66.2%
- 2008→2024 swing
- -10.6pp toward R · 2008: -22.5pp · 2024: -33.1pp
- All cycles
- 2024: R+33.1 2020: R+24.7 2016: R+26.0 2012: R+30.1 2008: R+22.5
Not yet ingested
- Civics
- —
Market trends
- HPI YoY
- ▼ -1.05%
- Current HPI
- 226.9105
- Rent YoY
- ▲ 2.95%
- Metro
- Naples-Marco Island, FL
- State GDP YoY
- ▲ 3.28%
- F500 in state
- 36
Industry mix (Fortune 500 HQ in FL)
| Industry | F500 HQs | Revenue |
|---|---|---|
| Industrial Technology | 2 | $29B |
|
||
| Insurance | 2 | $17B |
|
||
| Retail | 1 | $60B |
|
||
| Technology Distribution | 1 | $58B |
|
||
| Homebuilding | 1 | $35B |
|
||
| Technology Manufacturing | 1 | $35B |
|
||
Price history
-14.1% since first listed7 events — show timeline
- 2026-05-14 Price Changed $425,000 FORTMLS
- 2026-04-16 Listed $439,000 FORTMLS
- 2026-03-31 Listing Removed — NAPLESMLS
- 2026-01-29 Price Changed $454,000 NAPLESMLS
- 2025-12-22 Listed $479,000 NAPLESMLS
- 2025-11-19 Listing Removed — NAPLESMLS
- 2025-08-20 Listed $494,900 NAPLESMLS
Property tax history
+23.9%/yrLatest (2025): $5,041 · +8.1% YoY. Source: county tax records.
Cash-flow waterfall
monthlySold comps — $/sqft
last 12 mo · ≤1 miLoading sold comps…