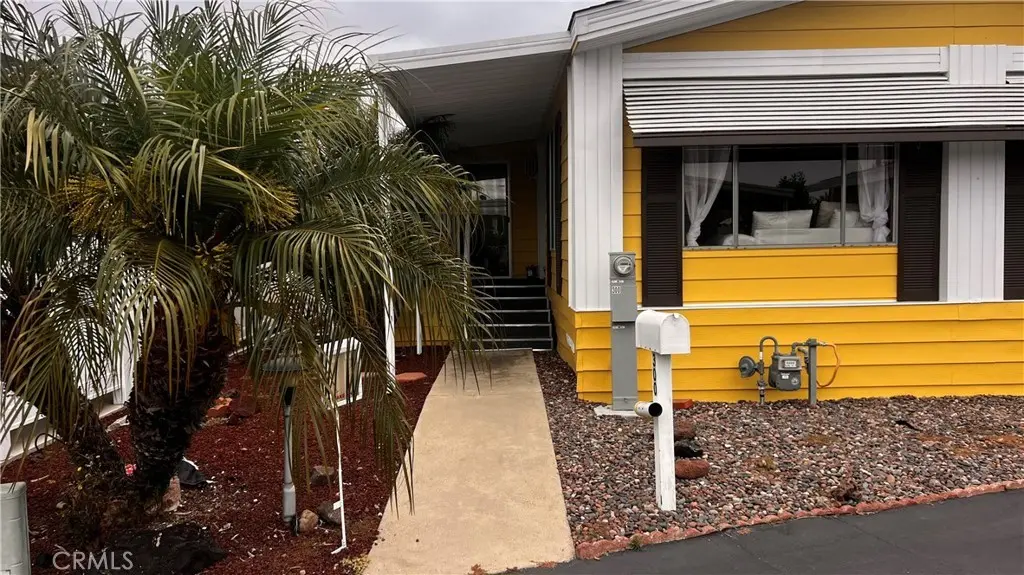
16222 Monterey Ln #300 · Huntington Beach, CA
Flood risk 1/10 · Minimal
- FEMA flood zone
- X (shaded)
- Chance of flooding over 30 yrs
- 0.0%
- Est. flood insurance / yr
- $507 – $1,088
Fire risk 5/10 · Moderate
- Est. fire insurance / yr
- $659 – $1,223
Heat risk 5/10 · Moderate
- Hot days now (above 85°F)
- 7 days/yr
- Hot days in 30 yrs
- 24 days/yr
Wind risk 1/10 · Minimal
- Chance of severe wind over 30 yrs
- —
Air-quality risk 3/10 · Minor
- Unhealthy air days now
- 4 days/yr
- Unhealthy air days in 30 yrs
- 4 days/yr
Risk factors via First Street. Map © Google.
Why this score? — see what drove the B grade
The composite is a weighted blend of 9 inputs, each scored 0–100. Each bar is that input's sub-score; the figure is the points it added to the 100-point composite (weight × sub-score).
- Cash flow +30.0/30.0
- 1% rule +10.0/10.0
- DSCR +10.0/10.0
- ARV discount +7.5/15.0
- Schools +5.5/10.0
- Livability +3.4/5.0
- Rent growth +3.0/5.0
- Condition / age +2.5/5.0
- Appreciation +0.0/10.0
$130,000
🖨 Deal sheet 📄 Offer letter ✓ Due diligence
Listing remarks
Welcome to this wonderful Rancho Del Rey home, located just one mile from the beach and offering the best of Huntington Harbor living. This spacious 55+/18 community home features two bedrooms, two bathrooms, and an inviting sunroom for relaxing or entertaining. The kitchen has been beautifully remodeled with new cabinetry and counters and also stainless steel appliances. Attached carport enough to fit three vehicles. A newer roof adds peace of mind, and the home sits in a prime location within the park. Enjoy coastal breezes, resort style amenities, and a lifestyle just minutes from sand, shops, and dining. Community features include gated entry with fulltime security guard, two clubhouses
Key facts
- Inviting sunroom
- Newer roof
- New cabinetry
Tags
Property features AI
Finance
- Other: Directions: From Bolsa Chica Ave. travel west on Edinger Ave. then left onto Monterey Ln. Present your business card to security attendant and provide space numbers to be shown.
- Financial info: Monthly land lease of $2,350 (park source)
- HOA & community: Senior community; Suburban community features; Park name: Rancho Del Rey; Manager approval required for tenancy; Pet restrictions by size and number
Exterior
- Parking: Attached carport with 2 spaces
- Security: Gated community with attendant and guard; Automatic gate; Card/code access; Resident manager
- Utilities: Public/district water; Public sewer - connected; Natural gas connected/available; Standard electric service on property
- Home design: Mobile home (24' x 60') — mobile home remains; Double body type; Single-story; Entry on level 1; Private paved road frontage
- Construction: Aluminum and hardboard exterior; Pillar/post/pier foundation with pier jacks; Composition roof; Year-built sourced from builder
- Exterior features: Composition roof; Average-condition fencing; Covered front porch; Patio; Community heated gunite pool; Pool heated with gas; Close to clubhouse; One shed on the property
Interior
- Kitchen: Gas cooktop; Gas range; Refrigerator; Dishwasher; Garbage disposal; Corian counters
- Bedrooms: Bedrooms located on the main floor
- Flooring: Laminated flooring
- Bathrooms: One full bathroom; One three-quarter bathroom; Bathtub and shower-in-tub
- Heating & cooling: Central heating (furnace); Central cooling
- Interior features: One-level home; All bedrooms on the main floor; Covered front porch; Smoke detector(s); Carbon monoxide detector(s); Card/code access; Automatic gate; Gated community with attendant, guard, and resident manager; Community in-ground gunite spa
- Laundry & utility: Inside laundry room; Washer included; Dryer included; Individual laundry room
Neighborhood map
What this means for you Summary
Snapshot
- This is a 2-bed/2.0-bath manufactured listed at $130k.
Deal economics
- At list price, monthly cash flow is $2k ($25k/yr) — positive.
- The deal already cash-flows at list — no discount required.
- Meets the 1% rule at list price ($4k rent vs $130k).
- Cap rate 25.8% vs local median 1.6% in Huntington Beach — top-decile yield for the area; either an underpriced asset or a hidden risk that comps aren't pricing in. Stress-test before assuming the spread holds.
Location & tenants
- Location reads 67/100 on livability (#306 in CA) — a middle-class / working-renter tenant base. Strengths: employment A+, commute A-, schools B+; Watch: amenities C-, cost of living F, health & safety F.
- Ocean View (suburban): math 57% / reading 63% proficiency, ranked #207 of 1,400 in CA (top 15%) — acceptable for families but not a draw, mixed tenant base, ~2y average lease.
- Market conditions: Rents rising (+2.2%/yr); 83 active listings in the ZIP; 32 comparable units currently listed for rent nearby; rentals leasing fast (median 3d on market — plan ~1-2 weeks tenant-placement turnaround); high-income renter base; 6,974 units permitted in Orange County in 2024 (3,839 in 5+ unit buildings).
- This rent runs 37% of the median local income ($123k/yr) — at the standard rent-burdened threshold; future hikes will face affordability resistance.
Forward outlook
- Local home prices are declining (-3.0%/yr); year-one equity from $899 of loan paydown is wiped out by about $4k of value loss. Plan a longer hold.
- Orange County population projected at +14% by 2050 — modest demand growth; plan on rents tracking national, not racing it.
- At projected returns (-3.0% appreciation + 2.2% rent growth), your $36k cash investment doubles in ~2 years — after that, you're playing with house money.
Negotiation context
- Only 11 days on market — expect competitive offers; lowballing is unlikely to land.
- 2 sale attempts with the ask held roughly flat each time — persistent listings suggest the price (not the market) is what's stuck; bring a comps-based counter.
Risks & watch-outs
- Climate carrying-cost: moderate wildfire risk; extreme-heat days projected 7→24/yr by 2055 (HVAC capex compounding) — expect insurance premiums to compound above CPI over the hold.
Questions for the listing agent
- Is there a deadline driving the sale (1031 exchange, divorce, estate, relocation)? That informs how much negotiation room exists.
- Schools are B-rated — typically a magnet for longer-tenancy family renters. What's the average tenant stay here, and is there a school-zone premium baked into asking?
- What's the average days-on-market for RENTAL listings here right now (not sales)? A rising rental-DOM trend means longer vacancies and softer asking-rent achievability than the comps imply.
- What's the recent tenant-quality profile in this submarket — average credit score on applications, eviction rate, late-payment / NSF rate, and stable-employment percentage? A property-management company in the area should have these aggregated.
- How much new for-sale + rental construction is in the pipeline within 1–3 miles? Heavy new supply typically softens prices + rents 12–24 months out; constrained supply supports both.
Investment metrics
- 1% rule
- 2.94% ✓
- Cap rate
- 25.83%
- Cash-on-cash
- 69.79%
- DSCR
- 4.11
- GRM
- 2.8
CMA / ARV
- ARV (on-the-fly)
- $282,240
- Comps found
- 12
Show comp detail 12 sales within ~0.75 mi
| Address | Dist | Beds/Ba | Sqft | Sold | Price | $/sf | Match |
|---|---|---|---|---|---|---|---|
| 16222 Monterey Ln #327 | 0.00mi | 3/2.0 (+1) | 1,440 (0%) | 1mo | $249,900 | $174 | 94 |
| 16222 Monterey Ln #337 | 0.00mi | 2/2.0 | 1,440 (0%) | 11mo | $160,000 | $111 | 91 |
| 16222 Monterey Ln #151 | 0.00mi | 3/2.0 (+1) | 1,456 (+1%) | 8mo | $292,000 | $201 | 86 |
| 16222 Monterey Ln #210 | 0.00mi | 3/2.0 (+1) | 1,500 (+4%) | 5mo | $243,000 | $162 | 84 |
| 16222 Monterey Ln #80 | 0.00mi | 2/2.0 | 1,320 (-8%) | 7mo | $200,000 | $152 | 80 |
| 16222 Monterey #178 | 0.00mi | 3/2.0 (+1) | 1,554 (+8%) | 3mo | $369,900 | $238 | 80 |
| 16222 Monterey Ln #285 | 0.00mi | 3/2.0 (+1) | 1,565 (+9%) | 4mo | $280,000 | $179 | 77 |
| 16222 Monterey Ln #50 | 0.00mi | 2/2.0 | 1,344 (-7%) | 15mo | $200,000 | $149 | 76 |
| 16222 Monterey Ln #183 | 0.00mi | 3/2.0 (+1) | 1,500 (+4%) | 14mo | $336,000 | $224 | 76 |
| 16451 Makaha Ln | 0.25mi | 2/2.0 | 1,344 (-7%) | 7mo | $845,000 | $629 | 72 |
| 16222 Monterey Ln #200 | 0.00mi | 3/2.0 (+1) | 1,580 (+10%) | 18mo | $310,000 | $196 | 64 |
| 16444 Bolsa Chica #42 | 0.64mi | 3/2.0 (+1) | 1,440 (0%) | 13mo | $325,000 | $226 | 54 |
Match score weights: distance 35% · size 25% · config 20% · recency 20%. Top-matched comps best support the ARV.
Projected returns pro-forma
-3.0% appreciation · 2.17% rent growth · sell at horizon
- IRR
- 68.4%
- Equity multiple
- 4.04×
- Total profit
- $110,654
- Equity at exit
- $19,383
- IRR
- 72.2%
- Equity multiple
- 8.07×
- Total profit
- $257,439
- Equity at exit
- $11,240
Cash invested: $36,400 (down + closing). Projections, not guarantees.
Landlord ↔ Tenant lean methodology
- Overall (STATE)
- 18 Strongly Tenant-Friendly
- State California
- 18 Strongly Tenant-Friendly · D+13
- County
- — inherits STATE
- City
- — inherits STATE
ZIP-level market 92649
- Rents YoY
- 2.2%
- Active inventory
- 83
- Price-to-rent
- 2.8×
Monthly cashflow live
- Estimated rent
- $3,817 high interval (Pro) →
- Mortgage (P&I)
- −$682
- Tax est. 1.5%
- −$162 /mo · $1,950/yr
- Insurance
- −$54
- HOA
- −$0
- Vacancy / Maint / Mgmt
- −$802
- Net cashflow
- $2,117
Break-even live
UW: 25.0% down · 7.5% · 30yr · 1.5% tax · 5.0% vac · 8.0% maint · 8.0% mgmt
Financing live
Cash to close
- Down payment
- $32,500
- Closing costs
- $3,900
- Reserves months
- —
- Total cash needed
- —
Loan-product check · same deal, 3 products live
Conventional
25% down · 7.5% · 30yr
- Down + closing
- —
- Monthly P&I
- —
- Monthly cashflow
- —
- DSCR
- —
- Eligible?
- —
Personal DTI + credit; lowest rate.
DSCR
20% down · 8.5% · 30yr
- Down + closing
- —
- Monthly P&I
- —
- Monthly cashflow
- —
- DSCR
- —
- Eligible?
- —
No personal income docs; deal must DSCR.
Hard money
10% down · 12.0% · 12mo
- Down + closing
- —
- Monthly P&I
- —
- Monthly cashflow
- —
- DSCR
- —
- Eligible?
- —
Short-term bridge; refi at stabilization.
Rent comps 32 comps
| Address | Beds | Baths | Sqft | Rent | $/sqft | DOM | Units | Dist |
|---|---|---|---|---|---|---|---|---|
| 4562 Heil Ave Unit 1 Huntington Beach, CA | 3.0 | 2.0 | 1250 | $3,750 | $3.00 | 3d | 1 | 0.37mi |
| 4862 Kona Dr Unit C Huntington Beach, CA | 3.0 | 2.5 | 1200 | $2,895 | $2.41 | 13d | 1 | 0.49mi |
| 4862 Kona Dr Unit C Huntington Beach, CA | 3.0 | 2.5 | 1200 | $2,895 | $2.41 | 1d | 1 | 0.49mi |
| 4862 Kona Dr Unit C Huntington Beach, CA | 3.0 | 2.5 | 1200 | $2,895 | $2.41 | 15d | 1 | 0.49mi |
| 16700 Saybrook Ln Huntington Beach, CA | 1.0–2.0 | 1.0–2.0 | 1082 | $3,670 | $3.39 | 1d | 10 | 0.50mi |
| 4881 Kona Dr Unit A Huntington Beach, CA | 3.0 | 2.5 | 1300 | $3,295 | $2.53 | 10d | 1 | 0.50mi |
| 16682 Algonquin St Huntington Beach, CA | 2.0 | 2.0 | 1000 | $2,695 | $2.69 | 19d | 1 | 0.52mi |
| 16682 Dolores Ln Huntington Beach, CA | 2.0 | 2.5 | 1700 | $3,600 | $2.12 | 10d | 1 | 0.53mi |
| 4922 Edinger Ave Huntington Beach, CA | 2.0 | 2.0 | 1000 | $2,800 | $2.80 | 10d | 1 | 0.54mi |
| 3832 Montego Dr Huntington Beach, CA | 3.0 | 2.5 | 1826 | $5,900 | $3.23 | 16d | 1 | 0.59mi |
| 16701 Lynn Ln Apt C Huntington Beach, CA | 2.0 | 2.0 | 1000 | $2,600 | $2.60 | 10d | 1 | 0.62mi |
| 4881 Vista Dr Unit 3 Huntington Beach, CA | 2.0 | 2.0 | 902 | $3,200 | $3.55 | 2d | 1 | 0.67mi |
| 4675 Twintree Dr Huntington Beach, CA | 2.0 | 1.5 | 960 | $3,495 | $3.64 | 1d | 1 | 0.70mi |
| 5082 Edinger Ave Huntington Beach, CA | 3.0 | 2.0 | 1278 | $4,500 | $3.52 | 1d | 1 | 0.71mi |
| 16592 Jib Cir Unit B Huntington Beach, CA | 3.0 | 2.5 | 1500 | $4,300 | $2.87 | 1d | 1 | 0.74mi |
| 5141 Cheryl Dr Huntington Beach, CA | 3.0 | 1.5 | 1120 | $4,200 | $3.75 | 16d | 1 | 0.75mi |
| 16842 Hoskins Ln Unit A Huntington Beach, CA | 3.0 | 2.0 | 1072 | $3,195 | $2.98 | 3d | 1 | 0.79mi |
| 16862 Lynn Ln Apt E Huntington Beach, CA | 2.0 | 1.0 | 970 | $2,625 | $2.71 | 19d | 1 | 0.79mi |
| 4701 Warner Ave Huntington Beach, CA | 1.0–2.0 | 1.0 | 870 | $2,895 | $3.33 | 1d | 4 | 0.84mi |
| 16941 Hoskins Ln Apt 1 Huntington Beach, CA | 2.0 | 2.0 | 1255 | $3,000 | $2.39 | 21d | 1 | 0.86mi |
| 5192 Robinwood Dr Huntington Beach, CA | 3.0 | 2.0 | 1232 | $5,000 | $4.06 | 1d | 1 | 0.86mi |
| 16082 Schryer Ln Huntington Beach, CA | 3.0 | 2.0 | 1214 | $8,000 | $6.59 | 3d | 1 | 0.90mi |
| 16795 Roosevelt Ln Unit C Huntington Beach, CA | 3.0 | 2.0 | 1600 | $3,900 | $2.44 | 1d | 1 | 0.92mi |
| 3382 Tempe Dr Huntington Beach, CA | 2.0 | 2.5 | 1658 | $6,500 | $3.92 | 1d | 1 | 0.99mi |
| 4021 Aladdin Dr Huntington Beach, CA | 3.0 | 2.5 | 1496 | $7,400 | $4.95 | 1d | 1 | 1.04mi |
| 3312 Tempe Dr Huntington Beach, CA | 2.0 | 2.5 | 1658 | $6,500 | $3.92 | 4d | 1 | 1.06mi |
| 3299 Tempe Dr Huntington Beach, CA | 3.0 | 3.0 | 1580 | $5,950 | $3.77 | 1d | 1 | 1.09mi |
| 16857 Bayview Dr Unit B Sunset Beach, CA | 2.0 | 1.0 | 900 | $3,450 | $3.83 | 1d | 1 | 1.18mi |
| 17181 S Pacific Ave Sunset Beach, CA | 2.0 | 2.0 | 1422 | $6,000 | $4.22 | 12d | 1 | 1.28mi |
| 5681 Mangrum Dr Huntington Beach, CA | 3.0 | 2.0 | 1132 | $4,995 | $4.41 | 1d | 1 | 1.30mi |
| 16862 Coach Ln Huntington Beach, CA | 2.0 | 1.0 | 1000 | $3,500 | $3.50 | 1d | 1 | 1.30mi |
| 2872 Coast Cir #104 Huntington Beach, CA | 2.0 | 2.0 | 1631 | $5,200 | $3.19 | 2d | 1 | 1.45mi |
Listing history 10 events
-
2026-06-18days on market $130,000 Active 11 DOM
-
2026-06-17days on market $130,000 Active 10 DOM
-
2026-06-16days on market $130,000 Active 9 DOM
-
2026-06-15days on market $130,000 Active 8 DOM
-
2026-06-13days on market $130,000 Active 6 DOM
-
2026-06-13days on market $130,000 Active 5 DOM
-
2026-06-10days on market $130,000 Active 3 DOM
-
2026-06-09days on market $130,000 Active 2 DOM
-
2026-06-07remarks 699-char remark
-
2026-06-07$130,000 Active 1 DOM
ⓘ Source: listings_history table (triggers on properties + properties_extension) + one-shot
backfill from property_details.listing_events for pre-trigger history.
Climate risk First Street
- Flood 1/10 Low FEMA zone X (shaded) · 0% chance over 30 yrs
- Wildfire 5/10 Major
- Heat 5/10 Major 7 d/yr ≥85°F today · 24 d/yr by 30 yrs out
- Wind 1/10 Low
- Air quality 3/10 Moderate 4 unhealthy d/yr today · 4 by 30 yrs out
Nearby sold comps map
Loading sold comps map…
Walkable amenities ~0.75 mi
Loading nearby amenities…
Taxation est. · year 1
- Rental income
- $45,801
- − Mortgage interest
- −$7,282
- − Property taxes
- −$1,950
- − Insurance
- −$650
- − Repairs & maintenance
- −$3,664
- − Management
- −$3,664
- − Depreciation
- −$3,782
- Taxable income
- $24,809
- Est. tax owed @ 24.0%
- −$5,954
- After-tax cash flow
- $19,448/yr
For passive investors: Depreciation is non-cash, so a rental often shows a tax loss while cash-flowing — sheltering income. Rental losses are passive: they offset passive income freely, and up to $25,000/yr can offset ordinary (W-2) income if you actively participate and your MAGI is under $100k (phasing out to $0 by $150k); unused losses carry forward. On sale, claimed depreciation is recaptured at up to 25%, and gains may owe capital-gains tax (a 1031 exchange can defer both). Figures are a year-1 estimate at your 24.0% rate — not tax advice; consult a CPA.
Schools (NCES district)
- District
- Ocean View
- NCES district ID
- 0628140
- Math proficiency
- 57% ▬ 0.00%
- Reading proficiency
- 63% ▼ -1.00%
- Median HH income
- $77,469
- Composite
- 55.3/100
- National rank
- #2725
- State rank
- #207 of 1400 in CA
Livability — Huntington Beach
- Score
- 67/100
- State rank
- #306
- US rank
- #10298
Category grades
Schools grade is shown separately in the Schools card above.
Census & demographics
- Census place
- Huntington Beach, CA
- County
- Orange County · 3,096,323 people
- City population
- 194,835
- Metro
- Los Angeles-Long Beach-Anaheim, CA
- Population (ZIP)
- 35,346
- Household income
- $123,257
- Rent vs Own
- Severe rent burden
- 1504.0
Population outlook (Orange County) Hauer SSP2
- Today (2025)
- 3,477,456 people
- By 2030
- 3,613,117 · +3.9%
- By 2040
- 3,835,945 · +10.3%
- By 2050
- 3,968,736 · +14.1%
- By 2075
- 4,097,053 · +17.8%
- By 2100
- 3,903,633 · +12.3%
Race, ethnicity, and origin ACS 2023
- Neighborhood character
- Majority White (64%)
- Race & ethnicity
- White 64% Hispanic / Latino 16% Two or more races 14% Asian 10%
- Hispanic origin (detail)
- Mexican 11%
- Common ancestry
- Lithuanian 3% Italian 2% Romanian 2%
- Foreign-born
- 14% · Canada, Vietnam, China
- Languages at home
- 81% English-only · Spanish 6% Other Asian/Pacific 3% Vietnamese 2%
Political lean MEDSL · Orange
- 2024 margin
- Toss-up / Even · D 49.7% · R 47.1% · Other 3.2%
- 2008→2024 swing
- +5.2pp toward D · 2008: -2.6pp · 2024: 2.6pp
- All cycles
- 2024: D+2.6 2020: D+9.0 2016: D+7.7 2012: R+8.3 2008: R+2.6
Not yet ingested
- Civics
- —
Market trends
- HPI YoY
- ▼ -1153.55%
- Current HPI
- 330.6956
- Rent YoY
- ▲ 2.17%
- Metro
- Los Angeles-Long Beach-Anaheim, CA
- State GDP YoY
- ▲ 3.21%
- F500 in state
- 116
Industry mix (Fortune 500 HQ in CA)
| Industry | F500 HQs | Revenue |
|---|---|---|
| Technology | 27 | $1,492B |
|
||
| Financial Services | 3 | $174B |
|
||
| Retail | 3 | $44B |
|
||
| Insurance | 3 | $26B |
|
||
| Media / Entertainment | 2 | $115B |
|
||
| Pharmaceuticals / Biotech | 2 | $62B |
|
||
Price history
+0.0% since first listed3 events — show timeline
- 2026-06-07 Listed $130,000 CRMLS
- 2026-06-05 Listing Removed — CRMLS
- 2026-06-04 Listed $130,000 CRMLS
Property tax history
-1.5%/yrLatest (2025): $101 · -0.3% YoY. Source: county tax records.
Cash-flow waterfall
monthlySold comps — $/sqft
last 12 mo · ≤1 miLoading sold comps…