7718 Beechwood Dr · Ferry Pass, FL
Flood risk 1/10 · Minimal
- FEMA flood zone
- X (unshaded)
- Chance of flooding over 30 yrs
- 0.0%
- Est. flood insurance / yr
- $507 – $1,088
Fire risk 1/10 · Minimal
- Est. fire insurance / yr
- $947 – $1,759
Heat risk 10/10 · Severe
- Hot days now (above 106°F)
- 7 days/yr
- Hot days in 30 yrs
- 22 days/yr
Wind risk 9/10 · Severe
- Chance of severe wind over 30 yrs
- 99.0%
Air-quality risk 1/10 · Minimal
- Unhealthy air days now
- 0 days/yr
- Unhealthy air days in 30 yrs
- 0 days/yr
Risk factors via First Street. Map © Google.
Why this score? — see what drove the C+ grade
The composite is a weighted blend of 9 inputs, each scored 0–100. Each bar is that input's sub-score; the figure is the points it added to the 100-point composite (weight × sub-score).
- Cash flow +22.8/30.0
- ARV discount +15.0/15.0
- DSCR +7.3/10.0
- 1% rule +6.6/10.0
- Schools +3.6/10.0
- Livability +3.2/5.0
- Rent growth +2.7/5.0
- Condition / age +2.5/5.0
- Appreciation +0.0/10.0
$149,900
🖨 Deal sheet 📄 Offer letter ✓ Due diligence
Listing remarks
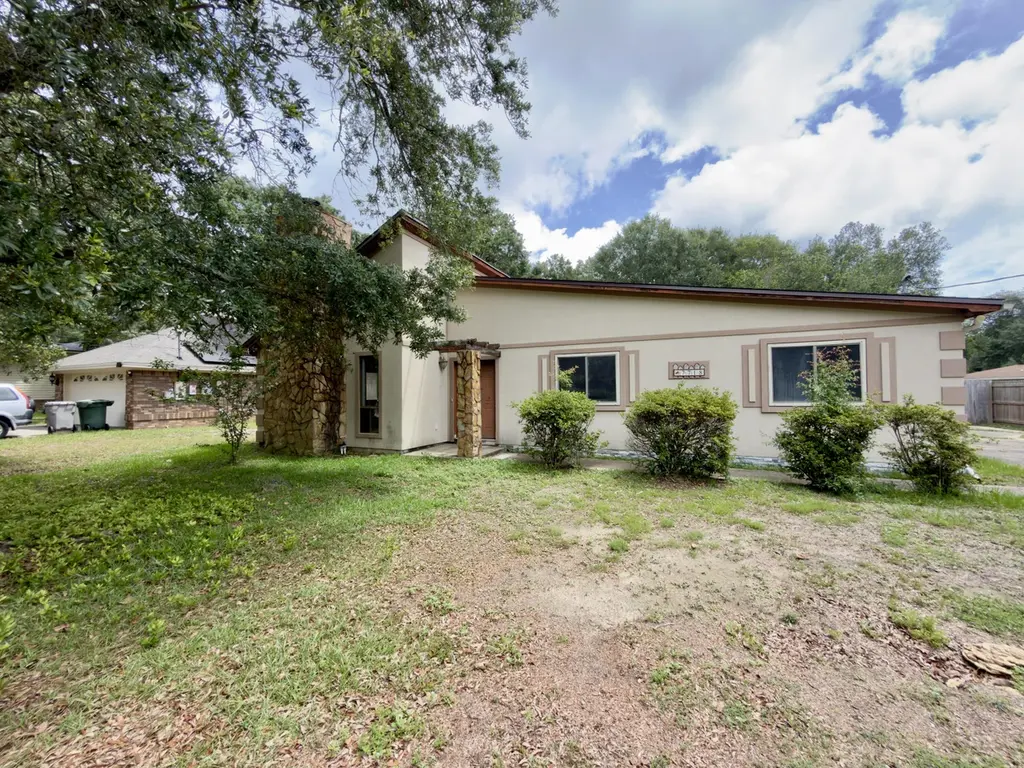
If you are looking for your a home with tons of potential, this REO opportunity is one to see. Nestled in an established area that is just a few miles from interstate access, hospitals, churches, colleges, and more, you found it. Built in 1984, 1394sf home has stucco exterior, privacy fenced back yard and an enclosed patio. The original side entry 2 car garage was enclosed in the past and that square footage is not included in this living square footage. The living room has a vaulted ceilings with a stone fireplace. Much of the original windows were replaced with vinyl windows, taking a big chunk out of any rehab costs. The kitchen is galley and leads to the separate dining area. Tiled floo
Key facts
- Vinyl windows
- Stone fireplace
- Stucco exterior
Tags
Property features AI
Finance
- HOA & community: Located in the CHARTER OAKS subdivision
Exterior
- Parking: Details not provided
- Security: Details not provided
- Utilities: Electric service; Public water; Public sewer; TV cable available
- Home design: Ranch-style single-story home; Built in 1984
- Construction: Stone and stucco exterior with wood trim; Slab foundation
- Exterior features: Private yard; Yard building; Privacy fencing; Level lot; Lot dimensions about 80 x 120; Paved county road frontage
Interior
- Kitchen: Kitchen located on the first floor
- Bedrooms: 3 bedrooms (all on the first floor); Bedroom sizes include approximately 10 x 10, 10 x 11, and 13 x 13
- Flooring: Laminate flooring; Tile flooring
- Bathrooms: 2 full bathrooms
- Heating & cooling: Central heating; Central air conditioning
- Interior features: Vaulted ceilings; Fireplace; Natural woodwork
- Laundry & utility: Electric water heater
Neighborhood map
What this means for you Summary
Snapshot
- This is a 3-bed/2.0-bath single-family listed at $150k.
Deal economics
- At list price, monthly cash flow is $260 ($3k/yr) — positive.
- The deal already cash-flows at list — no discount required.
- Meets the 1% rule at list price ($2k rent vs $150k).
- Cap rate 8.4% vs local median 4.4% in Ferry Pass — top-decile yield for the area; either an underpriced asset or a hidden risk that comps aren't pricing in. Stress-test before assuming the spread holds.
Location & tenants
- Location reads 65/100 on livability (#664 in FL) — a middle-class / working-renter tenant base. Strengths: cost of living A+, housing A+; Watch: employment C-, amenities F, commute F.
- Escambia (suburban): math 40% / reading 45% proficiency, ranked #56 of 73 in FL (top 77%) — families likely to look elsewhere, expect single-tenant / working-renter base with shorter leases.
- Zoned schools: Ferry Pass Elementary School (math 41% / reading 45%, grade F, #1,366 of 2,144 statewide, top 64%, 567 students, 74% FRL); Pine Forest High School (math 20% / reading 32%, grade F, #494 of 667 statewide, top 75%, 1,870 students, 62% FRL).
- Market conditions: Rents flat; 221 active listings in the ZIP; 26 comparable units currently listed for rent nearby; rentals at typical pace (median 21d on market — plan ~3-4 weeks tenant-placement turnaround); 1,479 units permitted in Escambia County in 2024 (0 in 5+ unit buildings).
- This rent runs 31% of the median local income ($67k/yr) — at the standard rent-burdened threshold; future hikes will face affordability resistance.
Forward outlook
- Local home prices are declining (-3.0%/yr); year-one equity from $1k of loan paydown is wiped out by about $4k of value loss. Plan a longer hold.
- Escambia County population projected at +13% by 2050 — modest demand growth; plan on rents tracking national, not racing it.
Negotiation context
- Only 9 days on market — expect competitive offers; lowballing is unlikely to land.
- Current owner paid $66k; list at $150k implies a 126% gain — meaningful room to come down on a strong offer.
Risks & watch-outs
- Climate carrying-cost: severe wind risk, 99% chance of damaging wind over 30y; extreme-heat days projected 7→22/yr by 2055 (HVAC capex compounding) — expect insurance premiums to compound above CPI over the hold.
Questions for the listing agent
- Is there a deadline driving the sale (1031 exchange, divorce, estate, relocation)? That informs how much negotiation room exists.
- Schools are D-rated, which usually means shorter tenancies and higher turnover. Who's the typical renter profile here, and what's been the actual vacancy rate?
- What's the average days-on-market for RENTAL listings here right now (not sales)? A rising rental-DOM trend means longer vacancies and softer asking-rent achievability than the comps imply.
- What's the recent tenant-quality profile in this submarket — average credit score on applications, eviction rate, late-payment / NSF rate, and stable-employment percentage? A property-management company in the area should have these aggregated.
- How much new for-sale + rental construction is in the pipeline within 1–3 miles? Heavy new supply typically softens prices + rents 12–24 months out; constrained supply supports both.
Investment metrics
- 1% rule
- 1.16% ✓
- Cap rate
- 8.38%
- Cash-on-cash
- 7.44%
- DSCR
- 1.33
- GRM
- 7.2
CMA / ARV
- ARV (on-the-fly)
- $236,980
- Comps found
- 12
Show comp detail 12 sales within ~0.75 mi
| Address | Dist | Beds/Ba | Sqft | Sold | Price | $/sf | Match |
|---|---|---|---|---|---|---|---|
| 3228 Desert St | 0.09mi | 3/2.0 | 1,452 (+4%) | 4mo | $185,000 | $127 | 86 |
| 3148 Cedarwood Village Ln | 0.19mi | 3/2.0 | 1,341 (-4%) | 5mo | $212,500 | $158 | 80 |
| 412 Oak Leaf Ct | 0.17mi | 3/2.0 | 1,459 (+5%) | 5mo | $275,000 | $188 | 80 |
| 3012 Desert St | 0.27mi | 3/2.0 | 1,544 (+11%) | 1mo | $279,000 | $181 | 68 |
| 3711 Raines St | 0.46mi | 3/2.0 | 1,316 (-6%) | 3mo | $265,000 | $201 | 66 |
| 8196 Lode Star Ave | 0.54mi | 3/2.0 | 1,363 (-2%) | 6mo | $203,933 | $150 | 66 |
| 308 Pin Oak Ct | 0.30mi | 3/2.0 | 1,528 (+10%) | 6mo | $259,900 | $170 | 65 |
| 521 Desert Oak Dr | 0.27mi | 3/2.0 | 1,566 (+12%) | 4mo | $190,000 | $121 | 64 |
| 2110 Elaine Cir | 0.67mi | 3/2.0 | 1,350 (-3%) | 0mo | $218,000 | $161 | 63 |
| 2969 Skycrest Dr | 0.51mi | 3/2.0 | 1,488 (+7%) | 4mo | $222,000 | $149 | 62 |
| 7130 Melba St | 0.45mi | 3/2.0 | 1,221 (-12%) | 3mo | $220,000 | $180 | 56 |
| 2340 Teate Ave | 0.57mi | 3/1.5 | 1,215 (-13%) | 1mo | $239,900 | $197 | 49 |
Match score weights: distance 35% · size 25% · config 20% · recency 20%. Top-matched comps best support the ARV.
Projected returns pro-forma
-3.0% appreciation · 0.76% rent growth · sell at horizon
- IRR
- -7.6%
- Equity multiple
- 0.73×
- Total profit
- $-11,468
- Equity at exit
- $22,351
- IRR
- -1.3%
- Equity multiple
- 0.92×
- Total profit
- $-3,376
- Equity at exit
- $12,961
Cash invested: $41,972 (down + closing). Projections, not guarantees.
Landlord ↔ Tenant lean methodology
- Overall (STATE)
- 87 Strongly Landlord-Friendly
- State Florida
- 87 Strongly Landlord-Friendly · R+3
- County
- — inherits STATE
- City
- — inherits STATE
ZIP-level market 32514
- Home prices YoY
- -31.2%
- Rents YoY
- 0.8%
- Active inventory
- 221
- Price-to-rent
- 7.2×
Monthly cashflow live
- Estimated rent
- $1,739 high interval (Pro) →
- Mortgage (P&I)
- −$786
- Tax from tax record
- −$265 /mo · $3,183/yr
- Insurance
- −$62
- HOA
- −$0
- Vacancy / Maint / Mgmt
- −$365
- Net cashflow
- $260
Break-even live
UW: 25.0% down · 7.5% · 30yr · 1.5% tax · 5.0% vac · 8.0% maint · 8.0% mgmt
Financing live
Cash to close
- Down payment
- $37,475
- Closing costs
- $4,497
- Reserves months
- —
- Total cash needed
- —
Loan-product check · same deal, 3 products live
Conventional
25% down · 7.5% · 30yr
- Down + closing
- —
- Monthly P&I
- —
- Monthly cashflow
- —
- DSCR
- —
- Eligible?
- —
Personal DTI + credit; lowest rate.
DSCR
20% down · 8.5% · 30yr
- Down + closing
- —
- Monthly P&I
- —
- Monthly cashflow
- —
- DSCR
- —
- Eligible?
- —
No personal income docs; deal must DSCR.
Hard money
10% down · 12.0% · 12mo
- Down + closing
- —
- Monthly P&I
- —
- Monthly cashflow
- —
- DSCR
- —
- Eligible?
- —
Short-term bridge; refi at stabilization.
Rent comps 26 comps
| Address | Beds | Baths | Sqft | Rent | $/sqft | DOM | Units | Dist |
|---|---|---|---|---|---|---|---|---|
| 3205 E Olive Rd Pensacola, FL | 1.0–2.0 | 1.0–2.0 | 900 | $1,540 | $1.71 | 13d | 8 | 0.21mi |
| 7650 Kipling St Unit 1 Pensacola, FL | 3.0 | 2.0 | 1200 | $1,300 | $1.08 | 23d | 1 | 0.33mi |
| 8053 Malibu Cir Pensacola, FL | 3.0 | 2.0 | 1575 | $1,810 | $1.15 | 13d | 1 | 0.40mi |
| 7758 Kipling St Pensacola, FL | 4.0 | 2.0 | 1652 | $1,695 | $1.03 | 13d | 1 | 0.40mi |
| 7322 Mangum Dr Unit 7322 Pensacola, FL | 2.0 | 2.0 | 1100 | $1,450 | $1.32 | 23d | 1 | 0.56mi |
| 7074 Javelin Ct Pensacola, FL | 3.0 | 2.5 | 1543 | $1,850 | $1.20 | 13d | 30 | 0.67mi |
| 7104 Cedar Grove Way Ferry Pass, FL | 3.0 | 2.5 | 1534 | $1,850 | $1.21 | 13d | 37 | 0.69mi |
| 8108 Ridgefield Rd Pensacola, FL | 3.0 | 2.0 | 1485 | $2,000 | $1.35 | 13d | 1 | 0.75mi |
| 1843 San Dollar Cir Unit 1843 Pensacola, FL | 2.0 | 1.0 | 920 | $1,400 | $1.52 | 23d | 1 | 0.76mi |
| 7155 N 9th Ave Pensacola, FL | 1.0–2.0 | 1.0 | 850 | $1,575 | $1.85 | 13d | 4 | 0.83mi |
| 4051 E Olive Rd Pensacola, FL | 1.0–2.0 | 1.0–2.0 | 855 | $1,425 | $1.67 | 23d | 37 | 0.86mi |
| 7171 N 9th Ave Unit D6 Pensacola, FL | 2.0 | 2.0 | 1204 | $1,450 | $1.20 | 13d | 1 | 0.87mi |
| 3505 Mossy Oak Villas Cir Pensacola, FL | 3.0 | 2.5 | 1738 | $1,800 | $1.04 | 23d | 1 | 0.88mi |
| 3514 Mossy Oak Villas Cir Pensacola, FL | 3.0 | 2.5 | 1738 | $2,000 | $1.15 | 23d | 1 | 0.91mi |
| 3514 Mossy Oak Villas Cir Pensacola, FL | 3.0 | 2.5 | 1738 | $2,000 | $1.15 | 13d | 1 | 0.91mi |
| 7601 N 9th Ave Pensacola, FL | 1.0–2.0 | 1.0–2.0 | 855 | $1,467 | $1.72 | 13d | 7 | 0.92mi |
| 6409 Concord Way Pensacola, FL | 2.0 | 2.0 | 990 | $2,100 | $2.12 | 23d | 1 | 1.03mi |
| 4093 E Johnson Ave Pensacola, FL | 4.0 | 2.0 | 1623 | $2,300 | $1.42 | 21d | 1 | 1.13mi |
| 7101 Joy St Unit I5 Pensacola, FL | 3.0 | 2.0 | 1183 | $1,950 | $1.65 | 23d | 1 | 1.17mi |
| 2106 Schwab Ct Unit B Pensacola, FL | 2.0 | 1.5 | 960 | $1,595 | $1.66 | 13d | 1 | 1.19mi |
| 6016 Sewell St Pensacola, FL | 3.0 | 1.5 | 1377 | $1,650 | $1.20 | 23d | 1 | 1.39mi |
| 161 Mirabelle Cir Pensacola, FL | 3.0 | 2.0 | 1701 | $2,000 | $1.18 | 23d | 1 | 1.40mi |
| 1857 Atwood Dr Pensacola, FL | 1.0–2.0 | 1.0–1.5 | 892 | $1,399 | $1.57 | 23d | 1 | 1.42mi |
| 7840 Lilac Ln Pensacola, FL | 1.0–3.0 | 1.0–2.0 | 1025 | $1,904 | $1.86 | 13d | 16 | 1.44mi |
| 2813 Langley Ave Pensacola, FL | 2.0 | 2.0 | 1078 | $1,450 | $1.35 | 23d | 1 | 1.44mi |
| 8707 N Davis Hwy Pensacola, FL | 1.0–3.0 | 1.0–2.0 | 1017 | $2,475 | $2.43 | 13d | 38 | 1.46mi |
Listing history 7 events
-
2026-06-14statusdays on market $149,900 Pending 9 DOM
-
2026-06-10days on market $149,900 Active 8 DOM
-
2026-06-09days on market $149,900 Active 7 DOM
-
2026-06-08days on market $149,900 Active 6 DOM
-
2026-06-07days on market $149,900 Active 5 DOM
-
2026-06-03remarks 699-char remark
-
2026-06-03$149,900 Active 1 DOM
ⓘ Source: listings_history table (triggers on properties + properties_extension) + one-shot
backfill from property_details.listing_events for pre-trigger history.
Tax reassessment forecast FL · Resets to sale price
- Current annual tax
- $3,183 · $265/mo
- Projected year-2 tax
- $3,183 · $265/mo
- Expected delta
- $0/yr ($0/mo · 0.0%)
ⓘ Screening estimate from a state-policy table — verify with the county assessor before closing.
Climate risk First Street
- Flood 1/10 Low FEMA zone X (unshaded) · 0% chance over 30 yrs
- Wildfire 1/10 Low
- Heat 10/10 Extreme 7 d/yr ≥106°F today · 22 d/yr by 30 yrs out
- Wind 9/10 Extreme 99% chance of damaging wind over 30 yrs
- Air quality 1/10 Low 0 unhealthy d/yr today · 0 by 30 yrs out
Nearby sold comps map
Loading sold comps map…
Walkable amenities ~0.75 mi
Loading nearby amenities…
Taxation est. · year 1
- Rental income
- $20,874
- − Mortgage interest
- −$8,397
- − Property taxes
- −$3,183
- − Insurance
- −$750
- − Repairs & maintenance
- −$1,670
- − Management
- −$1,670
- − Depreciation
- −$4,361
- Taxable income
- $844
- Est. tax owed @ 24.0%
- −$203
- After-tax cash flow
- $2,922/yr
For passive investors: Depreciation is non-cash, so a rental often shows a tax loss while cash-flowing — sheltering income. Rental losses are passive: they offset passive income freely, and up to $25,000/yr can offset ordinary (W-2) income if you actively participate and your MAGI is under $100k (phasing out to $0 by $150k); unused losses carry forward. On sale, claimed depreciation is recaptured at up to 25%, and gains may owe capital-gains tax (a 1031 exchange can defer both). Figures are a year-1 estimate at your 24.0% rate — not tax advice; consult a CPA.
Schools (NCES district)
- District
- Escambia
- NCES district ID
- 1200510
- Math proficiency
- 40% ▼ -9.00%
- Reading proficiency
- 45% ▼ -4.00%
- Median HH income
- $44,649
- Composite
- 36.04/100
- National rank
- #4773
- State rank
- #56 of 73 in FL
Livability — Ferry Pass
- Score
- 65/100
- State rank
- #664
- US rank
- #13543
Category grades
Schools grade is shown separately in the Schools card above.
Census & demographics
- Census place
- Ferry Pass, FL
- County
- Escambia County · 301,722 people
- City population
- 43,072
- Metro
- Pensacola-Ferry Pass-Brent, FL
- Population (ZIP)
- 42,447
- Household income
- $66,644
- Rent vs Own
- Severe rent burden
- 1962.0
Population outlook (Escambia County) Hauer SSP2
- Today (2025)
- 334,637 people
- By 2030
- 345,779 · +3.3%
- By 2040
- 364,828 · +9.0%
- By 2050
- 378,514 · +13.1%
- By 2075
- 403,220 · +20.5%
- By 2100
- 386,125 · +15.4%
Race, ethnicity, and origin ACS 2023
- Neighborhood character
- Diverse neighborhood (Simpson 0.55)
- Race & ethnicity
- White 63% Black 22% Two or more races 9% Hispanic / Latino 7% Asian 2%
- Hispanic origin (detail)
- Mexican 2% Puerto Rican 2%
- Common ancestry
- Italian 3% Lithuanian 2% Slovak 2%
- Foreign-born
- 6% · Canada, South Korea
- Languages at home
- 91% English-only · Spanish 5% Other Indo-European 1% Tagalog/Filipino 1%
Political lean MEDSL · Escambia
- 2024 margin
- R (+19.5) · D 39.7% · R 59.2% · Other 1.1%
- 2008→2024 swing
- -0.2pp no change · 2008: -19.3pp · 2024: -19.5pp
- All cycles
- 2024: R+19.5 2020: R+15.1 2016: R+20.6 2012: R+20.6 2008: R+19.3
Not yet ingested
- Civics
- —
Market trends
- HPI YoY
- ▼ -120.99%
- Current HPI
- 266.7408
- Rent YoY
- ▲ 0.76%
- Metro
- Pensacola-Ferry Pass-Brent, FL
- State GDP YoY
- ▲ 3.28%
- F500 in state
- 36
Industry mix (Fortune 500 HQ in FL)
| Industry | F500 HQs | Revenue |
|---|---|---|
| Industrial Technology | 2 | $29B |
|
||
| Insurance | 2 | $17B |
|
||
| Retail | 1 | $60B |
|
||
| Technology Distribution | 1 | $58B |
|
||
| Homebuilding | 1 | $35B |
|
||
| Technology Manufacturing | 1 | $35B |
|
||
Price history
+1288.0% since first listed3 events — show timeline
- 2026-06-01 Listed $149,900 ECAR
- 1984-10-01 Sold (Public Records) $66,400 Public Records
- 1984-02-01 Sold (Public Records) $10,800 Public Records
Property tax history
+14.9%/yrLatest (2025): $3,183 · +6.6% YoY. Source: county tax records.
Cash-flow waterfall
monthlySold comps — $/sqft
last 12 mo · ≤1 miLoading sold comps…