902 N Horsman St · Rockford, IL
Flood risk 6/10 · Moderate
- FEMA flood zone
- X (unshaded)
- Chance of flooding over 30 yrs
- 0.72%
- Est. flood insurance / yr
- $473 – $860
Fire risk 1/10 · Minimal
- Est. fire insurance / yr
- $804 – $1,492
Heat risk 2/10 · Minimal
- Hot days now (above 102°F)
- 7 days/yr
- Hot days in 30 yrs
- 15 days/yr
Wind risk 2/10 · Minimal
- Chance of severe wind over 30 yrs
- —
Air-quality risk 2/10 · Minimal
- Unhealthy air days now
- 1 days/yr
- Unhealthy air days in 30 yrs
- 2 days/yr
Risk factors via First Street. Map © Google.
Why this score? — see what drove the B grade
The composite is a weighted blend of 9 inputs, each scored 0–100. Each bar is that input's sub-score; the figure is the points it added to the 100-point composite (weight × sub-score).
- Cash flow +30.0/30.0
- ARV discount +15.0/15.0
- 1% rule +10.0/10.0
- DSCR +10.0/10.0
- Livability +3.1/5.0
- Rent growth +2.5/5.0
- Condition / age +2.5/5.0
- Schools +1.2/10.0
- Appreciation +0.0/10.0
$40,000
🖨 Deal sheet 📄 Offer letter ✓ Due diligence
Listing remarks MLS
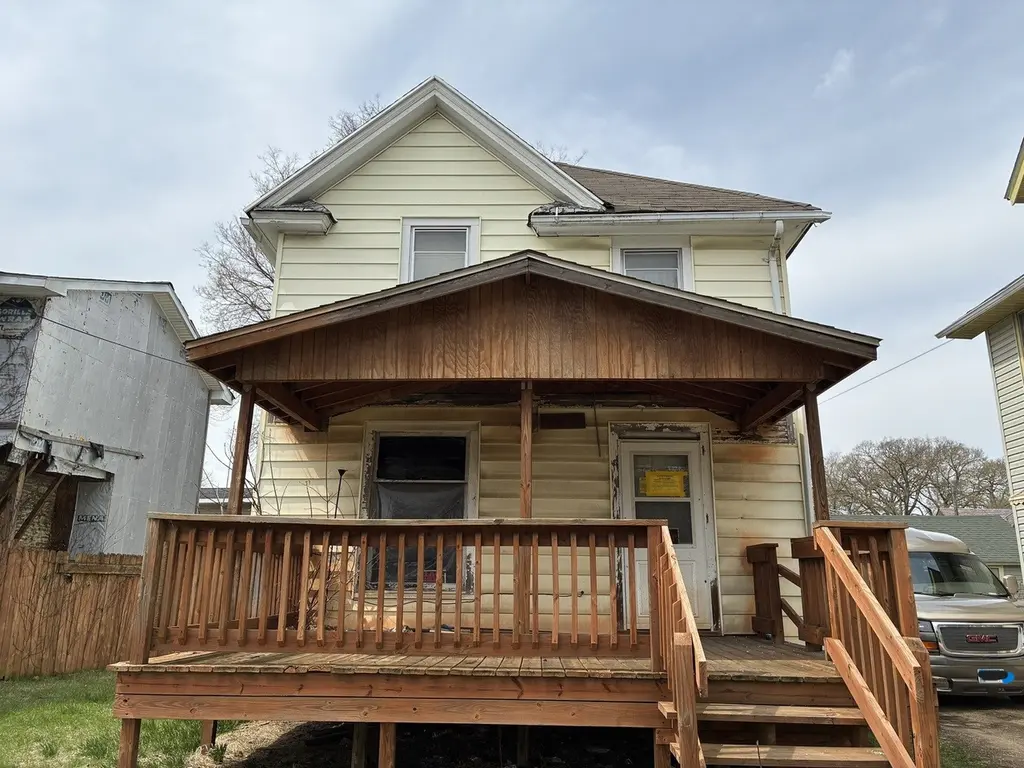
Attention investors and rehabbers! Opportunity awaits with this 2-story home featuring 3 bedrooms, 1 bathroom, and a detached 1-car garage. The property needs major rehab work and is currently condemned, making it best suited for experienced buyers ready to take on a full renovation. Cash only. Sold as-is.
Key facts
- 4,356 sq ft lot
- Garage
- Built 1910
Neighborhood map
What this means for you Summary
Snapshot
- This is a 3-bed/1.0-bath single-family listed at $40k.
Deal economics
- At list price, monthly cash flow is $746 ($9k/yr) — positive.
- The deal already cash-flows at list — no discount required.
- Meets the 1% rule at list price ($1k rent vs $40k).
- Recommended offer: $39k (3.0% below list) — sets the bar for market timing.
- Cap rate 28.7% vs local median 6.1% in Rockford — top-decile yield for the area; either an underpriced asset or a hidden risk that comps aren't pricing in. Stress-test before assuming the spread holds.
Location & tenants
- Location reads 62/100 on livability (#876 in IL) — a middle-class / working-renter tenant base. Strengths: cost of living A+, housing A+, health & safety A+; Watch: schools F, crime F, amenities F.
- Rockford SD 205 (urban): math 12% / reading 16% proficiency, ranked #533 of 620 in IL (top 86%) — low school quality limits family demand, transient renter base, plan for 1-2y turnover; 73% free/reduced lunch — lower-income household profile, screen leases tightly.
- Market conditions: 76 active listings in the ZIP; 34 comparable units currently listed for rent nearby; rentals at typical pace (median 21d on market — plan ~3-4 weeks tenant-placement turnaround); 47% of comp listings sitting > 30 days — soft ceiling on asking rent; 285 units permitted in Winnebago County in 2024 (0 in 5+ unit buildings).
- This rent runs 35% of the median local income ($46k/yr) — at the standard rent-burdened threshold; future hikes will face affordability resistance.
Forward outlook
- Local home prices are declining (-3.0%/yr); year-one equity from $277 of loan paydown is wiped out by about $1k of value loss. Plan a longer hold.
- Winnebago County population projected at -20% by 2050 — secular population decline; favor cash flow + early exit over multi-decade hold.
- At projected returns (-3.0% appreciation + 3.0% rent growth), your $11k cash investment doubles in ~2 years — after that, you're playing with house money.
Negotiation context
- It's been on market 40 days — a 3% lower offer ($39k) is reasonable based on typical stale-listing flexibility.
- 4 sale attempts with the ask held roughly flat each time — persistent listings suggest the price (not the market) is what's stuck; bring a comps-based counter.
- Current owner paid $8k; list at $40k implies a 371% gain — meaningful room to come down on a strong offer.
Risks & watch-outs
- Watch-outs: property tax is 2.9% of price; built in 1910 — expect roof / HVAC / electrical / plumbing capex.
- Climate carrying-cost: major flood risk — expect insurance premiums to compound above CPI over the hold.
Questions for the listing agent
- It's been on market 40 days. Have you received any prior offers? Is the seller open to a 3% concession, seller financing, or rate buy-down credit?
- Built in 1910 — when were the roof, HVAC, electrical panel, plumbing, and water heater last replaced?
- Property tax is high relative to price — has the assessment been appealed recently, and will the sale trigger a re-assessment?
- Is there a deadline driving the sale (1031 exchange, divorce, estate, relocation)? That informs how much negotiation room exists.
- Schools are F-rated, which usually means shorter tenancies and higher turnover. Who's the typical renter profile here, and what's been the actual vacancy rate?
- Crime grade is F in this area — have there been break-ins, vandalism, or insurance claims at this property in the last 3 years? What carrier currently insures it and at what premium?
- What's the average days-on-market for RENTAL listings here right now (not sales)? A rising rental-DOM trend means longer vacancies and softer asking-rent achievability than the comps imply.
- What's the recent tenant-quality profile in this submarket — average credit score on applications, eviction rate, late-payment / NSF rate, and stable-employment percentage? A property-management company in the area should have these aggregated.
- How much new for-sale + rental construction is in the pipeline within 1–3 miles? Heavy new supply typically softens prices + rents 12–24 months out; constrained supply supports both.
Investment metrics
- 1% rule
- 3.38% ✓
- Cap rate
- 28.68%
- Cash-on-cash
- 79.97%
- DSCR
- 4.56
- GRM
- 2.5
CMA / ARV
- ARV (median comp)
- $64,366
- List price
- $40,000
- Delta
- -37.86%
- Verdict
- UNDERPRICED
- Comps
- 20 within 1.0 mi
Show comp detail 12 sales within ~0.75 mi
| Address | Dist | Beds/Ba | Sqft | Sold | Price | $/sf | Match |
|---|---|---|---|---|---|---|---|
| 902 N Horsman St | 0.00mi | 3/1.0 | 1,008 (0%) | 0mo | $35,000 | $35 | 100 |
| 1029 Woodlawn Ave | 0.25mi | 3/1.0 | 1,121 (+11%) | 11mo | $70,666 | $63 | 61 |
| 1816 N Winnebago St | 0.73mi | 2/1.0 (-1) | 1,009 (+0%) | 6mo | $76,000 | $75 | 55 |
| 933 Ridge Ave | 0.40mi | 2/1.0 (-1) | 915 (-9%) | 8mo | $90,000 | $98 | 54 |
| 1710 N Winnebago St | 0.66mi | 3/1.0 | 1,077 (+7%) | 8mo | $119,000 | $110 | 51 |
| 2515 N Knight Ave | 0.69mi | 3/1.0 | 957 (-5%) | 12mo | $85,000 | $89 | 49 |
| 444 Forest Ave | 0.59mi | 3/1.5 | 875 (-13%) | 5mo | $44,000 | $50 | 45 |
| 1619 Evergreen St | 0.59mi | 2/1.0 (-1) | 1,116 (+11%) | 8mo | $61,500 | $55 | 43 |
| 1611 N Horsman St | 0.56mi | 2/1.5 (-1) | 1,114 (+10%) | 7mo | $123,750 | $111 | 43 |
| 1719 Carney Ave | 0.72mi | 2/1.0 (-1) | 894 (-11%) | 0mo | $50,000 | $56 | 42 |
| 2903 Yonge St | 0.65mi | 3/1.0 | 1,116 (+11%) | 11mo | $108,500 | $97 | 42 |
| 1316 Arthur Ave Ave | 0.72mi | 3/1.0 | 912 (-10%) | 12mo | $70,000 | $77 | 40 |
Match score weights: distance 35% · size 25% · config 20% · recency 20%. Top-matched comps best support the ARV.
Projected returns pro-forma
-3.0% appreciation · 3.0% rent growth · sell at horizon
- IRR
- 80.2%
- Equity multiple
- 4.67×
- Total profit
- $41,105
- Equity at exit
- $5,964
- IRR
- 83.6%
- Equity multiple
- 9.68×
- Total profit
- $97,206
- Equity at exit
- $3,458
Cash invested: $11,200 (down + closing). Projections, not guarantees.
Landlord ↔ Tenant lean methodology
- Overall (STATE)
- 43 Moderately Tenant-Leaning
- State Illinois
- 43 Moderately Tenant-Leaning · D+7
- County
- — inherits STATE
- City
- — inherits STATE
ZIP-level market 61101
- Home prices YoY
- -25.4%
- Active inventory
- 76
- Price-to-rent
- 2.5×
Monthly cashflow live
- Estimated rent
- $1,354 high interval (Pro) →
- Mortgage (P&I)
- −$210
- Tax from tax record
- −$97 /mo · $1,161/yr
- Insurance
- −$17
- HOA
- −$0
- Vacancy / Maint / Mgmt
- −$284
- Net cashflow
- $746
Break-even live
UW: 25.0% down · 7.5% · 30yr · 1.5% tax · 5.0% vac · 8.0% maint · 8.0% mgmt
Financing live
Cash to close
- Down payment
- $10,000
- Closing costs
- $1,200
- Reserves months
- —
- Total cash needed
- —
Loan-product check · same deal, 3 products live
Conventional
25% down · 7.5% · 30yr
- Down + closing
- —
- Monthly P&I
- —
- Monthly cashflow
- —
- DSCR
- —
- Eligible?
- —
Personal DTI + credit; lowest rate.
DSCR
20% down · 8.5% · 30yr
- Down + closing
- —
- Monthly P&I
- —
- Monthly cashflow
- —
- DSCR
- —
- Eligible?
- —
No personal income docs; deal must DSCR.
Hard money
10% down · 12.0% · 12mo
- Down + closing
- —
- Monthly P&I
- —
- Monthly cashflow
- —
- DSCR
- —
- Eligible?
- —
Short-term bridge; refi at stabilization.
Rent comps 34 comps
| Address | Beds | Baths | Sqft | Rent | $/sqft | DOM | Units | Dist |
|---|---|---|---|---|---|---|---|---|
| 728 N Winnebago St Rockford, IL | 4.0 | 1.0 | 1250 | $1,600 | $1.28 | 13d | 1 | 0.23mi |
| 2422 Benderwirt Ave Unit 2422-1 Rockford, IL | 2.0 | 1.0 | 1150 | $1,025 | $0.89 | 43d | 1 | 0.38mi |
| 920 N Church St Rockford, IL | 2.0 | 1.0 | 750 | $1,295 | $1.73 | 13d | 4 | 0.50mi |
| 922 N Church St Rockford, IL | 2.0 | 2.0 | 1150 | $1,450 | $1.26 | 43d | 1 | 0.52mi |
| 1146 Fairview Ave Rockford, IL | 4.0 | 1.5 | 1344 | $1,250 | $0.93 | 21d | 1 | 0.54mi |
| 1614 Pauline Ave Rockford, IL | 2.0 | 1.0 | 956 | $1,400 | $1.46 | 43d | 1 | 0.57mi |
| 913 N Main St Rockford, IL | 2.0 | 1.0–2.0 | 1050 | $2,300 | $2.19 | 21d | 1 | 0.64mi |
| 1904 Auburn St Unit 1904-4 Rockford, IL | 2.0 | 1.0 | 800 | $1,050 | $1.31 | 43d | 1 | 0.66mi |
| 203 Carlton Ter Rockford, IL | 2.0 | 1.0 | 900 | $1,250 | $1.39 | 21d | 1 | 0.69mi |
| 1121 N Church St Rockford, IL | 2.0 | 1.0 | 900 | $1,200 | $1.33 | 21d | 1 | 0.71mi |
| 418 Orchard Park Rockford, IL | 3.0 | 1.0 | 1232 | $1,500 | $1.22 | 13d | 1 | 0.76mi |
| 912 Furman St Rockford, IL | 2.0 | 1.0 | 1000 | $1,300 | $1.30 | 13d | 1 | 0.78mi |
| 1617 Vermont St Rockford, IL | 2.0 | 1.0 | 1375 | $1,325 | $0.96 | 43d | 1 | 0.79mi |
| 1401 N Court St Rockford, IL | 2.0 | 1.0 | 850 | $950 | $1.12 | 43d | 1 | 0.80mi |
| 1510 School St Unit 1 Rockford, IL | 3.0 | 1.5 | 1400 | $1,200 | $0.86 | 43d | 1 | 0.83mi |
| 1116 Irving Ave Unit 1116-301 Rockford, IL | 2.0 | 1.0 | 800 | $950 | $1.19 | 21d | 1 | 0.92mi |
| 207 N Central Ave Rockford, IL | 4.0 | 1.5 | 1296 | $1,500 | $1.16 | 13d | 1 | 0.96mi |
| 607 N 2nd St Unit 607-6 Rockford, IL | 2.0 | 1.0 | 875 | $950 | $1.09 | 43d | 1 | 1.02mi |
| 924 N Sunset Ave Rockford, IL | 2.0 | 1.0 | 725 | $1,050 | $1.45 | 13d | 1 | 1.10mi |
| 2011 School St Rockford, IL | 3.0 | 1.0 | 950 | $1,500 | $1.58 | 43d | 1 | 1.14mi |
| 2330 Kilburn Ave Rockford, IL | 2.0–3.0 | 1.0–2.0 | 950 | $1,199 | $1.26 | 13d | 1 | 1.14mi |
| 1832 N Main St Rockford, IL | 2.0–3.0 | 1.0–2.0 | 872 | $1,199 | $1.37 | 13d | 1 | 1.14mi |
| 1826 Green St Rockford, IL | 2.0 | 1.0 | 1000 | $1,300 | $1.30 | 21d | 1 | 1.24mi |
| 314 N Longwood St Rockford, IL | 2.0 | 1.0 | 1060 | $1,100 | $1.04 | 43d | 1 | 1.26mi |
| 2222 Andrews St Rockford, IL | 4.0 | 1.0 | 1400 | $1,600 | $1.14 | 13d | 1 | 1.29mi |
| 1112 Crosby St Rockford, IL | 2.0 | 1.0 | 1000 | $1,050 | $1.05 | 21d | 1 | 1.30mi |
| 2305 School St Unit 2305-7 Rockford, IL | 2.0 | 1.0 | 875 | $995 | $1.14 | 43d | 1 | 1.32mi |
| 2208 Fremont St Rockford, IL | 3.0 | 1.0 | 938 | $1,400 | $1.49 | 13d | 1 | 1.34mi |
| 2308 Fremont St Rockford, IL | 3.0 | 1.0 | 1320 | $1,600 | $1.21 | 43d | 1 | 1.39mi |
| 1138 Revell Ave Rockford, IL | 2.0 | 1.0 | 900 | $800 | $0.89 | 43d | 1 | 1.40mi |
| 2215 Hecker Ave Unit 2215 Rockford, IL | 3.0 | 1.0 | 800 | $1,095 | $1.37 | 43d | 1 | 1.43mi |
| 2403 Elm St Rockford, IL | 2.0 | 1.0 | 1373 | $1,400 | $1.02 | 43d | 1 | 1.44mi |
| 2403 Elm St Rockford, IL | 2.0 | 1.0 | 1373 | $1,400 | $1.02 | 13d | 1 | 1.44mi |
| 2315 Green St Rockford, IL | 3.0 | 1.0 | 1290 | $1,600 | $1.24 | 43d | 1 | 1.49mi |
Listing history 7 events
-
2026-05-08status Active 307-char remark
Show marketing remark (307 chars)
Attention investors and rehabbers! Opportunity awaits with this 2-story home featuring 3 bedrooms, 1 bathroom, and a detached 1-car garage. The property needs major rehab work and is currently condemned, making it best suited for experienced buyers ready to take on a full renovation. Cash only. Sold as-is.
-
2026-05-04status Pending 307-char remark
Show marketing remark (307 chars)
Attention investors and rehabbers! Opportunity awaits with this 2-story home featuring 3 bedrooms, 1 bathroom, and a detached 1-car garage. The property needs major rehab work and is currently condemned, making it best suited for experienced buyers ready to take on a full renovation. Cash only. Sold as-is.
-
2026-04-14$40,000 Active 307-char remark
Show marketing remark (307 chars)
Attention investors and rehabbers! Opportunity awaits with this 2-story home featuring 3 bedrooms, 1 bathroom, and a detached 1-car garage. The property needs major rehab work and is currently condemned, making it best suited for experienced buyers ready to take on a full renovation. Cash only. Sold as-is.
-
2004-07-09soldstatus $8,500
ⓘ Source: listings_history table (triggers on properties + properties_extension) + one-shot
backfill from property_details.listing_events for pre-trigger history.
Tax reassessment forecast IL · Partial reset (capped growth)
- Current annual tax
- $1,161 · $97/mo
- Projected year-2 tax
- $1,161 · $97/mo
- Expected delta
- $0/yr ($0/mo · 0.0%)
ⓘ Screening estimate from a state-policy table — verify with the county assessor before closing.
Climate risk First Street
- Flood 6/10 Major FEMA zone X (unshaded) · 72% chance over 30 yrs
- Wildfire 1/10 Low
- Heat 2/10 Low 7 d/yr ≥102°F today · 15 d/yr by 30 yrs out
- Wind 2/10 Low
- Air quality 2/10 Low 1 unhealthy d/yr today · 2 by 30 yrs out
Nearby sold comps map
Loading sold comps map…
Walkable amenities ~0.75 mi
Loading nearby amenities…
Taxation est. · year 1
- Rental income
- $16,246
- − Mortgage interest
- −$2,241
- − Property taxes
- −$1,161
- − Insurance
- −$200
- − Repairs & maintenance
- −$1,300
- − Management
- −$1,300
- − Depreciation
- −$1,164
- Taxable income
- $8,882
- Est. tax owed @ 24.0%
- −$2,132
- After-tax cash flow
- $6,825/yr
For passive investors: Depreciation is non-cash, so a rental often shows a tax loss while cash-flowing — sheltering income. Rental losses are passive: they offset passive income freely, and up to $25,000/yr can offset ordinary (W-2) income if you actively participate and your MAGI is under $100k (phasing out to $0 by $150k); unused losses carry forward. On sale, claimed depreciation is recaptured at up to 25%, and gains may owe capital-gains tax (a 1031 exchange can defer both). Figures are a year-1 estimate at your 24.0% rate — not tax advice; consult a CPA.
Schools (NCES district)
- District
- Rockford SD 205
- NCES district ID
- 1734510
- Math proficiency
- 12% ▼ -2.00%
- Reading proficiency
- 16% ▼ -3.00%
- Median HH income
- $42,533
- Composite
- 12.21/100
- National rank
- #9649
- State rank
- #533 of 620 in IL
Livability — Rockford
- Score
- 62/100
- State rank
- #876
- US rank
- #17035
Category grades
Schools grade is shown separately in the Schools card above.
Census & demographics
- Census place
- Rockford, IL
- County
- Winnebago County · 147,297 people
- City population
- 147,297
- Metro
- Rockford, IL
- Population (ZIP)
- 19,318
- Household income
- $46,163
- Rent vs Own
- Severe rent burden
- 1170.0
Population outlook (Winnebago County) Hauer SSP2
- Today (2025)
- 271,080 people
- By 2030
- 260,684 · -3.8%
- By 2040
- 238,405 · -12.1%
- By 2050
- 216,129 · -20.3%
- By 2075
- 172,882 · -36.2%
- By 2100
- 135,336 · -50.1%
Race, ethnicity, and origin ACS 2023
- Neighborhood character
- Diverse neighborhood (Simpson 0.66)
- Race & ethnicity
- White 44% Black 34% Hispanic / Latino 16% Two or more races 8% Asian 1%
- Hispanic origin (detail)
- Mexican 14% Puerto Rican 1%
- Common ancestry
- Romanian 3% Italian 2% Portuguese 2%
- Foreign-born
- 9% · Canada
- Languages at home
- 84% English-only · Spanish 13% Other Indo-European 1% Russian/Polish/Slavic 1%
Political lean MEDSL · Winnebago
- 2024 margin
- Toss-up / Even · D 49.5% · R 49.0% · Other 1.5%
- 2008→2024 swing
- -12.2pp toward R · 2008: 12.8pp · 2024: 0.6pp
- All cycles
- 2024: D+0.6 2020: D+2.5 2016: R+1.2 2012: D+5.7 2008: D+12.8
Not yet ingested
- Civics
- —
Market trends
- HPI YoY
- ▼ -69.58%
- Current HPI
- 204.8946
- Rent YoY
- —
- Metro
- Rockford, IL
- State GDP YoY
- ▲ 1.59%
- F500 in state
- 60
Industry mix (Fortune 500 HQ in IL)
| Industry | F500 HQs | Revenue |
|---|---|---|
| Insurance | 4 | $201B |
|
||
| Consumer Goods | 4 | $87B |
|
||
| Industrial Machinery | 3 | $64B |
|
||
| Healthcare | 2 | $55B |
|
||
| Retail / Pharmacy | 1 | $148B |
|
||
| Agriculture / Food | 1 | $86B |
|
||
Price history
+370.6% since first listed7 events — show timeline
- 2026-05-08 Relisted — NWIAR
- 2026-05-08 Relisted — MRED as Distributed by MLS Grid
- 2026-05-04 Pending — NWIAR
- 2026-05-04 Pending — MRED as Distributed by MLS Grid
- 2026-04-14 Listed $40,000 MRED as Distributed by MLS Grid
- 2026-04-14 Listed $40,000 NWIAR
- 2004-07-09 Sold (Public Records) $8,500 Public Records
Property tax history
+0.4%/yrLatest (2024): $1,161 · +3.5% YoY. Source: county tax records.
Cash-flow waterfall
monthlySold comps — $/sqft
last 12 mo · ≤1 miLoading sold comps…