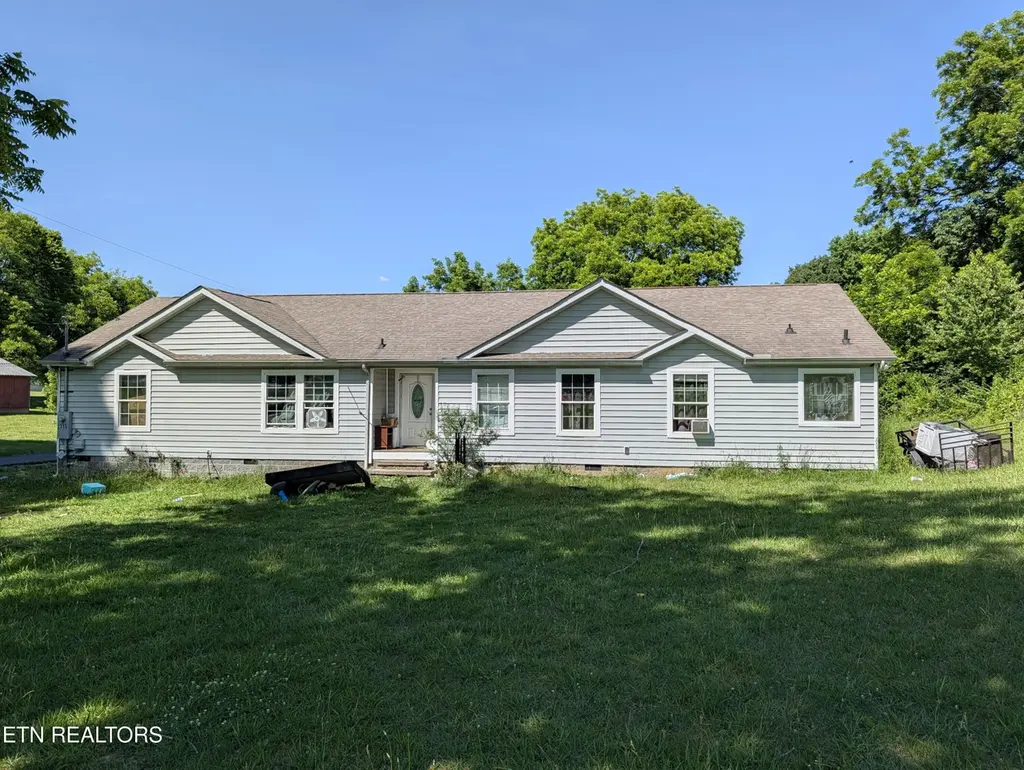
2315 Tuckaleechee Pike · Maryville, TN
Flood risk 6/10 · Moderate
- FEMA flood zone
- X (unshaded)
- Chance of flooding over 30 yrs
- 0.75%
- Est. flood insurance / yr
- $507 – $1,088
Fire risk 4/10 · Minor
- Est. fire insurance / yr
- $949 – $1,763
Heat risk 6/10 · Moderate
- Hot days now (above 103°F)
- 7 days/yr
- Hot days in 30 yrs
- 20 days/yr
Wind risk 2/10 · Minimal
- Chance of severe wind over 30 yrs
- 0.0%
Air-quality risk 3/10 · Minor
- Unhealthy air days now
- 2 days/yr
- Unhealthy air days in 30 yrs
- 2 days/yr
Risk factors via First Street. Map © Google.
Why this score? — see what drove the C+ grade
The composite is a weighted blend of 9 inputs, each scored 0–100. Each bar is that input's sub-score; the figure is the points it added to the 100-point composite (weight × sub-score).
- Cash flow +27.0/30.0
- DSCR +9.3/10.0
- ARV discount +7.5/15.0
- 1% rule +6.5/10.0
- Schools +4.8/10.0
- Livability +3.6/5.0
- Rent growth +2.5/5.0
- Condition / age +2.5/5.0
- Appreciation +0.0/10.0
$215,000
🖨 Deal sheet 📄 Offer letter ✓ Due diligence
Listing remarks
Opportunity awaits with this 3-bedroom, 2-bath home situated on a level lot--perfect for investors or buyers looking to add value. The living room features a unique double-sided wood-burning fireplace. The spacious primary suite offers a large bathroom complete with a walk-in shower and generous walk-in closet. The oversized laundry room has plenty of space for storage or functionality. With solid bones and great layout potential, this home is ready for your vision and a little TLC to make it shine. Don't miss the chance to transform this property into something special.
Key facts
- Walk-in closet
- Walk-in shower
- 0.51 acre lot
Tags
Property features AI
Finance
- Other: Lot size approximately 0.51 acre (source: tax records)
- Financial info: Financial details not provided
- HOA & community: HOA information not provided
Exterior
- Parking: On-street parking
- Security: Security information not provided
- Utilities: Public sewer
- Home design: Not attached to another unit; Total building area: 2,160 (source: tax records)
- Construction: Vinyl siding; Frame construction; Crawl space foundation
- Exterior features: Vinyl windows; Level lot
Interior
- Kitchen: Microwave
- Bedrooms: Bedrooms information not provided
- Flooring: Laminate flooring; Tile flooring
- Bathrooms: 2 full bathrooms
- Heating & cooling: Central heating (electric); Central cooling; Ceiling fan(s)
- Interior features: Walk-in closet(s); 6 total rooms; Wood-burning fireplace (1)
- Laundry & utility: Laundry information not provided
Neighborhood map
What this means for you Summary
Snapshot
- This is a 3-bed/2.0-bath manufactured listed at $215k.
Deal economics
- At list price, monthly cash flow is $600 ($7k/yr) — positive.
- The deal already cash-flows at list — no discount required.
- Meets the 1% rule at list price ($2k rent vs $215k).
- Cap rate 9.6% vs local median 3.7% in Maryville — top-decile yield for the area; either an underpriced asset or a hidden risk that comps aren't pricing in. Stress-test before assuming the spread holds.
Location & tenants
- Location reads 71/100 on livability (#38 in TN) — a middle-class / working-renter tenant base. Strengths: crime A+, cost of living A+, housing A+; Watch: amenities D, commute F, health & safety F.
- Maryville (suburban): math 58% / reading 55% proficiency, ranked #5 of 139 in TN (top 4%) — acceptable for families but not a draw, mixed tenant base, ~2y average lease.
- Market conditions: 210 active listings in the ZIP; 5 comparable units currently listed for rent nearby; rentals at typical pace (median 22d on market — plan ~3-4 weeks tenant-placement turnaround); solid renter incomes; 937 units permitted in Blount County in 2024 (57 in 5+ unit buildings).
- This rent runs 35% of the median local income ($83k/yr) — at the standard rent-burdened threshold; future hikes will face affordability resistance.
Forward outlook
- Local home prices are declining (-3.0%/yr); year-one equity from $1k of loan paydown is wiped out by about $6k of value loss. Plan a longer hold.
- Blount County population projected at +8% by 2050 — modest demand growth; plan on rents tracking national, not racing it.
- At projected returns (-3.0% appreciation + 3.0% rent growth), your $60k cash investment doubles in ~10 years — after that, you're playing with house money.
Negotiation context
- Only 13 days on market — expect competitive offers; lowballing is unlikely to land.
Risks & watch-outs
- Climate carrying-cost: major flood risk; extreme-heat days projected 7→20/yr by 2055 (HVAC capex compounding) — expect insurance premiums to compound above CPI over the hold.
Questions for the listing agent
- Is there a deadline driving the sale (1031 exchange, divorce, estate, relocation)? That informs how much negotiation room exists.
- What's the average days-on-market for RENTAL listings here right now (not sales)? A rising rental-DOM trend means longer vacancies and softer asking-rent achievability than the comps imply.
- What's the recent tenant-quality profile in this submarket — average credit score on applications, eviction rate, late-payment / NSF rate, and stable-employment percentage? A property-management company in the area should have these aggregated.
- How much new for-sale + rental construction is in the pipeline within 1–3 miles? Heavy new supply typically softens prices + rents 12–24 months out; constrained supply supports both.
Investment metrics
- 1% rule
- 1.15% ✓
- Cap rate
- 9.64%
- Cash-on-cash
- 11.95%
- DSCR
- 1.53
- GRM
- 7.3
CMA / ARV
No comps found within radius.
Projected returns pro-forma
-3.0% appreciation · 3.0% rent growth · sell at horizon
- IRR
- 1.4%
- Equity multiple
- 1.05×
- Total profit
- $3,306
- Equity at exit
- $32,057
- IRR
- 11.0%
- Equity multiple
- 1.86×
- Total profit
- $51,860
- Equity at exit
- $18,589
Cash invested: $60,200 (down + closing). Projections, not guarantees.
Landlord ↔ Tenant lean methodology
- Overall (STATE)
- 87 Strongly Landlord-Friendly
- State Tennessee
- 87 Strongly Landlord-Friendly · R+13
- County
- — inherits STATE
- City
- — inherits STATE
ZIP-level market 37803
- Home prices YoY
- -24.9%
- Active inventory
- 210
- Price-to-rent
- 7.3×
Monthly cashflow live
- Estimated rent
- $2,462 high interval (Pro) →
- Mortgage (P&I)
- −$1,127
- Tax from tax record
- −$128 /mo · $1,541/yr
- Insurance
- −$90
- HOA
- −$0
- Vacancy / Maint / Mgmt
- −$517
- Net cashflow
- $600
Break-even live
UW: 25.0% down · 7.5% · 30yr · 1.5% tax · 5.0% vac · 8.0% maint · 8.0% mgmt
Financing live
Cash to close
- Down payment
- $53,750
- Closing costs
- $6,450
- Reserves months
- —
- Total cash needed
- —
Loan-product check · same deal, 3 products live
Conventional
25% down · 7.5% · 30yr
- Down + closing
- —
- Monthly P&I
- —
- Monthly cashflow
- —
- DSCR
- —
- Eligible?
- —
Personal DTI + credit; lowest rate.
DSCR
20% down · 8.5% · 30yr
- Down + closing
- —
- Monthly P&I
- —
- Monthly cashflow
- —
- DSCR
- —
- Eligible?
- —
No personal income docs; deal must DSCR.
Hard money
10% down · 12.0% · 12mo
- Down + closing
- —
- Monthly P&I
- —
- Monthly cashflow
- —
- DSCR
- —
- Eligible?
- —
Short-term bridge; refi at stabilization.
Rent comps 5 comps
| Address | Beds | Baths | Sqft | Rent | $/sqft | DOM | Units | Dist |
|---|---|---|---|---|---|---|---|---|
| 212 Janet Ln Maryville, TN | 3.0 | 2.5 | 2200 | $2,500 | $1.14 | 23d | 1 | 0.37mi |
| 241 Whistlestop Ln Maryville, TN | 3.0 | 2.5 | 1589 | $2,100 | $1.32 | 11d | 1 | 0.76mi |
| 1909 Rommel Dr Maryville, TN | 3.0 | 2.0 | 1689 | $2,300 | $1.36 | 21d | 1 | 0.90mi |
| 1613 Sevierville Rd Maryville, TN | 3.0 | 2.5 | 1500 | $2,300 | $1.53 | 23d | 1 | 1.25mi |
| 411 Leeds Ct Maryville, TN | 3.0 | 2.0 | 1852 | $2,610 | $1.41 | 19d | 1 | 1.34mi |
Listing history 12 events
-
2026-06-18days on market $215,000 Active 13 DOM
-
2026-06-17price $215,000 Active 12 DOM
-
2026-06-17days on market $235,000 Active 12 DOM
-
2026-06-16days on market $235,000 Active 11 DOM
-
2026-06-15days on market $235,000 Active 10 DOM
-
2026-06-14days on market $235,000 Active 8 DOM
-
2026-06-13days on market $235,000 Active 7 DOM
-
2026-06-10days on market $235,000 Active 5 DOM
-
2026-06-09days on market $235,000 Active 4 DOM
-
2026-06-08days on market $235,000 Active 3 DOM
-
2026-06-07remarks 577-char remark
-
2026-06-07$235,000 Active 2 DOM
ⓘ Source: listings_history table (triggers on properties + properties_extension) + one-shot
backfill from property_details.listing_events for pre-trigger history.
Tax reassessment forecast TN · Resets to sale price
- Current annual tax
- $1,541 · $128/mo
- Projected year-2 tax
- $1,541 · $128/mo
- Expected delta
- $0/yr ($0/mo · 0.0%)
ⓘ Screening estimate from a state-policy table — verify with the county assessor before closing.
Climate risk First Street
- Flood 6/10 Major FEMA zone X (unshaded) · 75% chance over 30 yrs
- Wildfire 4/10 Moderate
- Heat 6/10 Major 7 d/yr ≥103°F today · 20 d/yr by 30 yrs out
- Wind 2/10 Low 0% chance of damaging wind over 30 yrs
- Air quality 3/10 Moderate 2 unhealthy d/yr today · 2 by 30 yrs out
Nearby sold comps map
Loading sold comps map…
Walkable amenities ~0.75 mi
Loading nearby amenities…
Taxation est. · year 1
- Rental income
- $29,547
- − Mortgage interest
- −$12,043
- − Property taxes
- −$1,541
- − Insurance
- −$1,075
- − Repairs & maintenance
- −$2,364
- − Management
- −$2,364
- − Depreciation
- −$6,255
- Taxable income
- $3,905
- Est. tax owed @ 24.0%
- −$937
- After-tax cash flow
- $6,259/yr
For passive investors: Depreciation is non-cash, so a rental often shows a tax loss while cash-flowing — sheltering income. Rental losses are passive: they offset passive income freely, and up to $25,000/yr can offset ordinary (W-2) income if you actively participate and your MAGI is under $100k (phasing out to $0 by $150k); unused losses carry forward. On sale, claimed depreciation is recaptured at up to 25%, and gains may owe capital-gains tax (a 1031 exchange can defer both). Figures are a year-1 estimate at your 24.0% rate — not tax advice; consult a CPA.
Schools (NCES district)
- District
- Maryville
- NCES district ID
- 4702700
- Math proficiency
- 58% ▼ -3.00%
- Reading proficiency
- 55% ▼ -3.00%
- Median HH income
- $52,318
- Composite
- 48.42/100
- National rank
- #2134
- State rank
- #5 of 139 in TN
Livability — Maryville
- Score
- 71/100
- State rank
- #38
- US rank
- #6533
Category grades
Schools grade is shown separately in the Schools card above.
Census & demographics
- Census place
- Maryville, TN
- County
- Blount County · 112,418 people
- City population
- 89,294
- Metro
- Knoxville, TN
- Population (ZIP)
- 33,822
- Household income
- $83,446
- Rent vs Own
- Severe rent burden
- 453.0
Population outlook (Blount County) Hauer SSP2
- Today (2025)
- 135,873 people
- By 2030
- 139,460 · +2.6%
- By 2040
- 144,767 · +6.5%
- By 2050
- 147,393 · +8.5%
- By 2075
- 151,597 · +11.6%
- By 2100
- 147,393 · +8.5%
Race, ethnicity, and origin ACS 2023
- Neighborhood character
- Predominantly White (92%)
- Race & ethnicity
- White 92% Two or more races 5% Hispanic / Latino 3% Black 1%
- Common ancestry
- Serbian 4% Slovak 3% Italian 2%
- Foreign-born
- 1% · Canada
- Languages at home
- 98% English-only · Spanish 2%
Political lean MEDSL · Blount
- 2024 margin
- Solid R (+47.7) · D 25.5% · R 73.2% · Other 1.2%
- 2008→2024 swing
- -8.4pp toward R · 2008: -39.4pp · 2024: -47.7pp
- All cycles
- 2024: R+47.7 2020: R+44.2 2016: R+48.8 2012: R+45.7 2008: R+39.4
Not yet ingested
- Civics
- —
Market trends
- HPI YoY
- ▼ -104.87%
- Current HPI
- 317.1439
- Rent YoY
- —
- Metro
- Knoxville, TN
- State GDP YoY
- ▲ 2.78%
- F500 in state
- 22
Industry mix (Fortune 500 HQ in TN)
| Industry | F500 HQs | Revenue |
|---|---|---|
| Healthcare | 3 | $91B |
|
||
| Retail | 3 | $72B |
|
||
| Transportation / Logistics | 1 | $88B |
|
||
| Paper / Packaging | 1 | $19B |
|
||
| Insurance | 1 | $13B |
|
||
| Energy | 1 | $12B |
|
||
Price history
1 event — show timeline
- 2026-06-05 Listed $235,000 Knoxville MLS
Property tax history
+1.1%/yrLatest (2025): $1,541 · +0.0% YoY. Source: county tax records.
Cash-flow waterfall
monthlySold comps — $/sqft
last 12 mo · ≤1 miLoading sold comps…