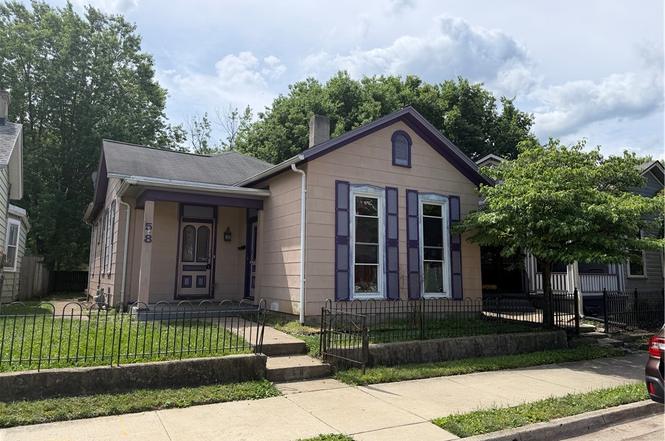
58 Clover St · Dayton, OH
Flood risk 4/10 · Minor
- FEMA flood zone
- X (unshaded)
- Chance of flooding over 30 yrs
- 0.2%
- Est. flood insurance / yr
- $473 – $860
Fire risk 1/10 · Minimal
- Est. fire insurance / yr
- $713 – $1,323
Heat risk 4/10 · Minor
- Hot days now (above 101°F)
- 7 days/yr
- Hot days in 30 yrs
- 18 days/yr
Wind risk 2/10 · Minimal
- Chance of severe wind over 30 yrs
- 0.0%
Air-quality risk 3/10 · Minor
- Unhealthy air days now
- 3 days/yr
- Unhealthy air days in 30 yrs
- 5 days/yr
Risk factors via First Street. Map © Google.
Why this score? — see what drove the B+ grade
The composite is a weighted blend of 9 inputs, each scored 0–100. Each bar is that input's sub-score; the figure is the points it added to the 100-point composite (weight × sub-score).
- Cash flow +29.7/30.0
- ARV discount +15.0/15.0
- DSCR +10.0/10.0
- 1% rule +9.1/10.0
- Rent growth +5.0/5.0
- Livability +3.2/5.0
- Condition / age +2.5/5.0
- Schools +1.3/10.0
- Appreciation +0.0/10.0
$99,900
🖨 Deal sheet 📄 Offer letter ✓ Due diligence
Listing remarks
Attention investors, flippers, and buyers looking to restore a piece of history! Located in the heart of Historic South Park, this classic home is ready for its next chapter. Owned and lovingly occupied by the same owner for more than 50 years, the property offers the character and craftsmanship that are increasingly difficult to find. Yes, it needs rehabilitation, but the bones are here. Original wood floors, beautiful period doors, transom windows above interior doorways, over 1,400 square feet of living space, a third bedroom upstairs, and a detached garage all provide the framework for a remarkable restoration or renovation project. Whether you are an investor seeking your next opportun
Key facts
- Transom windows
- Original wood floors
- Detached garage
Tags
Property features AI
Finance
- Financial info: Property is offered for sale
Exterior
- Parking: Detached one-car garage
- Utilities: Public water available
- Home design: Aluminum siding exterior; Slab foundation
- Construction: Aluminum siding construction
- Exterior features: Lot dimensions approximately 35 x 124; Lot roughly 0.10 acres; Residential zoning
Interior
- Bedrooms: Main-level bedroom (12 x 12); Main-level bedroom (10 x 12); Additional main-level room (14 x 12) — listed dimensions
- Bathrooms: Two full bathrooms (both on the main level)
- Heating & cooling: Central air conditioning; Forced air heating (natural gas)
- Interior features: Bonus room on the second floor (24 x 14); Dining room on main level (11 x 11); Living room on main level (12 x 14)
Neighborhood map
What this means for you Summary
Snapshot
- This is a 3-bed/1.0-bath single-family listed at $100k.
Deal economics
- At list price, monthly cash flow is $365 ($4k/yr) — positive.
- The deal already cash-flows at list — no discount required.
- Meets the 1% rule at list price ($1k rent vs $100k).
- Cap rate 10.7% vs local median 7.4% in Dayton — top-decile yield for the area; either an underpriced asset or a hidden risk that comps aren't pricing in. Stress-test before assuming the spread holds.
Location & tenants
- Location reads 65/100 on livability (#716 in OH) — a middle-class / working-renter tenant base. Strengths: cost of living A+, housing A+, health & safety A; Watch: schools C-, amenities C-, crime F.
- Dayton City (urban): math 12% / reading 21% proficiency, ranked #641 of 656 in OH (top 98%) — low school quality limits family demand, transient renter base, plan for 1-2y turnover; 74% free/reduced lunch — lower-income household profile, screen leases tightly.
- Market conditions: Rents rising fast (+11.4%/yr); 92 active listings in the ZIP; 40 comparable units currently listed for rent nearby; rentals at typical pace (median 23d on market — plan ~3-4 weeks tenant-placement turnaround); 907 units permitted in Montgomery County in 2024 (416 in 5+ unit buildings).
- This rent runs 36% of the median local income ($47k/yr) — at the standard rent-burdened threshold; future hikes will face affordability resistance.
Forward outlook
- Local home prices are declining (-3.0%/yr); year-one equity from $691 of loan paydown is wiped out by about $3k of value loss. Plan a longer hold.
- Montgomery County population projected at -10% by 2050 — secular population decline; favor cash flow + early exit over multi-decade hold.
- At projected returns (-3.0% appreciation + 8.0% rent growth), your $28k cash investment doubles in ~6 years — after that, you're playing with house money.
Negotiation context
- Only 1 days on market — expect competitive offers; lowballing is unlikely to land.
Risks & watch-outs
- Watch-outs: built in 1880 — expect roof / HVAC / electrical / plumbing capex.
Questions for the listing agent
- Built in 1880 — when were the roof, HVAC, electrical panel, plumbing, and water heater last replaced?
- Is there a deadline driving the sale (1031 exchange, divorce, estate, relocation)? That informs how much negotiation room exists.
- Crime grade is F in this area — have there been break-ins, vandalism, or insurance claims at this property in the last 3 years? What carrier currently insures it and at what premium?
- What's the average days-on-market for RENTAL listings here right now (not sales)? A rising rental-DOM trend means longer vacancies and softer asking-rent achievability than the comps imply.
- What's the recent tenant-quality profile in this submarket — average credit score on applications, eviction rate, late-payment / NSF rate, and stable-employment percentage? A property-management company in the area should have these aggregated.
- How much new for-sale + rental construction is in the pipeline within 1–3 miles? Heavy new supply typically softens prices + rents 12–24 months out; constrained supply supports both.
Investment metrics
- 1% rule
- 1.41% ✓
- Cap rate
- 10.68%
- Cash-on-cash
- 15.66%
- DSCR
- 1.70
- GRM
- 5.9
CMA / ARV
- ARV (on-the-fly)
- $166,320
- Comps found
- 12
Show comp detail 12 sales within ~0.75 mi
| Address | Dist | Beds/Ba | Sqft | Sold | Price | $/sf | Match |
|---|---|---|---|---|---|---|---|
| 52 Clover St | 0.01mi | 2/1.0 (-1) | 1,230 (+4%) | 2mo | $205,000 | $167 | 87 |
| 519 Wyoming St | 0.20mi | 3/1.5 | 1,240 (+4%) | 3mo | $152,614 | $123 | 79 |
| 16 Adams St | 0.39mi | 3/2.0 | 1,182 (-0%) | 3mo | $223,000 | $189 | 75 |
| 566 Wyoming St | 0.24mi | 3/1.0 | 1,290 (+9%) | 1mo | $180,000 | $140 | 74 |
| 129 Kastner Ave | 0.28mi | 3/2.0 | 1,104 (-7%) | 1mo | $35,000 | $32 | 70 |
| 120 Glencoe Ave | 0.42mi | 4/2.0 (+1) | 1,171 (-1%) | 3mo | $170,070 | $145 | 67 |
| 147 Henry St | 0.58mi | 2/1.0 (-1) | 1,159 (-2%) | 1mo | $170,000 | $147 | 63 |
| 39 Gebhart St | 0.59mi | 3/2.0 | 1,248 (+5%) | 1mo | $39,504 | $32 | 59 |
| 828 Xenia Ave | 0.67mi | 2/1.0 (-1) | 1,216 (+2%) | 3mo | $47,000 | $39 | 57 |
| 106 Pulaski St | 0.50mi | 3/1.0 | 1,033 (-13%) | 1mo | $105,000 | $102 | 54 |
| 17 Tecumseh St | 0.68mi | 2/2.0 (-1) | 1,294 (+9%) | 3mo | $225,000 | $174 | 42 |
| 208 Heaton Ave | 0.66mi | 2/1.0 (-1) | 1,032 (-13%) | 1mo | $57,500 | $56 | 41 |
Match score weights: distance 35% · size 25% · config 20% · recency 20%. Top-matched comps best support the ARV.
Projected returns pro-forma
-3.0% appreciation · 8.0% rent growth · sell at horizon
- IRR
- 12.3%
- Equity multiple
- 1.52×
- Total profit
- $14,577
- Equity at exit
- $14,895
- IRR
- 25.1%
- Equity multiple
- 3.75×
- Total profit
- $76,826
- Equity at exit
- $8,638
Cash invested: $27,972 (down + closing). Projections, not guarantees.
Landlord ↔ Tenant lean methodology
- Overall (STATE)
- 73 Landlord-Friendly
- State Ohio
- 73 Landlord-Friendly · R+6
- County
- — inherits STATE
- City
- — inherits STATE
ZIP-level market 45410
- Home prices YoY
- -21.4%
- Rents YoY
- 11.4%
- Active inventory
- 92
- Price-to-rent
- 5.9×
Monthly cashflow live
- Estimated rent
- $1,412 high interval (Pro) →
- Mortgage (P&I)
- −$524
- Tax from tax record
- −$185 /mo · $2,221/yr
- Insurance
- −$42
- HOA
- −$0
- Vacancy / Maint / Mgmt
- −$297
- Net cashflow
- $365
Break-even live
UW: 25.0% down · 7.5% · 30yr · 1.5% tax · 5.0% vac · 8.0% maint · 8.0% mgmt
Financing live
Cash to close
- Down payment
- $24,975
- Closing costs
- $2,997
- Reserves months
- —
- Total cash needed
- —
Loan-product check · same deal, 3 products live
Conventional
25% down · 7.5% · 30yr
- Down + closing
- —
- Monthly P&I
- —
- Monthly cashflow
- —
- DSCR
- —
- Eligible?
- —
Personal DTI + credit; lowest rate.
DSCR
20% down · 8.5% · 30yr
- Down + closing
- —
- Monthly P&I
- —
- Monthly cashflow
- —
- DSCR
- —
- Eligible?
- —
No personal income docs; deal must DSCR.
Hard money
10% down · 12.0% · 12mo
- Down + closing
- —
- Monthly P&I
- —
- Monthly cashflow
- —
- DSCR
- —
- Eligible?
- —
Short-term bridge; refi at stabilization.
Rent comps 40 comps
| Address | Beds | Baths | Sqft | Rent | $/sqft | DOM | Units | Dist |
|---|---|---|---|---|---|---|---|---|
| 519 Wyoming St Dayton, OH | 3.0 | 1.5 | 1240 | $1,600 | $1.29 | 43d | 1 | 0.21mi |
| 323 Xenia Ave Unit 323B Dayton, OH | 2.0 | 1.0 | 800 | $700 | $0.88 | 3d | 1 | 0.28mi |
| 25 Garret St Dayton, OH | 2.0 | 1.5 | 1364 | $1,750 | $1.28 | 23d | 1 | 0.28mi |
| 243 Oak St Dayton, OH | 3.0 | 1.5 | 1316 | $1,600 | $1.22 | 3d | 1 | 0.37mi |
| 213 Burns Ave Dayton, OH | 2.0 | 1.5 | 1388 | $1,500 | $1.08 | 14d | 1 | 0.47mi |
| 213 Burns Ave Dayton, OH | 2.0 | 1.5 | 1388 | $1,500 | $1.08 | 43d | 1 | 0.47mi |
| 425 Dayton Towers Dr Dayton, OH | 2.0 | 1.0–2.0 | 852 | $1,799 | $2.11 | 2d | 30 | 0.48mi |
| 619 Nathan Pl Dayton, OH | 2.0 | 1.0–2.0 | 729 | $1,608 | $2.21 | 2d | 7 | 0.48mi |
| 1020 Walnut Hill Pl Dayton, OH | 3.0 | 1.0 | 1200 | $1,400 | $1.17 | 43d | 1 | 0.51mi |
| 1038 Walnut Hill Pl Dayton, OH | 3.0 | 1.0 | 1232 | $1,095 | $0.89 | 43d | 1 | 0.52mi |
| 156 Gunckel Ave Apt 2 Dayton, OH | 2.0 | 1.0 | 800 | $700 | $0.88 | 23d | 1 | 0.62mi |
| 59 Green St Unit A Dayton, OH | 2.0 | 1.0 | 1100 | $1,350 | $1.23 | 3d | 1 | 0.65mi |
| 20 Lucerne Ave Dayton, OH | 3.0 | 1.0 | 1378 | $1,200 | $0.87 | 43d | 1 | 0.70mi |
| 322 S Patterson Blvd Unit 103 Dayton, OH | 2.0 | 2.0 | 910 | $1,700 | $1.87 | 43d | 1 | 0.71mi |
| 23 Jasper St Dayton, OH | 4.0 | 4.0 | 1490 | $3,600 | $2.42 | 3d | 1 | 0.79mi |
| 1411 Wyoming St Dayton, OH | 3.0 | 1.0 | 1256 | $1,095 | $0.87 | 2d | 1 | 0.83mi |
| 500 E 3rd St Dayton, OH | 1.0–2.0 | 1.0–2.0 | 935 | $1,660 | $1.78 | 3d | 16 | 0.86mi |
| 136 Indiana Ave Dayton, OH | 3.0 | 1.0 | 1194 | $1,250 | $1.05 | 23d | 1 | 0.87mi |
| 2132 Wayne Ave Dayton, OH | 3.0 | 2.0 | 1484 | $1,350 | $0.91 | 2d | 1 | 0.87mi |
| 2200 Wayne Ave Dayton, OH | 2.0 | 1.0 | 748 | $975 | $1.30 | 2d | 1 | 0.89mi |
| 313 Illinois Ave Dayton, OH | 3.0 | 1.0 | 1142 | $975 | $0.85 | 3d | 1 | 0.90mi |
| 920 E Stewart St Dayton, OH | 4.0 | 1.0 | 1322 | $1,425 | $1.08 | 43d | 1 | 0.90mi |
| 534 Beckman St Dayton, OH | 3.0 | 2.0 | 1452 | $1,400 | $0.96 | 2d | 1 | 0.91mi |
| 1515 Wyoming St Dayton, OH | 3.0 | 1.0 | 1400 | $1,000 | $0.71 | 43d | 1 | 0.91mi |
| 35 S Saint Clair St Dayton, OH | 1.0–2.0 | 1.0–2.0 | 918 | $1,844 | $2.01 | 3d | 18 | 0.92mi |
| 2200 E 5th St Dayton, OH | 2.0 | 1.0 | 1000 | $825 | $0.82 | 23d | 1 | 0.93mi |
| 112 Webster St Dayton, OH | 2.0 | 1.0–2.0 | 802 | $2,198 | $2.74 | 2d | 63 | 0.96mi |
| 2308 Wayne Ave Dayton, OH | 2.0 | 1.0 | 800 | $895 | $1.12 | 43d | 1 | 0.98mi |
| 15 John St Unit 15 Dayton, OH | 2.0 | 1.0 | 1200 | $800 | $0.67 | 23d | 1 | 0.99mi |
| 40 W 4th St Dayton, OH | 1.0–2.0 | 1.0–2.0 | 1118 | $2,200 | $1.97 | 43d | 7 | 1.02mi |
| 424 Bantz Ct Dayton, OH | 3.0 | 1.0 | 1192 | $1,050 | $0.88 | 3d | 1 | 1.04mi |
| 204 Sears St Dayton, OH | 3.0 | 1.0–2.5 | 1124 | $2,793 | $2.48 | 2d | 10 | 1.06mi |
| 42 S Ludlow St Dayton, OH | 1.0–3.0 | 1.0–2.0 | 860 | $1,068 | $1.24 | 43d | 1 | 1.07mi |
| 100 N Jefferson St Dayton, OH | 1.0–2.0 | 1.0–2.0 | 800 | $1,532 | $1.92 | 3d | 11 | 1.10mi |
| 1101 Phillips Ave Unit 1101 Dayton, OH | 3.0 | 1.5 | 1300 | $1,450 | $1.12 | 43d | 1 | 1.12mi |
| 637 Creighton Ave Dayton, OH | 3.0 | 1.0 | 1144 | $1,350 | $1.18 | 14d | 1 | 1.21mi |
| 140 E Monument Ave Dayton, OH | 3.0 | 1.0–2.0 | 1048 | $2,344 | $2.24 | 2d | 11 | 1.23mi |
| 1410 Phillips Ave Unit 1 Dayton, OH | 2.0 | 1.0 | 1000 | $950 | $0.95 | 43d | 1 | 1.27mi |
| 2012 Saint Charles Ave Dayton, OH | 2.0 | 1.0 | 945 | $1,250 | $1.32 | 43d | 1 | 1.29mi |
| 2600 Wayne Ave Dayton, OH | 4.0 | 1.5 | 1328 | $1,500 | $1.13 | 23d | 1 | 1.29mi |
Listing history 2 events
-
2026-06-19remarks 699-char remark
-
2026-06-19$99,900 Active 1 DOM
ⓘ Source: listings_history table (triggers on properties + properties_extension) + one-shot
backfill from property_details.listing_events for pre-trigger history.
Tax reassessment forecast OH · Partial reset (capped growth)
- Current annual tax
- $2,221 · $185/mo
- Projected year-2 tax
- $2,221 · $185/mo
- Expected delta
- $0/yr ($0/mo · 0.0%)
ⓘ Screening estimate from a state-policy table — verify with the county assessor before closing.
Climate risk First Street
- Flood 4/10 Moderate FEMA zone X (unshaded) · 20% chance over 30 yrs
- Wildfire 1/10 Low
- Heat 4/10 Moderate 7 d/yr ≥101°F today · 18 d/yr by 30 yrs out
- Wind 2/10 Low 0% chance of damaging wind over 30 yrs
- Air quality 3/10 Moderate 3 unhealthy d/yr today · 5 by 30 yrs out
Nearby sold comps map
Loading sold comps map…
Walkable amenities ~0.75 mi
Loading nearby amenities…
Taxation est. · year 1
- Rental income
- $16,945
- − Mortgage interest
- −$5,596
- − Property taxes
- −$2,221
- − Insurance
- −$500
- − Repairs & maintenance
- −$1,356
- − Management
- −$1,356
- − Depreciation
- −$2,906
- Taxable income
- $3,011
- Est. tax owed @ 24.0%
- −$723
- After-tax cash flow
- $3,657/yr
For passive investors: Depreciation is non-cash, so a rental often shows a tax loss while cash-flowing — sheltering income. Rental losses are passive: they offset passive income freely, and up to $25,000/yr can offset ordinary (W-2) income if you actively participate and your MAGI is under $100k (phasing out to $0 by $150k); unused losses carry forward. On sale, claimed depreciation is recaptured at up to 25%, and gains may owe capital-gains tax (a 1031 exchange can defer both). Figures are a year-1 estimate at your 24.0% rate — not tax advice; consult a CPA.
Schools (NCES district)
- District
- Dayton City
- NCES district ID
- 3904384
- Math proficiency
- 12% ▼ -12.00%
- Reading proficiency
- 21% ▼ -11.00%
- Median HH income
- $28,688
- Composite
- 12.94/100
- National rank
- #9579
- State rank
- #641 of 656 in OH
Livability — Dayton
- Score
- 65/100
- State rank
- #716
- US rank
- #12895
Category grades
Schools grade is shown separately in the Schools card above.
Census & demographics
- Census place
- Dayton, OH
- County
- Montgomery County · 459,541 people
- City population
- 164,387
- Metro
- Dayton-Kettering, OH
- Population (ZIP)
- 14,694
- Household income
- $46,651
- Rent vs Own
- Severe rent burden
- 961.0
Population outlook (Montgomery County) Hauer SSP2
- Today (2025)
- 523,241 people
- By 2030
- 514,948 · -1.6%
- By 2040
- 493,378 · -5.7%
- By 2050
- 469,639 · -10.2%
- By 2075
- 418,360 · -20.0%
- By 2100
- 353,315 · -32.5%
Race, ethnicity, and origin ACS 2023
- Neighborhood character
- Predominantly White (71%)
- Race & ethnicity
- White 71% Black 15% Hispanic / Latino 7% Two or more races 6% Asian 1%
- Hispanic origin (detail)
- Mexican 3%
- Common ancestry
- Lithuanian 2% Iranian 2% Slovak 2%
- Foreign-born
- 5% · Canada, United Kingdom
- Languages at home
- 91% English-only · Spanish 6% Tagalog/Filipino 1% Other Asian/Pacific 1%
Political lean MEDSL · Montgomery
- 2024 margin
- Toss-up / Even · D 49.8% · R 49.3%
- 2008→2024 swing
- -5.8pp toward R · 2008: 6.2pp · 2024: 0.5pp
- All cycles
- 2024: D+0.5 2020: D+2.2 2016: R+1.2 2012: D+3.1 2008: D+6.2
Not yet ingested
- Civics
- —
Market trends
- HPI YoY
- ▼ -100.61%
- Current HPI
- 369.3938
- Rent YoY
- ▲ 11.37%
- Metro
- Dayton-Kettering, OH
- State GDP YoY
- ▲ 1.98%
- F500 in state
- 48
Industry mix (Fortune 500 HQ in OH)
| Industry | F500 HQs | Revenue |
|---|---|---|
| Insurance | 3 | $145B |
|
||
| Industrial Machinery | 3 | $49B |
|
||
| Financial Services | 3 | $24B |
|
||
| Consumer Goods | 2 | $93B |
|
||
| Aerospace / Defense | 2 | $47B |
|
||
| Utilities | 2 | $33B |
|
||
Price history
1 event — show timeline
- 2026-06-16 Listed $99,900 Dayton MLS
Property tax history
+1.9%/yrLatest (2025): $2,221 · -0.2% YoY. Source: county tax records.
Cash-flow waterfall
monthlySold comps — $/sqft
last 12 mo · ≤1 miLoading sold comps…