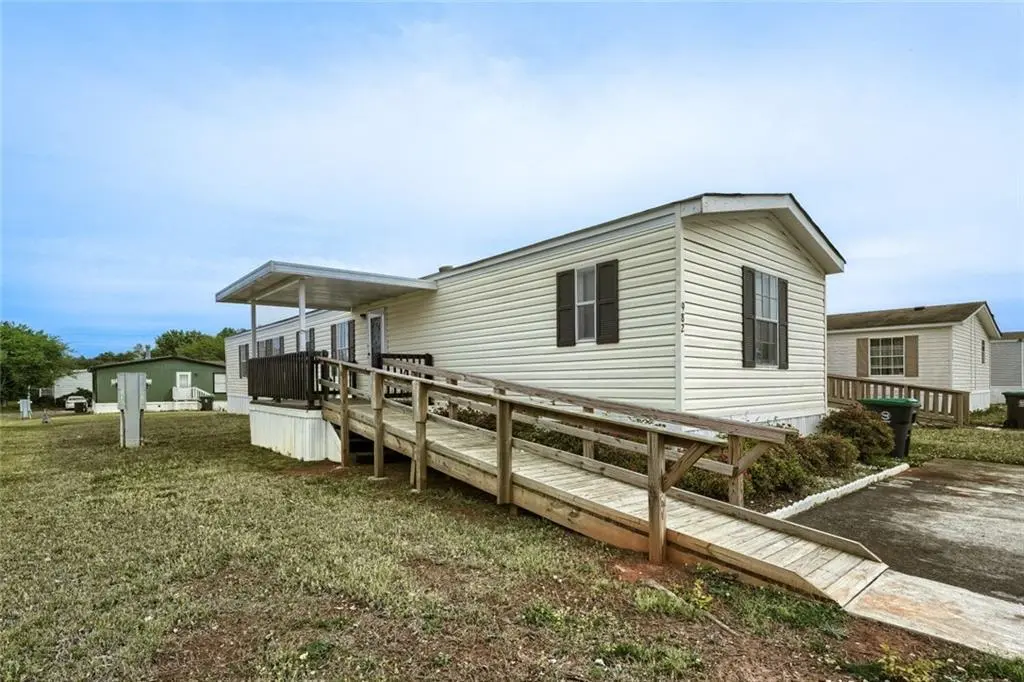
982 Cottonwood Ln · Lovejoy, GA
Flood risk 1/10 · Minimal
- FEMA flood zone
- X (unshaded)
- Chance of flooding over 30 yrs
- 0.0%
- Est. flood insurance / yr
- $507 – $1,088
Fire risk 3/10 · Minor
- Est. fire insurance / yr
- $963 – $1,789
Heat risk 6/10 · Moderate
- Hot days now (above 105°F)
- 7 days/yr
- Hot days in 30 yrs
- 18 days/yr
Wind risk 6/10 · Moderate
- Chance of severe wind over 30 yrs
- 27.0%
Air-quality risk 4/10 · Minor
- Unhealthy air days now
- 4 days/yr
- Unhealthy air days in 30 yrs
- 5 days/yr
Risk factors via First Street. Map © Google.
Why this score? — see what drove the D grade
The composite is a weighted blend of 9 inputs, each scored 0–100. Each bar is that input's sub-score; the figure is the points it added to the 100-point composite (weight × sub-score).
- Cash flow +15.0/30.0
- ARV discount +8.9/15.0
- 1% rule +5.0/10.0
- DSCR +5.0/10.0
- Rent growth +3.1/5.0
- Livability +3.1/5.0
- Condition / age +2.2/5.0
- Schools +1.3/10.0
- Appreciation +0.0/10.0
$43,000
🖨 Deal sheet 📄 Offer letter ✓ Due diligence
Listing remarks
Spacious 4-bed, 2-bath double-wide in the highly desirable La Costa Mobile Home Park! This home boasts family time, with formal living & dining area, eat-in kitchen with bar, and a bonus room perfect for an office, playroom, or guest space. Just minutes from Echo Park & Atlanta Motor Speedway, this home combines comfort, style, and a prime South Atlanta location!
Key facts
- Double-wide
- Dining area
- Bonus room
Tags
Property features AI
Exterior
- Parking: Three total parking spaces
- Utilities: Public water; Public sewer; Cable available; Electricity available; Phone available; Water available; Other electric service
- Home design: Double-wide mobile home; One level
- Construction: Vinyl siding; Shingle roof; Pillar/post/pier foundation
- Exterior features: Lighting; Rain gutters; Covered patio/porch; Deck; Front porch; Shed(s)
Interior
- Kitchen: Breakfast bar; Country-style kitchen; Eat-in kitchen; Kitchen island; Laminate counters; Walk-in pantry; Dishwasher; Microwave; Refrigerator
- Bedrooms: Four main-level bedrooms; Bedroom(s) with other features
- Flooring: Carpet; Laminate
- Bathrooms: Two full bathrooms; Two main-level bathrooms; Master bath with double vanity, separate tub and shower, and soaking tub
- Heating & cooling: Central air conditioning; Electric heating; Other heating type
- Interior features: Sound system; Walk-in closets; Insulated windows; No common walls
- Laundry & utility: Main-level laundry room; Electric dryer hookup; Washer/Dryer connections included (dryer hookup specified)
Neighborhood map
What this means for you Summary
Snapshot
- This is a 4-bed/2.0-bath single-family listed at $43k. Condition is rated fair.
Deal economics
- At list price, monthly cash flow is $1k ($15k/yr) — positive.
- The deal already cash-flows at list — no discount required.
- Meets the 1% rule at list price ($2k rent vs $43k).
- Cap rate 40.9% vs local median 4.4% in Lovejoy — top-decile yield for the area; either an underpriced asset or a hidden risk that comps aren't pricing in. Stress-test before assuming the spread holds.
Location & tenants
- Location reads 62/100 on livability (#317 in GA) — a middle-class / working-renter tenant base. Strengths: cost of living A+, housing A+; Watch: employment C-, schools F, amenities F.
- Clayton County (suburban): math 11% / reading 20% proficiency, ranked #155 of 174 in GA (top 89%) — low school quality limits family demand, transient renter base, plan for 1-2y turnover; 78% free/reduced lunch — lower-income household profile, screen leases tightly.
- Market conditions: Rents rising (+2.2%/yr); 547 active listings in the ZIP; 21 comparable units currently listed for rent nearby; rentals lingering (median 44d on market — plan ~5-8 weeks vacancy on turnover, expect pricing pressure); 52% of comp listings sitting > 30 days — soft ceiling on asking rent; solid renter incomes; 865 units permitted in Clayton County in 2024 (448 in 5+ unit buildings).
Forward outlook
- Local home prices are declining (-3.0%/yr); year-one equity from $297 of loan paydown is wiped out by about $1k of value loss. Plan a longer hold.
- Clayton County population projected at +29% by 2050 — long-run rental-demand tailwind backs the buy-and-hold thesis.
- At projected returns (-3.0% appreciation + 2.2% rent growth), your $12k cash investment doubles in ~1 year — after that, you're playing with house money.
Negotiation context
- Only 1 days on market — expect competitive offers; lowballing is unlikely to land.
Risks & watch-outs
- Climate carrying-cost: major wind risk, 27% chance of damaging wind over 30y; extreme-heat days projected 7→18/yr by 2055 (HVAC capex compounding) — expect insurance premiums to compound above CPI over the hold.
Questions for the listing agent
- Have any recent inspections been done? Can we get a copy of the seller's disclosures and any deferred-maintenance estimates?
- Is there a deadline driving the sale (1031 exchange, divorce, estate, relocation)? That informs how much negotiation room exists.
- Schools are F-rated, which usually means shorter tenancies and higher turnover. Who's the typical renter profile here, and what's been the actual vacancy rate?
- The area grade is low — what's the realistic commute time and amenity access for the typical tenant pool here? Any planned neighborhood developments (good or bad) we should know about?
- What's the average days-on-market for RENTAL listings here right now (not sales)? A rising rental-DOM trend means longer vacancies and softer asking-rent achievability than the comps imply.
- What's the recent tenant-quality profile in this submarket — average credit score on applications, eviction rate, late-payment / NSF rate, and stable-employment percentage? A property-management company in the area should have these aggregated.
- How much new for-sale + rental construction is in the pipeline within 1–3 miles? Heavy new supply typically softens prices + rents 12–24 months out; constrained supply supports both.
Investment metrics
- 1% rule
- 4.53% ✓
- Cap rate
- 40.92%
- Cash-on-cash
- 123.66%
- DSCR
- 6.50
- GRM
- 1.8
CMA / ARV
- ARV (on-the-fly)
- $44,394
- Comps found
- 1
Show comp detail 1 sale within ~0.75 mi
| Address | Dist | Beds/Ba | Sqft | Sold | Price | $/sf | Match |
|---|---|---|---|---|---|---|---|
| 100 Lake Haven Dr | 0.34mi | 3/2.0 (-1) | 975 (-8%) | 2mo | $41,250 | $42 | 65 |
Match score weights: distance 35% · size 25% · config 20% · recency 20%. Top-matched comps best support the ARV.
Projected returns pro-forma
-3.0% appreciation · 2.2% rent growth · sell at horizon
- IRR
- —
- Equity multiple
- 6.86×
- Total profit
- $70,529
- Equity at exit
- $6,411
- IRR
- —
- Equity multiple
- 14.04×
- Total profit
- $157,011
- Equity at exit
- $3,718
Cash invested: $12,040 (down + closing). Projections, not guarantees.
Landlord ↔ Tenant lean methodology
- Overall (STATE)
- 90 Strongly Landlord-Friendly
- State Georgia
- 90 Strongly Landlord-Friendly · R+3
- County
- — inherits STATE
- City
- — inherits STATE
ZIP-level market 30228
- Home prices YoY
- -24.3%
- Rents YoY
- 2.2%
- Active inventory
- 547
- Price-to-rent
- 1.8×
Monthly cashflow live
- Estimated rent
- $1,947 high interval (Pro) →
- Mortgage (P&I)
- −$225
- Tax est. 1.5%
- −$54 /mo · $645/yr
- Insurance
- −$18
- HOA
- −$0
- Vacancy / Maint / Mgmt
- −$409
- Net cashflow
- $1,241
Break-even live
UW: 25.0% down · 7.5% · 30yr · 1.5% tax · 5.0% vac · 8.0% maint · 8.0% mgmt
Financing live
Cash to close
- Down payment
- $10,750
- Closing costs
- $1,290
- Reserves months
- —
- Total cash needed
- —
Loan-product check · same deal, 3 products live
Conventional
25% down · 7.5% · 30yr
- Down + closing
- —
- Monthly P&I
- —
- Monthly cashflow
- —
- DSCR
- —
- Eligible?
- —
Personal DTI + credit; lowest rate.
DSCR
20% down · 8.5% · 30yr
- Down + closing
- —
- Monthly P&I
- —
- Monthly cashflow
- —
- DSCR
- —
- Eligible?
- —
No personal income docs; deal must DSCR.
Hard money
10% down · 12.0% · 12mo
- Down + closing
- —
- Monthly P&I
- —
- Monthly cashflow
- —
- DSCR
- —
- Eligible?
- —
Short-term bridge; refi at stabilization.
Rent comps 21 comps
| Address | Beds | Baths | Sqft | Rent | $/sqft | DOM | Units | Dist |
|---|---|---|---|---|---|---|---|---|
| 2251 Nicole Dr #119 Hampton, GA | 3.0 | 2.5 | 1324 | $1,700 | $1.28 | 24d | 1 | 0.33mi |
| 11352 Michelle Way Lovejoy, GA | 3.0 | 2.5 | 1440 | $1,485 | $1.03 | 12d | 1 | 0.42mi |
| 2306 Nicole Dr Lovejoy, GA | 3.0 | 2.5 | 1324 | $1,800 | $1.36 | 43d | 1 | 0.44mi |
| 2411 Brianna Dr Lovejoy, GA | 3.0 | 2.0 | 1432 | $1,826 | $1.28 | 2d | 1 | 0.49mi |
| 2361 Brianna Dr Lovejoy, GA | 3.0 | 2.5 | 1384 | $1,525 | $1.10 | 22d | 1 | 0.52mi |
| 2367 Brianna Dr Lovejoy, GA | 3.0 | 2.5 | 1440 | $1,695 | $1.18 | 43d | 1 | 0.52mi |
| 11866 Registry Blvd Unit 1 Hampton, GA | 3.0 | 2.0 | 1488 | $1,650 | $1.11 | 24d | 1 | 0.93mi |
| 1992 Lovejoy Rd Lovejoy, GA | 1.0–3.0 | 1.0–2.0 | 1085 | $1,902 | $1.75 | 1d | 25 | 0.95mi |
| 2056 Registry Pl Lovejoy, GA | 3.0 | 2.0 | 1488 | $1,825 | $1.23 | 43d | 1 | 0.96mi |
| 11015 Tara Blvd Lovejoy, GA | 1.0–3.0 | 1.0–2.0 | 1113 | $1,815 | $1.63 | 43d | 1 | 1.02mi |
| 10911 Tara Blvd Lovejoy, GA | 1.0–3.0 | 1.0–2.0 | 1150 | $1,795 | $1.56 | 43d | 1 | 1.05mi |
| 11942 Fuller St Lovejoy, GA | 3.0 | 2.5 | 1421 | $1,639 | $1.15 | 43d | 1 | 1.15mi |
| 11940 Fuller St Lovejoy, GA | 3.0 | 2.5 | 1421 | $1,699 | $1.20 | 43d | 1 | 1.16mi |
| 1781 Fielding Way Lovejoy, GA | 3.0 | 2.5 | 1370 | $1,545 | $1.13 | 43d | 1 | 1.23mi |
| 30 Winston Way Hampton, GA | 3.0 | 2.0 | 924 | $1,400 | $1.52 | 43d | 1 | 1.24mi |
| 11035 Shannon Cir Hampton, GA | 3.0 | 2.0 | 1320 | $1,606 | $1.22 | 12d | 1 | 1.24mi |
| 11877 Fuller St Lovejoy, GA | 3.0 | 2.5 | 1386 | $1,609 | $1.16 | 24d | 1 | 1.26mi |
| 12227 Tara Blvd Lovejoy, GA | 1.0–3.0 | 1.0–2.0 | 1179 | $1,913 | $1.62 | 1d | 13 | 1.42mi |
| 10903 Thrasher Rd Hampton, GA | 3.0 | 2.0 | 1412 | $1,725 | $1.22 | 22d | 1 | 1.44mi |
| 1652 Thorn Ridge Trl Hampton, GA | 3.0 | 2.0 | 1360 | $1,960 | $1.44 | 43d | 1 | 1.48mi |
| 1591 Elizabeth Ln Hampton, GA | 3.0 | 2.0 | 1352 | $1,591 | $1.18 | 43d | 1 | 1.49mi |
Listing history 3 events
-
2026-06-13status $43,000 Pending 1 DOM
-
2026-06-10remarks 369-char remark
-
2026-06-10$43,000 Active 1 DOM
ⓘ Source: listings_history table (triggers on properties + properties_extension) + one-shot
backfill from property_details.listing_events for pre-trigger history.
Climate risk First Street
- Flood 1/10 Low FEMA zone X (unshaded) · 0% chance over 30 yrs
- Wildfire 3/10 Moderate
- Heat 6/10 Major 7 d/yr ≥105°F today · 18 d/yr by 30 yrs out
- Wind 6/10 Major 27% chance of damaging wind over 30 yrs
- Air quality 4/10 Moderate 4 unhealthy d/yr today · 5 by 30 yrs out
Nearby sold comps map
Loading sold comps map…
Walkable amenities ~0.75 mi
Loading nearby amenities…
Taxation est. · year 1
- Rental income
- $23,360
- − Mortgage interest
- −$2,409
- − Property taxes
- −$645
- − Insurance
- −$215
- − Repairs & maintenance
- −$1,869
- − Management
- −$1,869
- − Depreciation
- −$1,251
- Taxable income
- $15,103
- Est. tax owed @ 24.0%
- −$3,625
- After-tax cash flow
- $11,264/yr
For passive investors: Depreciation is non-cash, so a rental often shows a tax loss while cash-flowing — sheltering income. Rental losses are passive: they offset passive income freely, and up to $25,000/yr can offset ordinary (W-2) income if you actively participate and your MAGI is under $100k (phasing out to $0 by $150k); unused losses carry forward. On sale, claimed depreciation is recaptured at up to 25%, and gains may owe capital-gains tax (a 1031 exchange can defer both). Figures are a year-1 estimate at your 24.0% rate — not tax advice; consult a CPA.
Condition & rehab AI · 6 photos
This double-wide mobile home in La Costa Mobile Home Park requires moderate repairs to its exterior and railings, but presents a good opportunity for updates that could significantly increase its resale and rental value.
Repairs flagged
- Major exterior siding — Significant weathering
- Major railings — Visible rust
Value-add opportunities
- Both paint exterior — Enhances curb appeal and value
- Both repair railings — Improves safety and aesthetics
- Both update flooring — Fresh carpet or tile would modernize and increase value
Renovation cost estimate screening
| Repair item | Severity | Est. cost |
|---|---|---|
| exterior siding · Significant weathering | Major | $15,000–50,000 |
| railings · Visible rust | Major | $15,000–50,000 |
| Total estimated repair cost · 2 items | $30,000–100,000 |
Value-add ROI direction
- Both paint exterior — Enhances curb appeal and value ↑
- Both repair railings — Improves safety and aesthetics ↑
- Both update flooring — Fresh carpet or tile would modernize and increase value ↑
ⓘ Cost ranges are severity-bucket heuristics (US national rule-of-thumb). Get contractor quotes + a written scope before underwriting a rehab budget.
Schools (NCES district)
- District
- Clayton County
- NCES district ID
- 1301230
- Math proficiency
- 11% ▼ -13.00%
- Reading proficiency
- 20% ▼ -9.00%
- Median HH income
- $42,266
- Composite
- 13.41/100
- National rank
- #9527
- State rank
- #155 of 174 in GA
Livability — Lovejoy
- Score
- 62/100
- State rank
- #317
- US rank
- #17071
Category grades
Schools grade is shown separately in the Schools card above.
Census & demographics
- Census place
- Lovejoy, GA
- County
- Henry County · 316,359 people
- City population
- 606
- Metro
- Atlanta-Sandy Springs-Alpharetta, GA
- Population (ZIP)
- 52,402
- Household income
- $82,619
- Rent vs Own
- Severe rent burden
- 1285.0
Population outlook (Clayton County) Hauer SSP2
- Today (2025)
- 310,777 people
- By 2030
- 329,762 · +6.1%
- By 2040
- 368,052 · +18.4%
- By 2050
- 401,196 · +29.1%
- By 2075
- 472,488 · +52.0%
- By 2100
- 500,446 · +61.0%
Race, ethnicity, and origin ACS 2023
- Neighborhood character
- Majority Black (63%)
- Race & ethnicity
- Black 63% White 23% Hispanic / Latino 8% Two or more races 6% Asian 2%
- Hispanic origin (detail)
- Mexican 5% Puerto Rican 1%
- Common ancestry
- Hispanic 4% Lithuanian 1% Italian 1%
- Foreign-born
- 9% · Canada, Vietnam, Jamaica
- Languages at home
- 89% English-only · Spanish 6% French/Haitian/Cajun 2% Vietnamese 1%
Political lean MEDSL · Clayton
- 2024 margin
- Solid D (+69.2) · D 84.3% · R 15.1%
- 2008→2024 swing
- +2.8pp toward D · 2008: 66.4pp · 2024: 69.2pp
- All cycles
- 2024: D+69.2 2020: D+70.9 2016: D+71.9 2012: D+70.1 2008: D+66.4
Not yet ingested
- Civics
- —
Market trends
- HPI YoY
- ▼ -71.11%
- Current HPI
- 222.0357
- Rent YoY
- ▲ 2.20%
- Metro
- Atlanta-Sandy Springs-Alpharetta, GA
- State GDP YoY
- ▲ 2.66%
- F500 in state
- 28
Industry mix (Fortune 500 HQ in GA)
| Industry | F500 HQs | Revenue |
|---|---|---|
| Paper / Packaging | 2 | $29B |
|
||
| Retail | 1 | $160B |
|
||
| Transportation / Logistics | 1 | $91B |
|
||
| Airlines | 1 | $62B |
|
||
| Consumer Goods | 1 | $47B |
|
||
| Utilities | 1 | $25B |
|
||
Price history
1 event — show timeline
- 2026-06-01 Listed $43,000 FMLS
Cash-flow waterfall
monthlySold comps — $/sqft
last 12 mo · ≤1 miLoading sold comps…