1110 E Justin St · Sunsites, AZ
Flood risk 1/10 · Minimal
- FEMA flood zone
- X (unshaded)
- Chance of flooding over 30 yrs
- 0.0%
- Est. flood insurance / yr
- $507 – $1,088
Fire risk 7/10 · Major
- Est. fire insurance / yr
- $610 – $1,132
Heat risk 6/10 · Moderate
- Hot days now (above 98°F)
- 7 days/yr
- Hot days in 30 yrs
- 19 days/yr
Wind risk 1/10 · Minimal
- Chance of severe wind over 30 yrs
- —
Air-quality risk 1/10 · Minimal
- Unhealthy air days now
- 0 days/yr
- Unhealthy air days in 30 yrs
- 0 days/yr
Risk factors via First Street. Map © Google.
Why this score? — see what drove the C+ grade
The composite is a weighted blend of 9 inputs, each scored 0–100. Each bar is that input's sub-score; the figure is the points it added to the 100-point composite (weight × sub-score).
- Cash flow +30.0/30.0
- DSCR +10.0/10.0
- 1% rule +9.1/10.0
- ARV discount +7.5/15.0
- Rent growth +2.5/5.0
- Livability +2.5/5.0
- Condition / age +2.5/5.0
- Schools +0.2/10.0
- Appreciation +0.0/10.0
$99,000
🖨 Deal sheet 📄 Offer letter ✓ Due diligence
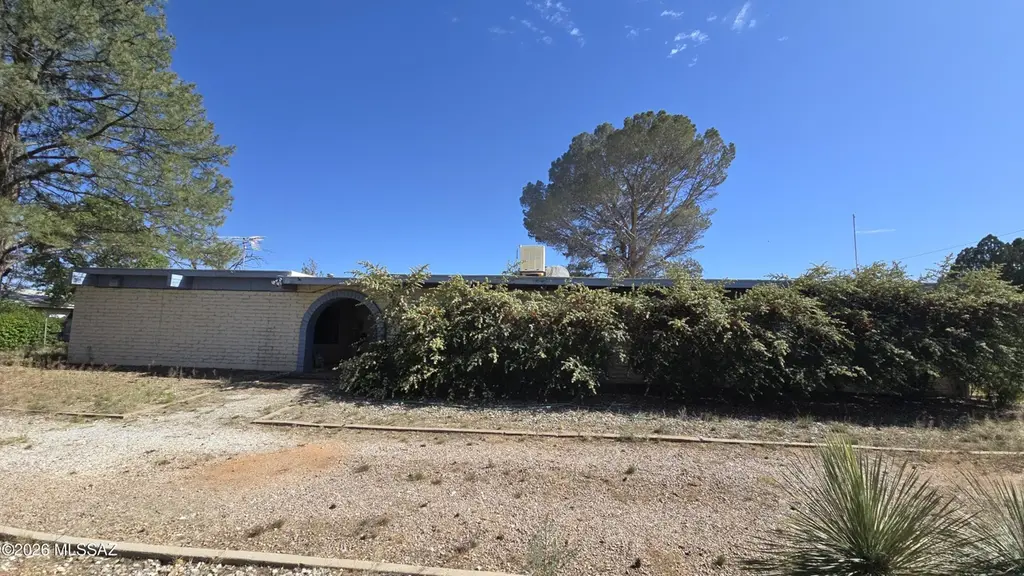
Listing remarks
This fixer-upper in Sunsites, Arizona offers 2,293 square feet of potential on a generous . 86-acre lot, plus a large detached garage with alley access. The home needs a lot of work and cosmetic updates throughout, and it's not charming in its current condition, but it presents a rare chance for the right buyer to design and renovate from the ground up. The quiet neighborhood provides a tranquil desert setting with plenty of outdoor space for projects, gardens, or future additions, and the sizable lot offers room to spread out and pursue ideas. Investors or buyer-owners who are prepared to roll up their sleeves can transform this property into a personalized oasis. Sold as-is , Seller will
Key facts
- Alley access
- Generous lot
- Outdoor space
Tags
Property features AI
Finance
- Other: Zoned Cochise - SR-12
- HOA & community: Paved street (community feature)
Exterior
- Parking: Detached garage; 1 garage space; 1 covered parking space; Circular driveway
- Utilities: Water from local water company; Septic tank sewer; Phone service connected
- Home design: Single family residence; One story
- Construction: Slump block construction; Rolled/Hot Mop roof
- Exterior features: Chain link fence; Paved street access
Interior
- Kitchen: Dishwasher; Electric oven
- Flooring: Carpet
- Bathrooms: 2 full bathrooms
- Heating & cooling: Natural gas heating; Evaporative cooling
- Interior features: Fixer condition; Shrubs on lot; Adjacent to alley; North/South exposure
- Laundry & utility: Dedicated laundry room
Neighborhood map
What this means for you Summary
Snapshot
- This is a 4-bed/2.0-bath single-family listed at $99k.
Deal economics
- At list price, monthly cash flow is $419 ($5k/yr) — positive.
- The deal already cash-flows at list — no discount required.
- Meets the 1% rule at list price ($1k rent vs $99k).
- Recommended offer: $93k (6.0% below list) — sets the bar for market timing.
- Cap rate 11.4% vs local median 4.3% in Sunsites — top-decile yield for the area; either an underpriced asset or a hidden risk that comps aren't pricing in. Stress-test before assuming the spread holds.
Location & tenants
- Location reads: area grade C — affects rentability + tenant quality, not the cash-flow math above.
- Valley Union High School District (4190) (rural): math -3% / reading -3% proficiency, ranked #498 of 501 in AZ (top 99%) — low school quality limits family demand, transient renter base, plan for 1-2y turnover.
- Zoned schools: Valley Union High School (math 5% / reading 5%, grade F, #364 of 381 statewide, top 100%, 106 students, 49% FRL).
- Market conditions: 198 active listings in the ZIP; 1 comparable units currently listed for rent nearby; 437 units permitted in Cochise County in 2024 (6 in 5+ unit buildings).
Forward outlook
- Local home prices are declining (-3.0%/yr); year-one equity from $684 of loan paydown is wiped out by about $3k of value loss. Plan a longer hold.
- Cochise County population projected at -30% by 2050 — secular population decline; favor cash flow + early exit over multi-decade hold.
- At projected returns (-3.0% appreciation + 3.0% rent growth), your $28k cash investment doubles in ~7 years — after that, you're playing with house money.
Negotiation context
- It's been on market 61 days — a 6% lower offer ($93k) is reasonable based on typical stale-listing flexibility.
- Current owner paid $80k; 24% above their basis — modest negotiation headroom, anchor on the comps not their cost.
Risks & watch-outs
- Climate carrying-cost: major wildfire risk; extreme-heat days projected 7→19/yr by 2055 (HVAC capex compounding) — expect insurance premiums to compound above CPI over the hold.
Questions for the listing agent
- It's been on market 61 days. Have you received any prior offers? Is the seller open to a 6% concession, seller financing, or rate buy-down credit?
- Built in 1964 — when were the roof, HVAC, electrical panel, plumbing, and water heater last replaced?
- Why hasn't it sold? Are there any deal-killer items the seller is aware of (foundation, flood, title, zoning, code violations)?
- Is there a deadline driving the sale (1031 exchange, divorce, estate, relocation)? That informs how much negotiation room exists.
- What's the average days-on-market for RENTAL listings here right now (not sales)? A rising rental-DOM trend means longer vacancies and softer asking-rent achievability than the comps imply.
- What's the recent tenant-quality profile in this submarket — average credit score on applications, eviction rate, late-payment / NSF rate, and stable-employment percentage? A property-management company in the area should have these aggregated.
- How much new for-sale + rental construction is in the pipeline within 1–3 miles? Heavy new supply typically softens prices + rents 12–24 months out; constrained supply supports both.
Investment metrics
- 1% rule
- 1.41% ✓
- Cap rate
- 11.38%
- Cash-on-cash
- 18.15%
- DSCR
- 1.81
- GRM
- 5.9
CMA / ARV
- ARV (on-the-fly)
- $203,962
- Comps found
- 12
Show comp detail 12 sales within ~0.75 mi
| Address | Dist | Beds/Ba | Sqft | Sold | Price | $/sf | Match |
|---|---|---|---|---|---|---|---|
| 306 N Sage St | 0.28mi | 3/2.0 (-1) | 1,670 (+4%) | 2mo | $232,000 | $139 | 74 |
| 1213 E Justin St | 0.24mi | 3/2.0 (-1) | 1,589 (-1%) | 12mo | $190,000 | $120 | 72 |
| 211 N Ford St | 0.25mi | 3/2.0 (-1) | 1,580 (-2%) | 16mo | $192,000 | $122 | 67 |
| 1021 E Geneva St | 0.40mi | 3/2.0 (-1) | 1,546 (-4%) | 4mo | $230,000 | $149 | 67 |
| 217 N Ford St | 0.27mi | 3/2.0 (-1) | 1,446 (-10%) | 1mo | $165,000 | $114 | 65 |
| 1010 E Mescal Dr | 0.27mi | 3/2.0 (-1) | 1,466 (-9%) | 14mo | $178,000 | $121 | 56 |
| 1002 E Geneva St | 0.54mi | 3/2.0 (-1) | 1,761 (+10%) | 3mo | $245,000 | $139 | 52 |
| 1032 E Geneva St | 0.32mi | 3/2.0 (-1) | 1,776 (+11%) | 14mo | $252,000 | $142 | 51 |
| 985 E Geneva St | 0.61mi | 3/2.0 (-1) | 1,675 (+4%) | 17mo | $235,000 | $140 | 46 |
| 327 N Ford St | 0.48mi | 3/2.0 (-1) | 1,438 (-10%) | 13mo | $85,000 | $59 | 44 |
| 316 N Sage St | 0.35mi | 3/3.0 (-1) | 1,762 (+10%) | 18mo | $170,000 | $96 | 43 |
| 322 N Flynn Jans Ct | 0.42mi | 3/2.0 (-1) | 1,372 (-15%) | 10mo | $174,000 | $127 | 43 |
Match score weights: distance 35% · size 25% · config 20% · recency 20%. Top-matched comps best support the ARV.
Projected returns pro-forma
-3.0% appreciation · 3.0% rent growth · sell at horizon
- IRR
- 9.8%
- Equity multiple
- 1.39×
- Total profit
- $10,685
- Equity at exit
- $14,761
- IRR
- 18.9%
- Equity multiple
- 2.58×
- Total profit
- $43,784
- Equity at exit
- $8,560
Cash invested: $27,720 (down + closing). Projections, not guarantees.
Landlord ↔ Tenant lean methodology
- Overall (STATE)
- 87 Strongly Landlord-Friendly
- State Arizona
- 87 Strongly Landlord-Friendly · R+3
- County
- — inherits STATE
- City
- — inherits STATE
ZIP-level market 85625
- Home prices YoY
- -16.5%
- Active inventory
- 198
- Price-to-rent
- 5.9×
Monthly cashflow live
- Estimated rent
- $1,400 medium interval (Pro) →
- Mortgage (P&I)
- −$519
- Tax from tax record
- −$126 /mo · $1,515/yr
- Insurance
- −$41
- HOA
- −$0
- Vacancy / Maint / Mgmt
- −$294
- Net cashflow
- $419
Break-even live
UW: 25.0% down · 7.5% · 30yr · 1.5% tax · 5.0% vac · 8.0% maint · 8.0% mgmt
Financing live
Cash to close
- Down payment
- $24,750
- Closing costs
- $2,970
- Reserves months
- —
- Total cash needed
- —
Loan-product check · same deal, 3 products live
Conventional
25% down · 7.5% · 30yr
- Down + closing
- —
- Monthly P&I
- —
- Monthly cashflow
- —
- DSCR
- —
- Eligible?
- —
Personal DTI + credit; lowest rate.
DSCR
20% down · 8.5% · 30yr
- Down + closing
- —
- Monthly P&I
- —
- Monthly cashflow
- —
- DSCR
- —
- Eligible?
- —
No personal income docs; deal must DSCR.
Hard money
10% down · 12.0% · 12mo
- Down + closing
- —
- Monthly P&I
- —
- Monthly cashflow
- —
- DSCR
- —
- Eligible?
- —
Short-term bridge; refi at stabilization.
Rent comps 1 comps
| Address | Beds | Baths | Sqft | Rent | $/sqft | DOM | Units | Dist |
|---|---|---|---|---|---|---|---|---|
| 904 E Christmas Tree Ln Pearce, AZ | 3.0 | 2.5 | 1796 | $1,400 | $0.78 | 24d | 1 | 0.49mi |
Listing history 20 events
-
2026-06-19days on market $99,000 Active 61 DOM
-
2026-06-18days on market $99,000 Active 60 DOM
-
2026-06-17days on market $99,000 Active 59 DOM
-
2026-06-16days on market $99,000 Active 58 DOM
-
2026-06-15days on market $99,000 Active 57 DOM
-
2026-06-14days on market $99,000 Active 55 DOM
-
2026-06-12days on market $99,000 Active 54 DOM
-
2026-06-09days on market $99,000 Active 51 DOM
-
2026-06-08days on market $99,000 Active 50 DOM
-
2026-06-07days on market $99,000 Active 49 DOM
-
2026-06-05days on market $99,000 Active 47 DOM
-
2026-06-04pricestatusdays on market $99,000 Active 45 DOM
-
2026-06-02days on market $110,000 Active Contingent 44 DOM
-
2026-06-01days on market $110,000 Active Contingent 43 DOM
-
2026-05-31days on market $110,000 Active Contingent 42 DOM
-
2026-05-31days on market $110,000 Active Contingent 41 DOM
-
2026-05-15price $110,000
-
2026-04-19$134,000 Active
-
1996-02-12soldstatus $79,900
-
1994-03-31soldstatus $72,000
ⓘ Source: listings_history table (triggers on properties + properties_extension) + one-shot
backfill from property_details.listing_events for pre-trigger history.
Tax reassessment forecast AZ · Resets to sale price
- Current annual tax
- $1,515 · $126/mo
- Projected year-2 tax
- $1,515 · $126/mo
- Expected delta
- $0/yr ($0/mo · 0.0%)
ⓘ Screening estimate from a state-policy table — verify with the county assessor before closing.
Climate risk First Street
- Flood 1/10 Low FEMA zone X (unshaded) · 0% chance over 30 yrs
- Wildfire 7/10 Severe
- Heat 6/10 Major 7 d/yr ≥98°F today · 19 d/yr by 30 yrs out
- Wind 1/10 Low
- Air quality 1/10 Low 0 unhealthy d/yr today · 0 by 30 yrs out
Nearby sold comps map
Loading sold comps map…
Walkable amenities ~0.75 mi
Loading nearby amenities…
Taxation est. · year 1
- Rental income
- $16,800
- − Mortgage interest
- −$5,546
- − Property taxes
- −$1,515
- − Insurance
- −$495
- − Repairs & maintenance
- −$1,344
- − Management
- −$1,344
- − Depreciation
- −$2,880
- Taxable income
- $3,676
- Est. tax owed @ 24.0%
- −$882
- After-tax cash flow
- $4,149/yr
For passive investors: Depreciation is non-cash, so a rental often shows a tax loss while cash-flowing — sheltering income. Rental losses are passive: they offset passive income freely, and up to $25,000/yr can offset ordinary (W-2) income if you actively participate and your MAGI is under $100k (phasing out to $0 by $150k); unused losses carry forward. On sale, claimed depreciation is recaptured at up to 25%, and gains may owe capital-gains tax (a 1031 exchange can defer both). Figures are a year-1 estimate at your 24.0% rate — not tax advice; consult a CPA.
Schools (NCES district)
- District
- Valley Union High School District (4190)
- NCES district ID
- 0408910
- Math proficiency
- -3% ▬ 0.00%
- Reading proficiency
- -3% ▬ 0.00%
- Median HH income
- $41,046
- Composite
- 2.17/100
- National rank
- #15168
- State rank
- #498 of 501 in AZ
Livability — Sunsites
No livability data for this city. (Only ~50 U.S. cities are tracked.)
Census & demographics
- Census place
- Sunsites, AZ
- Population (ZIP)
- 1,959
Population outlook (Cochise County) Hauer SSP2
- Today (2025)
- 113,402 people
- By 2030
- 106,197 · -6.4%
- By 2040
- 92,166 · -18.7%
- By 2050
- 79,805 · -29.6%
- By 2075
- 56,831 · -49.9%
- By 2100
- 35,103 · -69.0%
Race, ethnicity, and origin ACS 2023
- Neighborhood character
- Predominantly White (89%)
- Race & ethnicity
- White 89% Hispanic / Latino 10% Two or more races 8%
- Hispanic origin (detail)
- Mexican 10%
- Common ancestry
- Lithuanian 5% Iranian 2% Portuguese 2%
- Foreign-born
- 4% · Canada
- Languages at home
- 87% English-only · Spanish 10% German/W. Germanic 3%
Political lean MEDSL · Cochise
- 2024 margin
- Strong R (+23.1) · D 37.8% · R 61.0% · Other 1.2%
- 2008→2024 swing
- -2.5pp toward R · 2008: -20.7pp · 2024: -23.1pp
- All cycles
- 2024: R+23.1 2020: R+19.6 2016: R+22.6 2012: R+24.0 2008: R+20.7
Not yet ingested
- Civics
- —
Market trends
- HPI YoY
- ▼ -30.79%
- Current HPI
- 156.1483
- Rent YoY
- —
- Metro
- —
- State GDP YoY
- ▲ 4.54%
- F500 in state
- 20
Industry mix (Fortune 500 HQ in AZ)
| Industry | F500 HQs | Revenue |
|---|---|---|
| Technology | 2 | $13B |
|
||
| Mining / Metals | 1 | $23B |
|
||
| Environmental Services | 1 | $16B |
|
||
| Metals / Steel | 1 | $14B |
|
||
| Technology Distribution | 1 | $9B |
|
||
| Homebuilding | 1 | $8B |
|
||
Price history
+52.8% since first listed4 events — show timeline
- 2026-05-15 Price Changed $110,000 MLSSAZ
- 2026-04-19 Listed $134,000 MLSSAZ
- 1996-02-12 Sold (Public Records) $79,900 Public Records
- 1994-03-31 Sold (Public Records) $72,000 Public Records
Property tax history
+2.1%/yrLatest (2025): $1,515 · +3.0% YoY. Source: county tax records.
Cash-flow waterfall
monthlySold comps — $/sqft
last 12 mo · ≤1 miLoading sold comps…