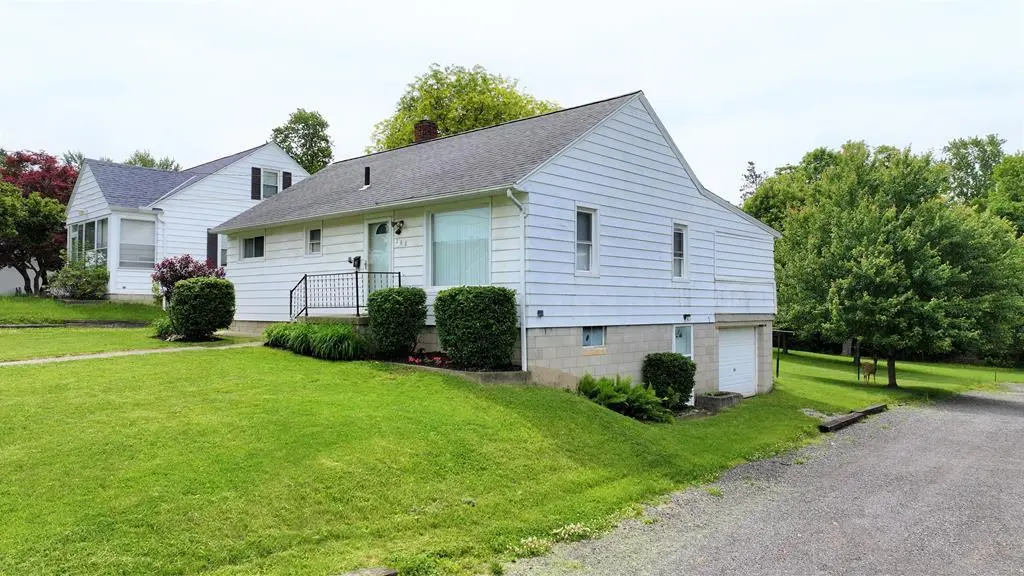
268 Reform St · Mansfield, OH
Flood risk 1/10 · Minimal
- FEMA flood zone
- X (unshaded)
- Chance of flooding over 30 yrs
- 0.0%
- Est. flood insurance / yr
- $473 – $860
Fire risk 1/10 · Minimal
- Est. fire insurance / yr
- $713 – $1,323
Heat risk 3/10 · Minor
- Hot days now (above 96°F)
- 7 days/yr
- Hot days in 30 yrs
- 17 days/yr
Wind risk 2/10 · Minimal
- Chance of severe wind over 30 yrs
- 0.0%
Air-quality risk 2/10 · Minimal
- Unhealthy air days now
- 1 days/yr
- Unhealthy air days in 30 yrs
- 1 days/yr
Risk factors via First Street. Map © Google.
Why this score? — see what drove the D grade
The composite is a weighted blend of 9 inputs, each scored 0–100. Each bar is that input's sub-score; the figure is the points it added to the 100-point composite (weight × sub-score).
- Cash flow +14.5/30.0
- Appreciation +9.2/10.0
- DSCR +4.4/10.0
- Livability +3.8/5.0
- 1% rule +3.1/10.0
- Rent growth +2.5/5.0
- Condition / age +2.5/5.0
- Schools +2.3/10.0
- ARV discount +1.7/15.0
$126,900
🖨 Deal sheet 📄 Offer letter ✓ Due diligence
Listing remarks
Welcome home to this charming 3-bedroom, 1-bath ranch full of warmth and potential! Featuring a comfortable layout, inviting living spaces, and solid construction, this home offers the perfect opportunity to add your own style and touches over time. The cozy feel and quaint character make it easy to picture yourself settling right in. Whether you're looking for your first home, downsizing, or searching for an investment opportunity, this property is full of possibilities and ready for its next chapter!
Key facts
- Garage
- Built 1953
- Listed 17 days
Property features AI
Exterior
- Parking: 1-car garage; Concrete and gravel parking
- Utilities: Public water; Public sewer
- Home design: Single-family residence; One story
- Construction: Aluminum siding; Composition roof
- Exterior features: Rolling slope lot
Interior
- Kitchen: Dishwasher; Microwave; Oven/Range; Refrigerator
- Bathrooms: 1 full bathroom
- Heating & cooling: Central air conditioning; Forced air heating; Baseboard heating; Natural gas heating
- Interior features: Dehumidifier; Full walk-out basement
- Laundry & utility: Washer; Dryer; Gas water heater; Laundry in basement
Neighborhood map
What this means for you Summary
Snapshot
- This is a 3-bed/1.0-bath single-family listed at $127k.
Deal economics
- At list price, monthly cash flow is $27 ($329/yr) — positive.
- The deal already cash-flows at list — no discount required.
- To meet the 1% rule (rent ≥ 1% of price), the offer needs to be $103k (19.1% below list).
- Recommended offer: $103k (19.1% below list) — sets the bar for 1% rule.
- Cap rate 6.6% vs local median 4.2% in Mansfield — top-decile yield for the area; either an underpriced asset or a hidden risk that comps aren't pricing in. Stress-test before assuming the spread holds.
Location & tenants
- Location reads 76/100 on livability (#224 in OH, #3,525 nationally) — a middle-class / working-renter tenant base. Strengths: commute A+, cost of living A+, housing A+; Watch: schools C-, crime D-, amenities D-.
- Mansfield City (urban): math 24% / reading 33% proficiency, ranked #590 of 656 in OH (top 90%) — low school quality limits family demand, transient renter base, plan for 1-2y turnover; 80% free/reduced lunch — lower-income household profile, screen leases tightly.
- Market conditions: 30 active listings in the ZIP; 5 comparable units currently listed for rent nearby; rentals lingering (median 44d on market — plan ~5-8 weeks vacancy on turnover, expect pricing pressure); 100% of comp listings sitting > 30 days — soft ceiling on asking rent; lower-income renter base — watch delinquency; 145 units permitted in Richland County in 2024 (0 in 5+ unit buildings).
- This rent runs 39% of the median local income ($32k/yr) — at the standard rent-burdened threshold; future hikes will face affordability resistance.
Forward outlook
- In year one you build about $12k of equity ($877 loan paydown + $11k appreciation (8.4% local appreciation)).
- Richland County population projected at -18% by 2050 — secular population decline; favor cash flow + early exit over multi-decade hold.
- At projected returns (8.4% appreciation + 3.0% rent growth), your $36k cash investment doubles in ~3 years — after that, you're playing with house money.
- By year 4, paydown + projected appreciation supports a ~$40k cash-out refi (75% LTV) — recoverable capital for the next deal without selling this one.
Negotiation context
- It's been on market 18 days — a 2% lower offer ($125k) is reasonable based on typical stale-listing flexibility.
- Current owner paid $66k; list at $127k implies a 91% gain — meaningful room to come down on a strong offer.
Risks & watch-outs
- Watch-outs: built in 1953 — expect roof / HVAC / electrical / plumbing capex.
Questions for the listing agent
- Built in 1953 — when were the roof, HVAC, electrical panel, plumbing, and water heater last replaced?
- Is there a deadline driving the sale (1031 exchange, divorce, estate, relocation)? That informs how much negotiation room exists.
- Crime grade is D in this area — have there been break-ins, vandalism, or insurance claims at this property in the last 3 years? What carrier currently insures it and at what premium?
- The area grade is low — what's the realistic commute time and amenity access for the typical tenant pool here? Any planned neighborhood developments (good or bad) we should know about?
- What's the average days-on-market for RENTAL listings here right now (not sales)? A rising rental-DOM trend means longer vacancies and softer asking-rent achievability than the comps imply.
- What's the recent tenant-quality profile in this submarket — average credit score on applications, eviction rate, late-payment / NSF rate, and stable-employment percentage? A property-management company in the area should have these aggregated.
- How much new for-sale + rental construction is in the pipeline within 1–3 miles? Heavy new supply typically softens prices + rents 12–24 months out; constrained supply supports both.
Investment metrics
- 1% rule
- 0.81% ✗
- Cap rate
- 6.55%
- Cash-on-cash
- 0.93%
- DSCR
- 1.04
- GRM
- 10.3
CMA / ARV
- ARV (on-the-fly)
- $112,332
- Comps found
- 12
Show comp detail 12 sales within ~0.75 mi
| Address | Dist | Beds/Ba | Sqft | Sold | Price | $/sf | Match |
|---|---|---|---|---|---|---|---|
| 606 Woodville Rd | 0.18mi | 2/1.0 (-1) | 854 (+0%) | 14mo | $51,500 | $60 | 75 |
| 353 Home Ave | 0.62mi | 3/1.0 | 864 (+2%) | 6mo | $129,900 | $150 | 63 |
| 34 W Raleigh Ave | 0.55mi | 2/1.0 (-1) | 795 (-7%) | 0mo | $120,000 | $151 | 58 |
| 445 Luther St | 0.22mi | 2/1.0 (-1) | 936 (+10%) | 13mo | $120,000 | $128 | 57 |
| 398 Home Ave | 0.62mi | 3/1.0 | 864 (+2%) | 16mo | $65,000 | $75 | 55 |
| 133 Winwood Dr | 0.73mi | 2/2.0 (-1) | 864 (+2%) | 3mo | $177,000 | $205 | 52 |
| 231 Reform St | 0.07mi | 2/1.0 (-1) | 728 (-14%) | 23mo | $163,000 | $224 | 49 |
| 33 Chilton Ave | 0.55mi | 2/1.0 (-1) | 772 (-9%) | 7mo | $102,000 | $132 | 48 |
| 352 Remy Ave | 0.65mi | 2/1.0 (-1) | 768 (-10%) | 0mo | $120,000 | $156 | 48 |
| 26 Wolfe Ave | 0.56mi | 3/1.0 | 945 (+11%) | 9mo | $65,500 | $69 | 48 |
| 48 Winwood Dr | 0.57mi | 3/1.0 | 887 (+4%) | 23mo | $117,000 | $132 | 48 |
| 323 Greendale Ave | 0.49mi | 3/1.5 | 960 (+13%) | 23mo | $80,000 | $83 | 34 |
Match score weights: distance 35% · size 25% · config 20% · recency 20%. Top-matched comps best support the ARV.
Projected returns pro-forma
8.45% appreciation · 3.0% rent growth · sell at horizon
- IRR
- 21.7%
- Equity multiple
- 2.62×
- Total profit
- $57,669
- Equity at exit
- $100,335
- IRR
- 19.8%
- Equity multiple
- 5.68×
- Total profit
- $166,188
- Equity at exit
- $203,029
Cash invested: $35,532 (down + closing). Projections, not guarantees.
Landlord ↔ Tenant lean methodology
- Overall (STATE)
- 73 Landlord-Friendly
- State Ohio
- 73 Landlord-Friendly · R+6
- County
- — inherits STATE
- City
- — inherits STATE
ZIP-level market 44902
- Home prices YoY
- 2.9%
- Active inventory
- 30
- Price-to-rent
- 10.3×
Monthly cashflow live
- Estimated rent
- $1,026 high interval (Pro) →
- Mortgage (P&I)
- −$665
- Tax from tax record
- −$65 /mo · $780/yr
- Insurance
- −$53
- HOA
- −$0
- Vacancy / Maint / Mgmt
- −$216
- Net cashflow
- $27
Break-even live
UW: 25.0% down · 7.5% · 30yr · 1.5% tax · 5.0% vac · 8.0% maint · 8.0% mgmt
Financing live
Cash to close
- Down payment
- $31,725
- Closing costs
- $3,807
- Reserves months
- —
- Total cash needed
- —
Loan-product check · same deal, 3 products live
Conventional
25% down · 7.5% · 30yr
- Down + closing
- —
- Monthly P&I
- —
- Monthly cashflow
- —
- DSCR
- —
- Eligible?
- —
Personal DTI + credit; lowest rate.
DSCR
20% down · 8.5% · 30yr
- Down + closing
- —
- Monthly P&I
- —
- Monthly cashflow
- —
- DSCR
- —
- Eligible?
- —
No personal income docs; deal must DSCR.
Hard money
10% down · 12.0% · 12mo
- Down + closing
- —
- Monthly P&I
- —
- Monthly cashflow
- —
- DSCR
- —
- Eligible?
- —
Short-term bridge; refi at stabilization.
Rent comps 5 comps
| Address | Beds | Baths | Sqft | Rent | $/sqft | DOM | Units | Dist |
|---|---|---|---|---|---|---|---|---|
| 282 Cliffbrook Dr Mansfield, OH | 3.0 | 1.0 | 912 | $1,395 | $1.53 | 43d | 1 | 0.39mi |
| 19 State St Mansfield, OH | 3.0 | 1.0 | 1040 | $995 | $0.96 | 43d | 1 | 0.47mi |
| 135 E Cook Rd Mansfield, OH | 1.0–2.0 | 1.0 | 554 | $850 | $1.53 | 43d | 10 | 0.65mi |
| 100 Winwood Dr Mansfield, OH | 2.0 | 1.0 | 700 | $725 | $1.04 | 43d | 1 | 0.66mi |
| 896 Brookfield Dr Mansfield, OH | 2.0 | 1.0 | 770 | $795 | $1.03 | 43d | 1 | 0.74mi |
Listing history 14 events
-
2026-06-19days on market $126,900 Active 18 DOM
-
2026-06-18days on market $126,900 Active 17 DOM
-
2026-06-17days on market $126,900 Active 16 DOM
-
2026-06-16days on market $126,900 Active 15 DOM
-
2026-06-15days on market $126,900 Active 14 DOM
-
2026-06-14days on market $126,900 Active 12 DOM
-
2026-06-12days on market $126,900 Active 11 DOM
-
2026-06-09days on market $126,900 Active 8 DOM
-
2026-06-08days on market $126,900 Active 7 DOM
-
2026-06-07days on market $126,900 Active 6 DOM
-
2026-06-05days on market $126,900 Active 3 DOM
-
2026-06-03days on market $126,900 Active 2 DOM
-
2026-06-02remarks 507-char remark
-
2026-06-02$126,900 Active 1 DOM
ⓘ Source: listings_history table (triggers on properties + properties_extension) + one-shot
backfill from property_details.listing_events for pre-trigger history.
Tax reassessment forecast OH · Partial reset (capped growth)
- Current annual tax
- $780 · $65/mo
- Projected year-2 tax
- $1,380 · $115/mo
- Expected delta
- +$600/yr (+$50/mo · 76.9%)
ⓘ Screening estimate from a state-policy table — verify with the county assessor before closing.
Climate risk First Street
- Flood 1/10 Low FEMA zone X (unshaded) · 0% chance over 30 yrs
- Wildfire 1/10 Low
- Heat 3/10 Moderate 7 d/yr ≥96°F today · 17 d/yr by 30 yrs out
- Wind 2/10 Low 0% chance of damaging wind over 30 yrs
- Air quality 2/10 Low 1 unhealthy d/yr today · 1 by 30 yrs out
Nearby sold comps map
Loading sold comps map…
Walkable amenities ~0.75 mi
Loading nearby amenities…
Taxation est. · year 1
- Rental income
- $12,315
- − Mortgage interest
- −$7,108
- − Property taxes
- −$780
- − Insurance
- −$634
- − Repairs & maintenance
- −$985
- − Management
- −$985
- − Depreciation
- −$3,692
- Taxable loss
- −$1,870
- Est. tax savings @ 24.0%
- +$449
- After-tax cash flow
- $778/yr
For passive investors: Depreciation is non-cash, so a rental often shows a tax loss while cash-flowing — sheltering income. Rental losses are passive: they offset passive income freely, and up to $25,000/yr can offset ordinary (W-2) income if you actively participate and your MAGI is under $100k (phasing out to $0 by $150k); unused losses carry forward. On sale, claimed depreciation is recaptured at up to 25%, and gains may owe capital-gains tax (a 1031 exchange can defer both). Figures are a year-1 estimate at your 24.0% rate — not tax advice; consult a CPA.
Schools (NCES district)
- District
- Mansfield City
- NCES district ID
- 3904429
- Math proficiency
- 24% ▼ -19.00%
- Reading proficiency
- 33% ▼ -12.00%
- Median HH income
- $32,435
- Composite
- 23.25/100
- National rank
- #7934
- State rank
- #590 of 656 in OH
Livability — Mansfield
- Score
- 76/100
- State rank
- #224
- US rank
- #3525
Category grades
Schools grade is shown separately in the Schools card above.
Census & demographics
- Census place
- Mansfield, OH
- County
- Richland · 128,966 people
- City population
- 16,349
- Metro
- Mansfield, OH
- Population (ZIP)
- 4,876
- Household income
- $31,619
- Rent vs Own
- Severe rent burden
- 13.2
Population outlook (Richland County) Hauer SSP2
- Today (2025)
- 115,577 people
- By 2030
- 111,669 · -3.4%
- By 2040
- 103,323 · -10.6%
- By 2050
- 95,135 · -17.7%
- By 2075
- 76,719 · -33.6%
- By 2100
- 57,188 · -50.5%
Race, ethnicity, and origin ACS 2023
- Neighborhood character
- Diverse neighborhood (Simpson 0.61)
- Race & ethnicity
- White 52% Black 35% Two or more races 10% Hispanic / Latino 5%
- Common ancestry
- Italian 2% Serbian 2% Iranian 1%
- Foreign-born
- 1% · Canada
- Languages at home
- 95% English-only · Spanish 4% Other Indo-European 1%
Political lean MEDSL · Richland
- 2024 margin
- Solid R (+42.3) · D 28.4% · R 70.8%
- 2008→2024 swing
- -28.8pp toward R · 2008: -13.6pp · 2024: -42.3pp
- All cycles
- 2024: R+42.3 2020: R+39.7 2016: R+37.5 2012: R+20.1 2008: R+13.6
Not yet ingested
- Civics
- —
Market trends
- HPI YoY
- ▲ 8.45%
- Current HPI
- 302.035
- Rent YoY
- —
- Metro
- —
- State GDP YoY
- ▲ 1.98%
- F500 in state
- 48
Industry mix (Fortune 500 HQ in OH)
| Industry | F500 HQs | Revenue |
|---|---|---|
| Insurance | 3 | $145B |
|
||
| Industrial Machinery | 3 | $49B |
|
||
| Financial Services | 3 | $24B |
|
||
| Consumer Goods | 2 | $93B |
|
||
| Aerospace / Defense | 2 | $47B |
|
||
| Utilities | 2 | $33B |
|
||
Price history
+428.7% since first listed4 events — show timeline
- 2026-06-01 Price Changed $126,900 MARMLS
- 2026-06-01 Listed $125,900 MARMLS
- 2005-09-23 Sold (Public Records) $66,435 Public Records
- 1990-12-07 Sold (Public Records) $24,000 Public Records
Property tax history
-3.2%/yrLatest (2025): $780 · -5.5% YoY. Source: county tax records.
Cash-flow waterfall
monthlySold comps — $/sqft
last 12 mo · ≤1 miLoading sold comps…