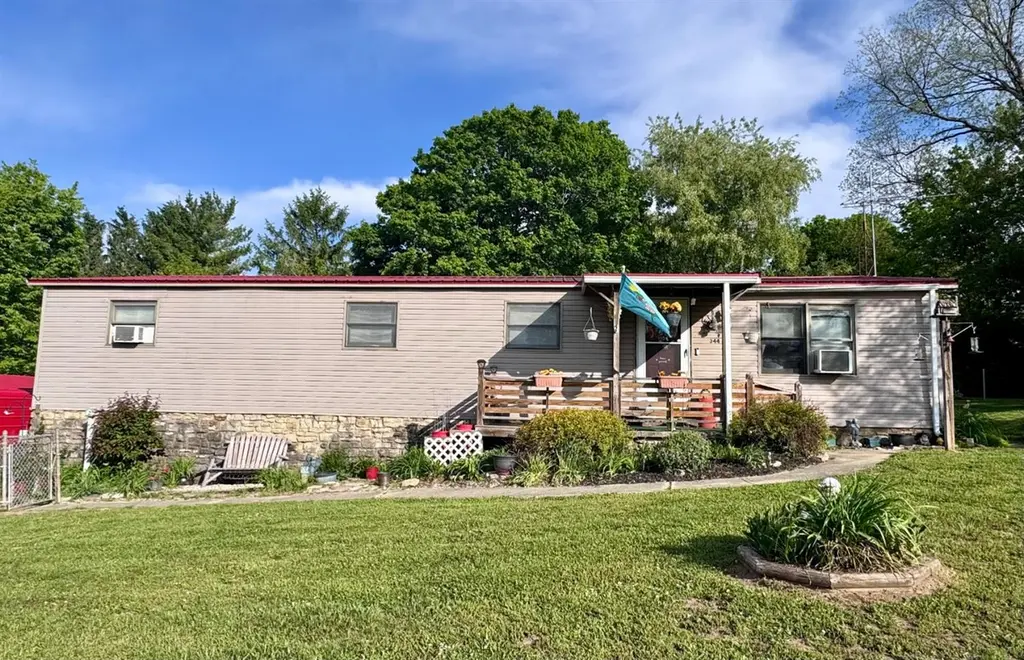
344 Lafayette St · Laurel, IN
Flood risk 1/10 · Minimal
- FEMA flood zone
- X (unshaded)
- Chance of flooding over 30 yrs
- 0.0%
- Est. flood insurance / yr
- $507 – $1,088
Fire risk 1/10 · Minimal
- Est. fire insurance / yr
- $717 – $1,331
Heat risk 3/10 · Minor
- Hot days now (above 102°F)
- 7 days/yr
- Hot days in 30 yrs
- 19 days/yr
Wind risk 2/10 · Minimal
- Chance of severe wind over 30 yrs
- 1.0%
Air-quality risk 2/10 · Minimal
- Unhealthy air days now
- 1 days/yr
- Unhealthy air days in 30 yrs
- 2 days/yr
Risk factors via First Street. Map © Google.
Why this score? — see what drove the B grade
The composite is a weighted blend of 9 inputs, each scored 0–100. Each bar is that input's sub-score; the figure is the points it added to the 100-point composite (weight × sub-score).
- Cash flow +28.0/30.0
- DSCR +9.9/10.0
- Appreciation +9.0/10.0
- ARV discount +7.5/15.0
- 1% rule +6.4/10.0
- Schools +5.0/10.0
- Livability +3.1/5.0
- Rent growth +2.5/5.0
- Condition / age +2.5/5.0
$125,000
🖨 Deal sheet 📄 Offer letter ✓ Due diligence
Listing remarks
Spacious and well-maintained 3-bedroom, 2 full bath home offering over 1500 sq. ft. of comfortable living space. This property features a durable metal roof and comes equipped with appliances, making it move-in ready. Enjoy the bright and inviting sunroom--perfect for relaxing evenings year-round. Outside, you'll find a 2-car detached carport, additional car shed for extra storage, and a charming outdoor gazebo ideal for entertaining. The partially fenced yard provides both privacy and functionality. A great opportunity for homeowners or investors alike!
Key facts
- 0.28 acre lot
- 2 garage spots
- Built 1974
Property features AI
Exterior
- Parking: Detached carport; Detached 2-car garage
- Utilities: Private water source; Community sewer
- Home design: Manufactured home; One level
- Construction: Vinyl siding; Block foundation
- Exterior features: Covered patio/porch; Lot approximately 0.28 acres (1/4–1/2 acre)
Interior
- Kitchen: Electric cooktop; Electric oven; Microwave; Dishwasher; Refrigerator
- Bedrooms: 3 bedrooms (all on the main level)
- Bathrooms: 2 full bathrooms (both on the main level)
- Heating & cooling: Baseboard heating; Window unit(s) for cooling
- Interior features: Water softener (owned); Covered patio/porch
- Laundry & utility: Laundry room on main level; Electric water heater; Water heater
Neighborhood map
What this means for you Summary
Snapshot
- This is a 4-bed/2.0-bath manufactured listed at $125k.
Deal economics
- At list price, monthly cash flow is $390 ($5k/yr) — positive.
- The deal already cash-flows at list — no discount required.
- Meets the 1% rule at list price ($1k rent vs $125k).
- Recommended offer: $121k (3.0% below list) — sets the bar for market timing.
Location & tenants
- Location reads 61/100 on livability (#488 in IN) — a middle-class / working-renter tenant base. Strengths: cost of living A+, health & safety A+, housing A-; Watch: schools F, crime D-, amenities F.
- Market conditions: 58 units permitted in Franklin County in 2024 (0 in 5+ unit buildings).
Forward outlook
- In year one you build about $11k of equity ($864 loan paydown + $10k appreciation (7.9% local appreciation)).
- Franklin County population projected to shrink 10% by 2050 — rents likely to lag national; underwrite the cash flow, not the appreciation.
- At projected returns (7.9% appreciation + 3.0% rent growth), your $35k cash investment doubles in ~3 years — after that, you're playing with house money.
- By year 4, paydown + projected appreciation supports a ~$37k cash-out refi (75% LTV) — recoverable capital for the next deal without selling this one.
Negotiation context
- It's been on market 41 days — a 3% lower offer ($121k) is reasonable based on typical stale-listing flexibility.
- 3 sale attempts; this cycle's ask has dropped $10k (7%) from the opening price — seller is motivated, your offer sets the floor, not the list.
- Current owner paid $45k; list at $125k implies a 178% gain — meaningful room to come down on a strong offer.
Questions for the listing agent
- It's been on market 41 days. Have you received any prior offers? Is the seller open to a 3% concession, seller financing, or rate buy-down credit?
- Built in 1974 — when were the roof, HVAC, electrical panel, plumbing, and water heater last replaced?
- Is there a deadline driving the sale (1031 exchange, divorce, estate, relocation)? That informs how much negotiation room exists.
- Schools are F-rated, which usually means shorter tenancies and higher turnover. Who's the typical renter profile here, and what's been the actual vacancy rate?
- Crime grade is D in this area — have there been break-ins, vandalism, or insurance claims at this property in the last 3 years? What carrier currently insures it and at what premium?
- What's the average days-on-market for RENTAL listings here right now (not sales)? A rising rental-DOM trend means longer vacancies and softer asking-rent achievability than the comps imply.
- What's the recent tenant-quality profile in this submarket — average credit score on applications, eviction rate, late-payment / NSF rate, and stable-employment percentage? A property-management company in the area should have these aggregated.
- How much new for-sale + rental construction is in the pipeline within 1–3 miles? Heavy new supply typically softens prices + rents 12–24 months out; constrained supply supports both.
Investment metrics
- 1% rule
- 1.14% ✓
- Cap rate
- 10.03%
- Cash-on-cash
- 13.36%
- DSCR
- 1.59
- GRM
- 7.3
CMA / ARV
No comps found within radius.
Projected returns pro-forma
7.94% appreciation · 3.0% rent growth · sell at horizon
- IRR
- 30.3%
- Equity multiple
- 3.17×
- Total profit
- $75,808
- Equity at exit
- $94,480
- IRR
- 27.0%
- Equity multiple
- 6.75×
- Total profit
- $201,375
- Equity at exit
- $187,079
Cash invested: $35,000 (down + closing). Projections, not guarantees.
Landlord ↔ Tenant lean methodology
- Overall (STATE)
- 90 Strongly Landlord-Friendly
- State Indiana
- 90 Strongly Landlord-Friendly · R+11
- County
- — inherits STATE
- City
- — inherits STATE
ZIP-level market 47024
- Home prices YoY
- 3.2%
- Price-to-rent
- 7.3×
Monthly cashflow live
- Estimated rent
- $1,430 medium interval (Pro) →
- Mortgage (P&I)
- −$656
- Tax from tax record
- −$33 /mo · $390/yr
- Insurance
- −$52
- HOA
- −$0
- Vacancy / Maint / Mgmt
- −$300
- Net cashflow
- $390
Break-even live
UW: 25.0% down · 7.5% · 30yr · 1.5% tax · 5.0% vac · 8.0% maint · 8.0% mgmt
Financing live
Cash to close
- Down payment
- $31,250
- Closing costs
- $3,750
- Reserves months
- —
- Total cash needed
- —
Loan-product check · same deal, 3 products live
Conventional
25% down · 7.5% · 30yr
- Down + closing
- —
- Monthly P&I
- —
- Monthly cashflow
- —
- DSCR
- —
- Eligible?
- —
Personal DTI + credit; lowest rate.
DSCR
20% down · 8.5% · 30yr
- Down + closing
- —
- Monthly P&I
- —
- Monthly cashflow
- —
- DSCR
- —
- Eligible?
- —
No personal income docs; deal must DSCR.
Hard money
10% down · 12.0% · 12mo
- Down + closing
- —
- Monthly P&I
- —
- Monthly cashflow
- —
- DSCR
- —
- Eligible?
- —
Short-term bridge; refi at stabilization.
Listing history 16 events
-
2026-06-15days on market $125,000 Active 41 DOM
-
2026-06-13days on market $125,000 Active 39 DOM
-
2026-06-13days on market $125,000 Active 38 DOM
-
2026-06-09days on market $125,000 Active 35 DOM
-
2026-06-08days on market $125,000 Active 34 DOM
-
2026-06-07days on market $125,000 Active 33 DOM
-
2026-06-04days on market $125,000 Active 30 DOM
-
2026-06-03days on market $125,000 Active 29 DOM
-
2026-06-02days on market $125,000 Active 28 DOM
-
2026-06-01days on market $125,000 Active 27 DOM
-
2026-05-31days on market $125,000 Active 26 DOM
-
2026-05-04$135,000 Active 560-char remark
-
2026-05-04$135,000 Active 560-char remark
-
2026-05-04$135,000 Active
-
2009-03-28soldstatus $45,000
-
2008-09-24soldstatus $10,000
ⓘ Source: listings_history table (triggers on properties + properties_extension) + one-shot
backfill from property_details.listing_events for pre-trigger history.
Tax reassessment forecast IN · Partial reset (capped growth)
- Current annual tax
- $390 · $33/mo
- Projected year-2 tax
- $726 · $61/mo
- Expected delta
- +$336/yr (+$28/mo · 86.2%)
ⓘ Screening estimate from a state-policy table — verify with the county assessor before closing.
Climate risk First Street
- Flood 1/10 Low FEMA zone X (unshaded) · 0% chance over 30 yrs
- Wildfire 1/10 Low
- Heat 3/10 Moderate 7 d/yr ≥102°F today · 19 d/yr by 30 yrs out
- Wind 2/10 Low 100% chance of damaging wind over 30 yrs
- Air quality 2/10 Low 1 unhealthy d/yr today · 2 by 30 yrs out
Nearby sold comps map
Loading sold comps map…
Walkable amenities ~0.75 mi
Loading nearby amenities…
Taxation est. · year 1
- Rental income
- $17,163
- − Mortgage interest
- −$7,002
- − Property taxes
- −$390
- − Insurance
- −$625
- − Repairs & maintenance
- −$1,373
- − Management
- −$1,373
- − Depreciation
- −$3,636
- Taxable income
- $2,764
- Est. tax owed @ 24.0%
- −$663
- After-tax cash flow
- $4,014/yr
For passive investors: Depreciation is non-cash, so a rental often shows a tax loss while cash-flowing — sheltering income. Rental losses are passive: they offset passive income freely, and up to $25,000/yr can offset ordinary (W-2) income if you actively participate and your MAGI is under $100k (phasing out to $0 by $150k); unused losses carry forward. On sale, claimed depreciation is recaptured at up to 25%, and gains may owe capital-gains tax (a 1031 exchange can defer both). Figures are a year-1 estimate at your 24.0% rate — not tax advice; consult a CPA.
Schools (NCES district)
No district data.
Livability — Laurel
- Score
- 61/100
- State rank
- #488
- US rank
- #17449
Category grades
Schools grade is shown separately in the Schools card above.
Census & demographics
- Census place
- Laurel, IN
- Population (ZIP)
- 2,909
Population outlook (Franklin County) Hauer SSP2
- Today (2025)
- 22,796 people
- By 2030
- 22,556 · -1.1%
- By 2040
- 21,762 · -4.5%
- By 2050
- 20,575 · -9.7%
- By 2075
- 17,810 · -21.9%
- By 2100
- 13,698 · -39.9%
Race, ethnicity, and origin ACS 2023
- Neighborhood character
- Predominantly White (93%)
- Race & ethnicity
- White 93% Two or more races 4% Hispanic / Latino 2%
- Common ancestry
- Slovak 2% Italian 2% Romanian 2%
- Languages at home
- 98% English-only · German/W. Germanic 1%
Political lean MEDSL · Franklin
- 2024 margin
- Solid R (+64.4) · D 17.1% · R 81.5% · Other 1.3%
- 2008→2024 swing
- -30.3pp toward R · 2008: -34.1pp · 2024: -64.4pp
- All cycles
- 2024: R+64.4 2020: R+63.0 2016: R+60.9 2012: R+42.8 2008: R+34.1
Not yet ingested
- Civics
- —
Market trends
- HPI YoY
- ▲ 7.94%
- Current HPI
- 255.8207
- Rent YoY
- —
- Metro
- —
- State GDP YoY
- ▲ 2.90%
- F500 in state
- 18
Industry mix (Fortune 500 HQ in IN)
| Industry | F500 HQs | Revenue |
|---|---|---|
| Industrial Machinery | 2 | $37B |
|
||
| Healthcare | 1 | $177B |
|
||
| Pharmaceuticals | 1 | $45B |
|
||
| Metals / Steel | 1 | $18B |
|
||
| Agriculture | 1 | $17B |
|
||
| Packaging | 1 | $12B |
|
||
Price history
+1150.0% since first listed9 events — show timeline
- 2026-06-15 Listing Removed — MIBOR as Distributed by MLS Grid
- 2026-05-19 Price Changed $125,000 SEIBR
- 2026-05-19 Price Changed $125,000 ECIAOR
- 2026-05-19 Price Changed $125,000 MIBOR as Distributed by MLS Grid
- 2026-05-04 Listed $135,000 ECIAOR
- 2026-05-04 Listed $135,000 SEIBR
- 2026-05-04 Listed $135,000 MIBOR as Distributed by MLS Grid
- 2009-03-28 Sold (Public Records) $45,000 Public Records
- 2008-09-24 Sold (Public Records) $10,000 Public Records
Property tax history
+4.4%/yrLatest (2024): $390 · +6.0% YoY. Source: county tax records.
Cash-flow waterfall
monthlySold comps — $/sqft
last 12 mo · ≤1 miLoading sold comps…