 🏗️ New Construction
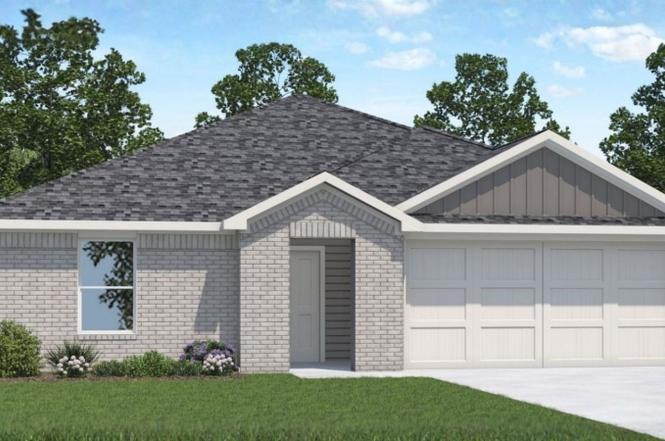
40639 Balsam Run Ln · Magnolia, TX
Flood risk No data
- FEMA flood zone
- —
- Chance of flooding over 30 yrs
- —
- Est. flood insurance / yr
- —
Fire risk No data
- Est. fire insurance / yr
- —
Heat risk No data
- Hot days now (above threshold)
- —
- Hot days in 30 yrs
- —
Wind risk No data
- Chance of severe wind over 30 yrs
- —
Air-quality risk No data
- Unhealthy air days now
- —
- Unhealthy air days in 30 yrs
- —
Risk factors via First Street. Map © Google.
Why this score? — see what drove the D+ grade
The composite is a weighted blend of 9 inputs, each scored 0–100. Each bar is that input's sub-score; the figure is the points it added to the 100-point composite (weight × sub-score).
- Cash flow +10.3/30.0
- Appreciation +10.0/10.0
- ARV discount +7.5/15.0
- Condition / age +5.0/5.0
- Schools +3.9/10.0
- Livability +3.7/5.0
- 1% rule +3.3/10.0
- DSCR +3.0/10.0
- Rent growth +2.6/5.0
$273,990
🖨 Deal sheet (PDF) 📄 Offer letter ✓ Due diligence
Listing remarks
LOVELY BRAND NEW D. R. HORTON HOM E IN MILL CREEK! GREAT ONE STORY FLOORPLAN! Offers the perfect blend of space and comfort. Featuring 4 bedrooms and 2 bathrooms, this home is designed for modern living. The heart of the home is the spacious family area seamlessly connected to the kitchen, creating a warm and inviting atmosphere for family gatherings and entertaining friends. Each bedroom comes with its own closet, providing ample storage space and privacy for everyone in the family. But that's not all – this home is equipped with blinds throughout and includes a Smart Home package, adding convenience and style to your daily life. Experience the ease of controlling your home's feature
Key facts
- Spacious family area
- Smart home package
- Blinds throughout
Tags
Property features AI
Finance
- HOA & community: Association: Inframark; Annual association fee; Community pool
Exterior
- Parking: Attached 2-car garage with garage door opener
- Security: Prewired for security; Smoke detector(s)
- Utilities: Public water; Public sewer
- Home design: Residential property; New construction (under construction); Single-story (entry on first floor)
- Construction: Built in 2026; Brick and cement siding exterior; Composition roof; Slab foundation; Builder: D.R. Horton
- Exterior features: Private yard; Back yard fencing; Sprinkler/irrigation; Porch; Subdivision lot
Interior
- Kitchen: Dishwasher; Disposal; Gas oven; Gas range; Microwave; Quartz counters; Kitchen island; Pantry
- Bedrooms: Primary bedroom (First floor) — 17x13; Bedroom (First floor) — 11x10; Bedroom (First floor) — 11x10; Bedroom (First floor) — 11x10
- Flooring: Carpet; Plank; Vinyl
- Bathrooms: 2 full bathrooms
- Heating & cooling: Central heating (gas); Central electric air conditioning; Programmable thermostat
- Interior features: Breakfast bar; Kitchen island; Kitchen/family room combo; Pantry; Quartz counters; Kitchen/dining combo; Living/dining room; Programmable thermostat; Low emissivity windows; Ventilation for improved indoor air quality
- Laundry & utility: Washer hookup; Electric dryer hookup; Tankless water heater
Neighborhood map
What this means for you Summary
Snapshot
- This is a 4-bed/2.0-bath single-family listed at $274k. Condition is rated excellent.
Deal economics
- At list price, monthly cash flow is $-157 ($-2k/yr) — negative.
- To cash-flow at today's rent, offer at most $264k (3.8% below list).
- To meet the 1% rule (rent ≥ 1% of price), the offer needs to be $239k (12.9% below list).
- Recommended offer: $239k (12.9% below list) — sets the bar for 1% rule.
- Cap rate 5.6% vs local median 3.4% in Magnolia — top-decile yield for the area; either an underpriced asset or a hidden risk that comps aren't pricing in. Stress-test before assuming the spread holds.
Location & tenants
- Location reads 73/100 on livability (#222 in TX) — a middle-class / working-renter tenant base. Strengths: crime A+, cost of living A+, housing A+; Watch: schools D+, amenities F, commute F.
- Magnolia ISD (rural): math 42% / reading 45% proficiency, ranked #247 of 826 in TX (top 30%) — families likely to look elsewhere, expect single-tenant / working-renter base with shorter leases.
- Market conditions: Rents flat; 1604 active listings in the ZIP; 7 comparable units currently listed for rent nearby; rentals lingering (median 44d on market — plan ~5-8 weeks vacancy on turnover, expect pricing pressure); 57% of comp listings sitting > 30 days — soft ceiling on asking rent; high-income renter base; 13,259 units permitted in Montgomery County in 2024 (1,402 in 5+ unit buildings).
Forward outlook
- In year one you build about $31k of equity ($2k loan paydown + $29k appreciation (10.0% local appreciation)).
- Montgomery County population projected at +65% by 2050 — long-run rental-demand tailwind backs the buy-and-hold thesis.
- By year 2, paydown + projected appreciation supports a ~$49k cash-out refi (75% LTV) — recoverable capital for the next deal without selling this one.
Negotiation context
- Only 1 days on market — expect competitive offers; lowballing is unlikely to land.
Questions for the listing agent
- What do current leases actually rent for vs. the listed asking? Can we see a recent rent roll and the last 12 months of T-12 income?
- What does the HOA fee cover, when was the last increase, and are there any pending special assessments or reserve-fund shortfalls?
- Is there a deadline driving the sale (1031 exchange, divorce, estate, relocation)? That informs how much negotiation room exists.
- Schools are D-rated, which usually means shorter tenancies and higher turnover. Who's the typical renter profile here, and what's been the actual vacancy rate?
- The area grade is low — what's the realistic commute time and amenity access for the typical tenant pool here? Any planned neighborhood developments (good or bad) we should know about?
- What's the average days-on-market for RENTAL listings here right now (not sales)? A rising rental-DOM trend means longer vacancies and softer asking-rent achievability than the comps imply.
- What's the recent tenant-quality profile in this submarket — average credit score on applications, eviction rate, late-payment / NSF rate, and stable-employment percentage? A property-management company in the area should have these aggregated.
- How much new for-sale + rental construction is in the pipeline within 1–3 miles? Heavy new supply typically softens prices + rents 12–24 months out; constrained supply supports both.
Investment metrics
- 1% rule
- 0.83% ✗
- Cap rate
- 5.64%
- Cash-on-cash
- -2.35%
- DSCR
- 0.90
- GRM
- 10.0
CMA / ARV
- ARV (on-the-fly)
- $286,315
- Comps found
- 12
Show comp detail 12 sales within ~0.75 mi
| Address | Dist | Beds/Ba | Sqft | Sold | Price | $/sf | Match |
|---|---|---|---|---|---|---|---|
| 40654 Balsam Run Ln | 0.04mi | 3/2.0 (-1) | 1,575 (-5%) | 0mo | $287,490 | $183 | 85 |
| 40838 Hawthorne Glades St | 0.09mi | 4/2.0 | 1,573 (-5%) | 5mo | $253,990 | $161 | 83 |
| 40739 Barley Straw Dr | 0.27mi | 4/2.0 | 1,750 (+6%) | 3mo | $292,490 | $167 | 75 |
| 41018 Riverside Meadows Dr | 0.36mi | 3/2.0 (-1) | 1,620 (-2%) | 3mo | $329,990 | $204 | 72 |
| 40742 Barley Straw Dr | 0.28mi | 3/2.0 (-1) | 1,575 (-5%) | 2mo | $279,990 | $178 | 72 |
| 40814 Hawthorne Glades St | 0.11mi | 5/2.0 (+1) | 1,882 (+14%) | 0mo | $279,990 | $149 | 67 |
| 40835 Hawthorne Glades St | 0.11mi | 3/2.5 (-1) | 1,470 (-11%) | 6mo | $253,990 | $173 | 64 |
| 40807 Hawthorne Glades | 0.14mi | 5/2.5 (+1) | 1,892 (+14%) | 2mo | $259,990 | $137 | 61 |
| 40966 Seasoned Oak Ln | 0.15mi | 5/2.5 (+1) | 1,892 (+14%) | 3mo | $254,990 | $135 | 60 |
| 40934 Seasoned Oak Ln | 0.17mi | 5/2.5 (+1) | 1,892 (+14%) | 5mo | $266,990 | $141 | 57 |
| 40418 Winding Way Ct | 0.69mi | 3/2.0 (-1) | 1,605 (-3%) | 5mo | $350,000 | $218 | 54 |
| 15214 Black Scoter Ct | 0.75mi | 3/2.0 (-1) | 1,614 (-2%) | 6mo | $299,900 | $186 | 51 |
Match score weights: distance 35% · size 25% · config 20% · recency 20%. Top-matched comps best support the ARV.
Projected returns pro-forma
10.0% appreciation · 0.32% rent growth · sell at horizon
- IRR
- 21.8%
- Equity multiple
- 2.74×
- Total profit
- $139,757
- Equity at exit
- $257,935
- IRR
- 19.0%
- Equity multiple
- 6.09×
- Total profit
- $408,191
- Equity at exit
- $556,247
Cash invested: $80,168 (down + closing). Projections, not guarantees.
Landlord ↔ Tenant lean methodology
- Overall (STATE)
- 87 Strongly Landlord-Friendly
- State Texas
- 87 Strongly Landlord-Friendly · R+5
- County
- — inherits STATE
- City
- — inherits STATE
ZIP-level market 77354
- Home prices YoY
- 2.4%
- Rents YoY
- 0.3%
- Active inventory
- 1604
- Price-to-rent
- 9.6×
Monthly cashflow live
- Estimated rent
- $2,386 high interval (Pro) →
- Mortgage (P&I)
- −$1,501
- Tax est. 1.5%
- −$358 /mo · $4,295/yr
- Insurance
- −$119
- HOA
- −$63
- Vacancy / Maint / Mgmt
- −$501
- Net cashflow
- $-157
Break-even live
Sensitivity live
| Price | -10% $41 | -5% $-58 | +0% $-157 | +5% $-256 | +10% $-355 |
|---|---|---|---|---|---|
| Rent | -10% $-345 | -5% $-251 | +0% $-157 | +5% $-63 | +10% $32 |
| Rate | -1.0pp $-13 | -0.5pp $-84 | base $-157 | +0.5pp $-231 | +1.0pp $-306 |
UW: 25.0% down · 7.5% · 30yr · 1.5% tax · 5.0% vac · 8.0% maint · 8.0% mgmt
Financing live
Cash to close
- Down payment
- $71,579
- Closing costs
- $8,589
- Reserves months
- —
- Total cash needed
- —
Loan-product check · same deal, 3 products live
Conventional
25% down · 7.5% · 30yr
- Down + closing
- —
- Monthly P&I
- —
- Monthly cashflow
- —
- DSCR
- —
- Eligible?
- —
Personal DTI + credit; lowest rate.
DSCR
20% down · 8.5% · 30yr
- Down + closing
- —
- Monthly P&I
- —
- Monthly cashflow
- —
- DSCR
- —
- Eligible?
- —
No personal income docs; deal must DSCR.
Hard money
10% down · 12.0% · 12mo
- Down + closing
- —
- Monthly P&I
- —
- Monthly cashflow
- —
- DSCR
- —
- Eligible?
- —
Short-term bridge; refi at stabilization.
Rent comps 7 comps
| Address | Beds | Baths | Sqft | Rent | $/sqft | DOM | Units | Dist |
|---|---|---|---|---|---|---|---|---|
| 40839 Hawthorne Glades St Magnolia, TX | 3.0 | 2.0 | 1156 | $2,100 | $1.82 | 44d | 1 | 0.14mi |
| 14983 Clay Harvest Rdg Magnolia, TX | 4.0 | 3.0 | 2173 | $2,375 | $1.09 | 44d | 1 | 0.33mi |
| 14727 Band Tailed Pigeon Ct Magnolia, TX | 4.0 | 3.0 | 1942 | $2,700 | $1.39 | 44d | 1 | 0.86mi |
| 39899 Mill Creek Rd Magnolia, TX | 1.0–3.0 | 1.0–2.0 | 1104 | $2,726 | $2.47 | 1d | 40 | 1.08mi |
| 40547 Berylline Ln Magnolia, TX | 4.0 | 2.0 | 1753 | $2,300 | $1.31 | 44d | 1 | 1.26mi |
| 40558 Berylline Ln Unit NA Magnolia, TX | 3.0 | 2.0 | 1499 | $2,150 | $1.43 | 24d | 1 | 1.28mi |
| 21619 Bluebonnet Bay Dr Magnolia, TX | 3.0–5.0 | 2.0–2.5 | 1911 | $2,625 | $1.37 | 1d | 1 | 1.42mi |
HOA detail
- Monthly dues
- $63 · $756/yr
Listing history 2 events
-
2026-06-17remarks 693-char remark
-
2026-06-17$273,990 Active 1 DOM
ⓘ Source: listings_history table (triggers on properties + properties_extension) + one-shot
backfill from property_details.listing_events for pre-trigger history.
Nearby sold comps map
Loading sold comps map…
Walkable amenities ~0.75 mi
Loading nearby amenities…
Taxation est. · year 1
- Rental income
- $28,631
- − Mortgage interest
- −$16,038
- − Property taxes
- −$4,295
- − Insurance
- −$1,432
- − Repairs & maintenance
- −$2,290
- − Management
- −$2,290
- − HOA
- −$756
- − Depreciation
- −$8,329
- Taxable loss
- −$6,800
- Est. tax savings @ 24.0%
- +$1,632
- After-tax cash flow
- $-250/yr
For passive investors: Depreciation is non-cash, so a rental often shows a tax loss while cash-flowing — sheltering income. Rental losses are passive: they offset passive income freely, and up to $25,000/yr can offset ordinary (W-2) income if you actively participate and your MAGI is under $100k (phasing out to $0 by $150k); unused losses carry forward. On sale, claimed depreciation is recaptured at up to 25%, and gains may owe capital-gains tax (a 1031 exchange can defer both). Figures are a year-1 estimate at your 24.0% rate — not tax advice; consult a CPA.
Condition & rehab AI · 12 photos
This brand-new D.R. Horton home in Magnolia, TX, is move-in ready with a modern design, smart home features, and a well-maintained exterior. It offers a great one-story floor plan with 4 bedrooms and 2 bathrooms, perfect for modern living.
Value-add opportunities
- Both Landscaping improvements — Enhances curb appeal and adds value
- Both Smart home package upgrade — Improves convenience and adds modern appeal
Renovation cost estimate screening
Value-add ROI direction
- Both Landscaping improvements — Enhances curb appeal and adds value ↑
- Both Smart home package upgrade — Improves convenience and adds modern appeal ↑
ⓘ Cost ranges are severity-bucket heuristics (US national rule-of-thumb). Get contractor quotes + a written scope before underwriting a rehab budget.
Schools (NCES district)
- District
- Magnolia ISD
- NCES district ID
- 4828740
- Math proficiency
- 42% ▼ -7.00%
- Reading proficiency
- 45% ▼ -4.00%
- Median HH income
- $71,692
- Composite
- 39.46/100
- National rank
- #3958
- State rank
- #247 of 826 in TX
Livability — Magnolia
- Score
- 73/100
- State rank
- #222
- US rank
- #5442
Category grades
Schools grade is shown separately in the Schools card above.
Census & demographics
- County
- Montgomery County · 663,713 people
- City population
- 32,847
- Metro
- Houston-The Woodlands-Sugar Land, TX
- Population (ZIP)
- 44,900
- Household income
- $112,504
- Rent vs Own
- Severe rent burden
- 586.0
Population outlook (Montgomery County) Hauer SSP2
- Today (2025)
- 713,896 people
- By 2030
- 805,263 · +12.8%
- By 2040
- 992,708 · +39.1%
- By 2050
- 1,179,590 · +65.2%
- By 2075
- 1,628,084 · +128.1%
- By 2100
- 1,937,880 · +171.5%
Race, ethnicity, and origin ACS 2023
- Neighborhood character
- Predominantly White (66%)
- Race & ethnicity
- White 66% Hispanic / Latino 25% Two or more races 18% Black 3% Asian 1%
- Hispanic origin (detail)
- Mexican 14% Puerto Rican 1%
- Common ancestry
- Lithuanian 4% Slovak 2% Italian 2%
- Foreign-born
- 11% · Canada, Vietnam
- Languages at home
- 83% English-only · Spanish 15% Other Indo-European 1% German/W. Germanic 1%
Political lean MEDSL · Montgomery
- 2024 margin
- Solid R (+45.5) · D 26.8% · R 72.3%
- 2008→2024 swing
- +7.2pp toward D · 2008: -52.7pp · 2024: -45.5pp
- All cycles
- 2024: R+45.5 2020: R+43.8 2016: R+51.4 2012: R+60.7 2008: R+52.7
Not yet ingested
- Civics
- —
Market trends
- HPI YoY
- ▲ 12.09%
- Current HPI
- 512.87
- Rent YoY
- ▲ 0.32%
- Metro
- Houston-The Woodlands-Sugar Land, TX
- State GDP YoY
- ▲ 3.95%
- F500 in state
- 110
Industry mix (Fortune 500 HQ in TX)
| Industry | F500 HQs | Revenue |
|---|---|---|
| Energy | 16 | $1,198B |
|
||
| Technology | 5 | $198B |
|
||
| Engineering / Construction | 4 | $72B |
|
||
| Energy Services | 3 | $60B |
|
||
| Utilities | 3 | $41B |
|
||
| Healthcare | 2 | $330B |
|
||
Price history
1 event — show timeline
- 2026-06-17 Listed $273,990 HARMLS
Cash-flow waterfall
monthlySold comps — $/sqft
last 12 mo · ≤1 miLoading sold comps…