5600 E Marina Dr · Dania Beach, FL
Flood risk 1/10 · Minimal
- FEMA flood zone
- X (shaded)
- Chance of flooding over 30 yrs
- 0.0%
- Est. flood insurance / yr
- $507 – $1,088
Fire risk 1/10 · Minimal
- Est. fire insurance / yr
- $947 – $1,759
Heat risk 10/10 · Severe
- Hot days now (above 105°F)
- 6 days/yr
- Hot days in 30 yrs
- 21 days/yr
Wind risk 10/10 · Severe
- Chance of severe wind over 30 yrs
- 99.0%
Air-quality risk 2/10 · Minimal
- Unhealthy air days now
- 2 days/yr
- Unhealthy air days in 30 yrs
- 2 days/yr
Risk factors via First Street. Map © Google.
Why this score? — see what drove the C- grade
The composite is a weighted blend of 9 inputs, each scored 0–100. Each bar is that input's sub-score; the figure is the points it added to the 100-point composite (weight × sub-score).
- Cash flow +25.6/30.0
- DSCR +8.5/10.0
- 1% rule +5.7/10.0
- Schools +4.1/10.0
- Livability +3.9/5.0
- Rent growth +2.8/5.0
- Condition / age +2.5/5.0
- ARV discount +0.0/15.0
- Appreciation +0.0/10.0
$295,000
🖨 Deal sheet 📄 Offer letter ✓ Due diligence
Listing remarks
While hoa fees are skyrocketing in Florida, these homes are located in one of the best safest areas in Fortlauderdale. You own the land. The amenities are comparable to 5 star residences here in the State. The best of it all 8s that this home has a great income potential as it has in law/ studio with its own bathroom kitchenette & amp; entrance. Clean & amp; quiet street. Great neighbors mostly seasonally present. Close to everything from beaches to one of the best hotel casinos in the USA the Hard Rock. This as well a fresh investment as the value keeps on constantly increasing. Huge open kitchen to a big living room. Let alone the front terrace that it s been covered and equipped
Key facts
- In law studio
- Clean quiet street
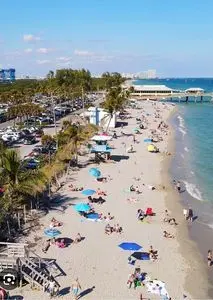
- Close to beaches
Tags
Neighborhood map
What this means for you Summary
Snapshot
- This is a 3-bed/2.0-bath manufactured listed at $295k.
Deal economics
- At list price, monthly cash flow is $700 ($8k/yr) — positive.
- The deal already cash-flows at list — no discount required.
- Meets the 1% rule at list price ($3k rent vs $295k).
- Cap rate 9.1% vs local median 3.9% in Dania Beach — top-decile yield for the area; either an underpriced asset or a hidden risk that comps aren't pricing in. Stress-test before assuming the spread holds.
Location & tenants
- Location reads 77/100 on livability (#180 in FL, #2,806 nationally) — a middle-class / working-renter tenant base. Strengths: commute A+, cost of living A, housing A; Watch: schools D, employment D, amenities F.
- Broward (suburban): math 42% / reading 53% proficiency, ranked #46 of 73 in FL (top 63%) — families likely to look elsewhere, expect single-tenant / working-renter base with shorter leases.
- Market conditions: Rents rising (+1.3%/yr); 412 active listings in the ZIP; 40 comparable units currently listed for rent nearby; rentals at typical pace (median 25d on market — plan ~3-4 weeks tenant-placement turnaround); solid renter incomes; 2,111 units permitted in Broward County in 2024 (1,265 in 5+ unit buildings).
- At $3,155/mo this rent would consume 50% of the median local household income ($76k/yr) (locally 1903% of renters already pay >50% of income on rent) — very limited rent-growth headroom before tenants either downsize or default.
Forward outlook
- Local home prices are declining (-3.0%/yr); year-one equity from $2k of loan paydown is wiped out by about $9k of value loss. Plan a longer hold.
- Broward County population projected at +34% by 2050 — long-run rental-demand tailwind backs the buy-and-hold thesis.
Negotiation context
- Only 14 days on market — expect competitive offers; lowballing is unlikely to land.
- Current owner paid $52k; list at $295k implies a 462% gain — meaningful room to come down on a strong offer.
Risks & watch-outs
- Climate carrying-cost: severe wind risk, 99% chance of damaging wind over 30y; extreme-heat days projected 6→21/yr by 2055 (HVAC capex compounding) — expect insurance premiums to compound above CPI over the hold.
Questions for the listing agent
- Built in 1972 — when were the roof, HVAC, electrical panel, plumbing, and water heater last replaced?
- Is there a deadline driving the sale (1031 exchange, divorce, estate, relocation)? That informs how much negotiation room exists.
- Schools are D-rated, which usually means shorter tenancies and higher turnover. Who's the typical renter profile here, and what's been the actual vacancy rate?
- What's the average days-on-market for RENTAL listings here right now (not sales)? A rising rental-DOM trend means longer vacancies and softer asking-rent achievability than the comps imply.
- What's the recent tenant-quality profile in this submarket — average credit score on applications, eviction rate, late-payment / NSF rate, and stable-employment percentage? A property-management company in the area should have these aggregated.
- How much new for-sale + rental construction is in the pipeline within 1–3 miles? Heavy new supply typically softens prices + rents 12–24 months out; constrained supply supports both.
Investment metrics
- 1% rule
- 1.07% ✓
- Cap rate
- 9.14%
- Cash-on-cash
- 10.16%
- DSCR
- 1.45
- GRM
- 7.8
CMA / ARV
- ARV (on-the-fly)
- $249,828
- Comps found
- 3
Show comp detail 3 sales within ~0.75 mi
| Address | Dist | Beds/Ba | Sqft | Sold | Price | $/sf | Match |
|---|---|---|---|---|---|---|---|
| 2840 SW Cypress Dr | 0.13mi | 3/2.0 | 1,176 (-10%) | 2mo | $135,999 | $116 | 76 |
| 3220 Teakwood Ln | 0.52mi | 3/2.0 | 1,268 (-3%) | 3mo | $279,000 | $220 | 68 |
| 5608 Lagoon Dr | 0.47mi | 2/2.0 (-1) | 1,467 (+12%) | 15mo | $280,000 | $191 | 40 |
Match score weights: distance 35% · size 25% · config 20% · recency 20%. Top-matched comps best support the ARV.
Projected returns pro-forma
-3.0% appreciation · 1.3% rent growth · sell at horizon
- IRR
- -2.8%
- Equity multiple
- 0.90×
- Total profit
- $-8,650
- Equity at exit
- $43,985
- IRR
- 5.0%
- Equity multiple
- 1.34×
- Total profit
- $28,382
- Equity at exit
- $25,506
Cash invested: $82,600 (down + closing). Projections, not guarantees.
Landlord ↔ Tenant lean methodology
- Overall (STATE)
- 87 Strongly Landlord-Friendly
- State Florida
- 87 Strongly Landlord-Friendly · R+3
- County
- — inherits STATE
- City
- — inherits STATE
ZIP-level market 33312
- Rents YoY
- 1.3%
- Active inventory
- 412
- Price-to-rent
- 7.8×
Monthly cashflow live
- Estimated rent
- $3,155 high interval (Pro) →
- Mortgage (P&I)
- −$1,547
- Tax from tax record
- −$123 /mo · $1,479/yr
- Insurance
- −$123
- HOA
- −$0
- Vacancy / Maint / Mgmt
- −$663
- Net cashflow
- $700
Break-even live
UW: 25.0% down · 7.5% · 30yr · 1.5% tax · 5.0% vac · 8.0% maint · 8.0% mgmt
Financing live
Cash to close
- Down payment
- $73,750
- Closing costs
- $8,850
- Reserves months
- —
- Total cash needed
- —
Loan-product check · same deal, 3 products live
Conventional
25% down · 7.5% · 30yr
- Down + closing
- —
- Monthly P&I
- —
- Monthly cashflow
- —
- DSCR
- —
- Eligible?
- —
Personal DTI + credit; lowest rate.
DSCR
20% down · 8.5% · 30yr
- Down + closing
- —
- Monthly P&I
- —
- Monthly cashflow
- —
- DSCR
- —
- Eligible?
- —
No personal income docs; deal must DSCR.
Hard money
10% down · 12.0% · 12mo
- Down + closing
- —
- Monthly P&I
- —
- Monthly cashflow
- —
- DSCR
- —
- Eligible?
- —
Short-term bridge; refi at stabilization.
Rent comps 40 comps
| Address | Beds | Baths | Sqft | Rent | $/sqft | DOM | Units | Dist |
|---|---|---|---|---|---|---|---|---|
| 5597 Park Rd Fort Lauderdale, FL | 3.0 | 2.0 | 1038 | $3,000 | $2.89 | 24d | 1 | 0.09mi |
| 5643 Park Rd Fort Lauderdale, FL | 3.0 | 2.0 | 1284 | $3,200 | $2.49 | 24d | 1 | 0.10mi |
| 5840 Lakeshore Dr Fort Lauderdale, FL | 1.0–3.0 | 1.0–2.0 | 1056 | $3,787 | $3.59 | 2d | 31 | 0.14mi |
| 2701 SW 58th Mnr Unit B Fort Lauderdale, FL | 2.0 | 2.0 | 1292 | $2,750 | $2.13 | 20d | 1 | 0.20mi |
| 2680 SW 54th St Fort Lauderdale, FL | 3.0 | 2.0 | 1592 | $2,000 | $1.26 | 24d | 1 | 0.22mi |
| 5434 SW 25th Ave Fort Lauderdale, FL | 3.0 | 2.0 | 1318 | $3,750 | $2.85 | 24d | 1 | 0.28mi |
| 5420 SW 25th Ave Fort Lauderdale, FL | 3.0 | 2.0 | 1135 | $2,975 | $2.62 | 24d | 1 | 0.29mi |
| 3028 Lakeshore Dr Fort Lauderdale, FL | 3.0 | 2.0 | 1472 | $2,350 | $1.60 | 24d | 1 | 0.33mi |
| 5605 SW 24th Ave Fort Lauderdale, FL | 3.0 | 2.0 | 1333 | $3,500 | $2.63 | 24d | 1 | 0.34mi |
| 2460 SW 58th Mnr Fort Lauderdale, FL | 3.0 | 2.0 | 1300 | $3,400 | $2.62 | 24d | 1 | 0.34mi |
| 2460 SW 58th Mnr Unit 1-2 Fort Lauderdale, FL | 3.0 | 2.0 | 1300 | $3,300 | $2.54 | 24d | 1 | 0.34mi |
| 5741 SW 24th Ave Unit A Fort Lauderdale, FL | 3.0 | 2.0 | 1056 | $3,400 | $3.22 | 7d | 1 | 0.35mi |
| 5741 SW 24th Ave Unit A Fort Lauderdale, FL | 3.0 | 2.0 | 1056 | $3,400 | $3.22 | 2d | 1 | 0.35mi |
| 5221 SW 25th Ave Fort Lauderdale, FL | 3.0 | 2.0 | 1084 | $2,700 | $2.49 | 5d | 1 | 0.41mi |
| 5180 SW 27th Ter Fort Lauderdale, FL | 3.0 | 2.0 | 1495 | $3,000 | $2.01 | 20d | 1 | 0.43mi |
| 4125 N 32nd Ct Hollywood, FL | 2.0 | 1.0 | 1210 | $2,950 | $2.44 | 22d | 1 | 0.44mi |
| 3200 Stirling Rd Hollywood, FL | 3.0 | 2.5 | 1694 | $3,304 | $1.95 | 24d | 1 | 0.48mi |
| 5120 SW 26th Ave Unit 1-2 Fort Lauderdale, FL | 2.0 | 1.0 | 1612 | $2,100 | $1.30 | 3d | 1 | 0.49mi |
| 5120 SW 26th Ave Unit 1-2 Fort Lauderdale, FL | 2.0 | 1.0 | 1612 | $2,100 | $1.30 | 4d | 1 | 0.49mi |
| 2461 SW 50th St Fort Lauderdale, FL | 2.0 | 2.0 | 1008 | $2,300 | $2.28 | 24d | 1 | 0.52mi |
| 5201 SW 31st Ave #183 Fort Lauderdale, FL | 3.0 | 2.0 | 1412 | $2,500 | $1.77 | 24d | 1 | 0.56mi |
| 3050 Park Pl #5838 Fort Lauderdale, FL | 3.0 | 2.5 | 1854 | $3,950 | $2.13 | 24d | 1 | 0.57mi |
| 2630 SW 49th Ct Fort Lauderdale, FL | 3.0 | 3.0 | 1404 | $3,195 | $2.28 | 24d | 1 | 0.58mi |
| 5201 SW 31st Ave #195 Fort Lauderdale, FL | 2.0 | 2.0 | 1348 | $2,649 | $1.97 | 11d | 1 | 0.58mi |
| 5201 SW 31st Ave #195 Fort Lauderdale, FL | 2.0 | 2.0 | 1348 | $2,699 | $2.00 | 24d | 1 | 0.58mi |
| 5201 SW 31st Ave #195 Fort Lauderdale, FL | 2.0 | 2.0 | 1348 | $2,600 | $1.93 | 7d | 1 | 0.58mi |
| 4936 Whispering Way Unit 4936 Fort Lauderdale, FL | 3.0 | 2.5 | 1508 | $4,250 | $2.82 | 24d | 1 | 0.61mi |
| 4936 Whispering Way Fort Lauderdale, FL | 3.0 | 2.5 | 1508 | $4,150 | $2.75 | 7d | 1 | 0.61mi |
| 3100 SW 50th St Fort Lauderdale, FL | 2.0 | 1.5 | 1110 | $2,600 | $2.34 | 3d | 1 | 0.62mi |
| 2325 Mariner Ct #2809 Fort Lauderdale, FL | 3.0 | 2.5 | 1391 | $2,575 | $1.85 | 24d | 1 | 0.62mi |
| 3800 N Hills Dr Hollywood, FL | 1.0–2.0 | 1.5–2.0 | 1068 | $3,200 | $2.99 | 15d | 4 | 0.63mi |
| 3800 N Hills Dr Hollywood, FL | 1.0–2.0 | 1.5–2.0 | 1068 | $3,200 | $2.99 | 2d | 3 | 0.63mi |
| 3800 N Hills Dr Hollywood, FL | 1.0–2.0 | 1.5–2.0 | 1068 | $3,200 | $2.99 | 4d | 3 | 0.63mi |
| 4920 SW 27th Ave Fort Lauderdale, FL | 3.0 | 2.0 | 1140 | $3,500 | $3.07 | 24d | 1 | 0.63mi |
| 4920 SW 27th Ave Unit 4920 Fort Lauderdale, FL | 3.0 | 2.0 | 1140 | $3,500 | $3.07 | 4d | 1 | 0.63mi |
| 4965 Leeward Ln Fort Lauderdale, FL | 3.0 | 2.5 | 1379 | $2,750 | $1.99 | 24d | 1 | 0.63mi |
| 4961 Leeward Ln #3102 Fort Lauderdale, FL | 3.0 | 3.0 | 1382 | $2,850 | $2.06 | 11d | 1 | 0.64mi |
| 2308 Anchor Ct #2703 Fort Lauderdale, FL | 2.0 | 2.5 | 1100 | $2,200 | $2.00 | 24d | 1 | 0.64mi |
| 4964 Leeward Ln Fort Lauderdale, FL | 3.0 | 2.5 | 1400 | $3,000 | $2.14 | 24d | 1 | 0.66mi |
| 2307 Anchor Ct #4006 Fort Lauderdale, FL | 3.0 | 3.0 | 1382 | $2,700 | $1.95 | 3d | 1 | 0.66mi |
Listing history 4 events
-
2026-05-12$295,000 Active
-
2016-06-13soldstatus $52,500
-
2016-06-13soldstatus $52,500
-
1994-03-01soldstatus $40,000
ⓘ Source: listings_history table (triggers on properties + properties_extension) + one-shot
backfill from property_details.listing_events for pre-trigger history.
Tax reassessment forecast FL · Resets to sale price
- Current annual tax
- $1,479 · $123/mo
- Projected year-2 tax
- $2,448 · $204/mo
- Expected delta
- +$970/yr (+$81/mo · 65.6%)
ⓘ Screening estimate from a state-policy table — verify with the county assessor before closing.
Climate risk First Street
- Flood 1/10 Low FEMA zone X (shaded) · 0% chance over 30 yrs
- Wildfire 1/10 Low
- Heat 10/10 Extreme 6 d/yr ≥105°F today · 21 d/yr by 30 yrs out
- Wind 10/10 Extreme 99% chance of damaging wind over 30 yrs
- Air quality 2/10 Low 2 unhealthy d/yr today · 2 by 30 yrs out
Nearby sold comps map
Loading sold comps map…
Walkable amenities ~0.75 mi
Loading nearby amenities…
Taxation est. · year 1
- Rental income
- $37,866
- − Mortgage interest
- −$16,525
- − Property taxes
- −$1,479
- − Insurance
- −$1,475
- − Repairs & maintenance
- −$3,029
- − Management
- −$3,029
- − Depreciation
- −$8,582
- Taxable income
- $3,747
- Est. tax owed @ 24.0%
- −$899
- After-tax cash flow
- $7,497/yr
For passive investors: Depreciation is non-cash, so a rental often shows a tax loss while cash-flowing — sheltering income. Rental losses are passive: they offset passive income freely, and up to $25,000/yr can offset ordinary (W-2) income if you actively participate and your MAGI is under $100k (phasing out to $0 by $150k); unused losses carry forward. On sale, claimed depreciation is recaptured at up to 25%, and gains may owe capital-gains tax (a 1031 exchange can defer both). Figures are a year-1 estimate at your 24.0% rate — not tax advice; consult a CPA.
Schools (NCES district)
- District
- Broward
- NCES district ID
- 1200180
- Math proficiency
- 42% ▼ -18.00%
- Reading proficiency
- 53% ▼ -5.00%
- Median HH income
- $52,139
- Composite
- 40.88/100
- National rank
- #3621
- State rank
- #46 of 73 in FL
Livability — Dania Beach
- Score
- 77/100
- State rank
- #180
- US rank
- #2806
Category grades
Schools grade is shown separately in the Schools card above.
Census & demographics
- Census place
- Dania Beach, FL
- County
- Broward County · 1,963,430 people
- City population
- 17,094
- Metro
- Miami-Fort Lauderdale-Pompano Beach, FL
- Population (ZIP)
- 52,798
- Household income
- $75,952
- Rent vs Own
- Severe rent burden
- 1903.0
Population outlook (Broward County) Hauer SSP2
- Today (2025)
- 2,207,033 people
- By 2030
- 2,360,704 · +7.0%
- By 2040
- 2,661,208 · +20.6%
- By 2050
- 2,946,698 · +33.5%
- By 2075
- 3,602,273 · +63.2%
- By 2100
- 3,970,984 · +79.9%
Race, ethnicity, and origin ACS 2023
- Neighborhood character
- Highly diverse neighborhood (Simpson 0.70)
- Race & ethnicity
- White 34% Hispanic / Latino 32% Black 29% Two or more races 20% Asian 2%
- Hispanic origin (detail)
- Mexican 2% Puerto Rican 5% Cuban 6% Salvadoran 1%
- Common ancestry
- Hispanic 6% Romanian 3% Italian 1%
- Foreign-born
- 33% · Canada, Jamaica, Dominican Republic
- Languages at home
- 59% English-only · Spanish 29% French/Haitian/Cajun 7% Other Indo-European 2%
Political lean MEDSL · Broward
- 2024 margin
- D (+17.0) · D 58.0% · R 41.0%
- 2008→2024 swing
- -17.8pp toward R · 2008: 34.7pp · 2024: 17.0pp
- All cycles
- 2024: D+17.0 2020: D+29.8 2016: D+35.0 2012: D+34.9 2008: D+34.7
Not yet ingested
- Civics
- —
Market trends
- HPI YoY
- ▼ -323.99%
- Current HPI
- 382.6298
- Rent YoY
- ▲ 1.30%
- Metro
- Miami-Fort Lauderdale-Pompano Beach, FL
- State GDP YoY
- ▲ 3.28%
- F500 in state
- 36
Industry mix (Fortune 500 HQ in FL)
| Industry | F500 HQs | Revenue |
|---|---|---|
| Industrial Technology | 2 | $29B |
|
||
| Insurance | 2 | $17B |
|
||
| Retail | 1 | $60B |
|
||
| Technology Distribution | 1 | $58B |
|
||
| Homebuilding | 1 | $35B |
|
||
| Technology Manufacturing | 1 | $35B |
|
||
Price history
+637.5% since first listed4 events — show timeline
- 2026-05-12 Listed $295,000 FSBO.com
- 2016-06-13 Sold (Public Records) $52,500 Public Records
- 2016-06-13 Sold (Public Records) $52,500 Public Records
- 1994-03-01 Sold (Public Records) $40,000 Public Records
Property tax history
+5.5%/yrLatest (2025): $1,479 · +5.4% YoY. Source: county tax records.
Cash-flow waterfall
monthlySold comps — $/sqft
last 12 mo · ≤1 miLoading sold comps…