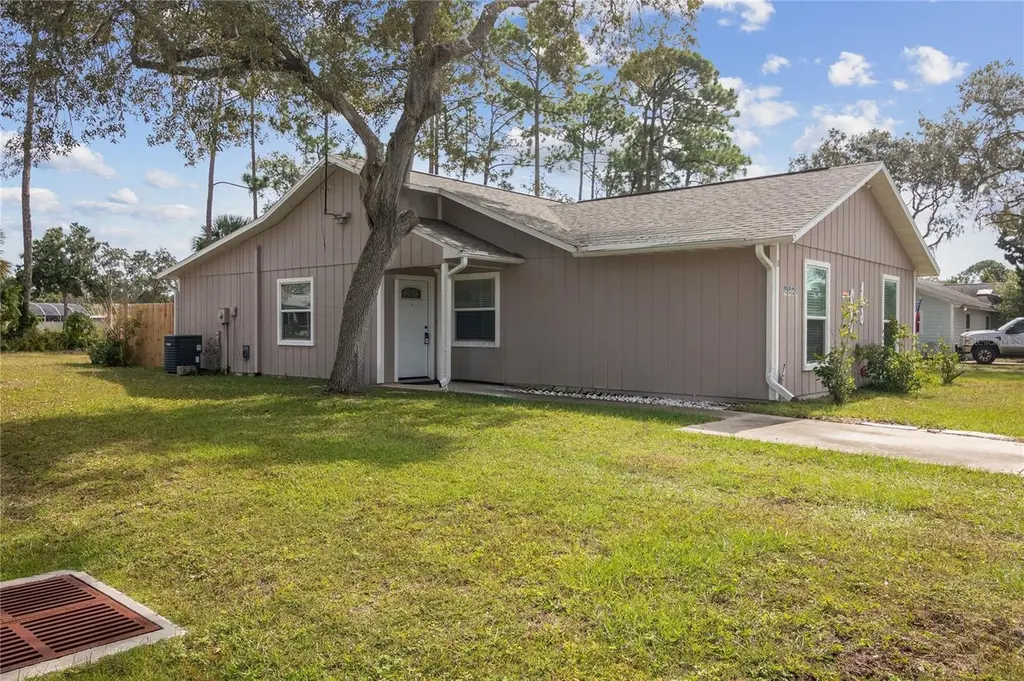
2835 Nordman Ave · New Smyrna Beach, FL
Flood risk 8/10 · Major
- FEMA flood zone
- X (shaded)
- Chance of flooding over 30 yrs
- 0.96%
- Est. flood insurance / yr
- $507 – $1,088
Fire risk 3/10 · Minor
- Est. fire insurance / yr
- $947 – $1,759
Heat risk 9/10 · Severe
- Hot days now (above 105°F)
- 7 days/yr
- Hot days in 30 yrs
- 20 days/yr
Wind risk 10/10 · Severe
- Chance of severe wind over 30 yrs
- 99.0%
Air-quality risk 2/10 · Minimal
- Unhealthy air days now
- 1 days/yr
- Unhealthy air days in 30 yrs
- 1 days/yr
Risk factors via First Street. Map © Google.
Why this score? — see what drove the D grade
The composite is a weighted blend of 9 inputs, each scored 0–100. Each bar is that input's sub-score; the figure is the points it added to the 100-point composite (weight × sub-score).
- Cash flow +14.3/30.0
- ARV discount +7.5/15.0
- DSCR +4.4/10.0
- Rent growth +3.9/5.0
- Schools +3.9/10.0
- Livability +3.5/5.0
- 1% rule +3.3/10.0
- Condition / age +2.5/5.0
- Appreciation +0.0/10.0
$275,000
🖨 Deal sheet (PDF) 📄 Offer letter ✓ Due diligence
Listing remarks MLS
Bring ALL offers!!! Nestled in the highly sought-after neighborhood of Turnbull Shores, this charming 3-bedroom, 2-bath home is the epitome of comfortable living. With its welcoming vaulted ceilings, you step into an open area creating an airy and bright ambiance. The kitchen has ample counter space and a large pantry, providing plenty of storage. The master bedroom boasts a private en-suite bathroom for your convenience. The screened-in lanai is the ideal spot for enjoying the beautiful weather while staying protected from the elements. Recent Updates: A brand-new roof, installed in 2022, ensures the property is well-maintained and ready for the years to come. Explore the local charm and enjoy the picturesque surroundings that make Islesboro a fantastic place to call home. Whether you're a first-time homebuyer, growing family, or seeking a tranquil retirement retreat, this property offers the perfect blend of comfort and style. Easy access and a short drive to shopping, restaurants, and interstate access. Three security cameras on the exterior of building with hook-up.
Key facts
- Screened-in lanai
- Brand-new roof
- Large pantry
Tags
Neighborhood map
What this means for you Summary
Snapshot
- This is a 3-bed/2.0-bath single-family listed at $275k.
Deal economics
- At list price, monthly cash flow is $-15 ($-178/yr) — negative.
- To cash-flow at today's rent, offer at most $272k (1.0% below list).
- To meet the 1% rule (rent ≥ 1% of price), the offer needs to be $229k (16.7% below list).
- Recommended offer: $229k (16.7% below list) — sets the bar for 1% rule.
Location & tenants
- Location reads 69/100 on livability (#474 in FL) — a middle-class / working-renter tenant base. Strengths: crime A+, housing A+, employment B; Watch: amenities F, commute F, health & safety D-.
- Volusia (suburban): math 44% / reading 49% proficiency, ranked #47 of 73 in FL (top 64%) — families likely to look elsewhere, expect single-tenant / working-renter base with shorter leases.
- Zoned schools: Chisholm Elementary School (math 72% / reading 63%, grade B+, #435 of 2,144 statewide, top 21%, 491 students, 47% FRL); New Smyrna Beach Middle School (math 43% / reading 43%, grade D-, #331 of 571 statewide, top 59%, 1,037 students, 53% FRL); New Smyrna Beach High School (math 34% / reading 52%, grade F, #255 of 667 statewide, top 39%, 1,810 students, 41% FRL) — zoned schools at 47% FRL track the district average.
- Market conditions: Rents rising fast (+5.6%/yr); 607 active listings in the ZIP; 3 comparable units currently listed for rent nearby; rentals at typical pace (median 16d on market — plan ~3-4 weeks tenant-placement turnaround); solid renter incomes; 3,402 units permitted in Volusia County in 2024 (681 in 5+ unit buildings).
- This rent runs 36% of the median local income ($77k/yr) — at the standard rent-burdened threshold; future hikes will face affordability resistance.
Forward outlook
- Local home prices are declining (-3.0%/yr); year-one equity from $2k of loan paydown is wiped out by about $8k of value loss. Plan a longer hold.
- Volusia County population projected at +19% by 2050 — long-run rental-demand tailwind backs the buy-and-hold thesis.
Negotiation context
- It's been on market 235 days — a 12% lower offer ($242k) is reasonable based on typical stale-listing flexibility.
- 10 sale attempts since 23y ago; this cycle's ask has dropped $19k (6%) from the opening price — seller is motivated, your offer sets the floor, not the list.
- Current owner paid $124k; list at $275k implies a 122% gain — meaningful room to come down on a strong offer.
Risks & watch-outs
- Watch-outs: flood insurance adds $66/mo.
- Climate carrying-cost: severe flood risk; severe wind risk, 99% chance of damaging wind over 30y; extreme-heat days projected 7→20/yr by 2055 (HVAC capex compounding) — expect insurance premiums to compound above CPI over the hold.
Questions for the listing agent
- What do current leases actually rent for vs. the listed asking? Can we see a recent rent roll and the last 12 months of T-12 income?
- It's been on market 235 days. Have you received any prior offers? Is the seller open to a 17% concession, seller financing, or rate buy-down credit?
- What's the actual annual flood-insurance premium (NFIP or private), and is the property in a SFHA with mandatory coverage?
- Why hasn't it sold? Are there any deal-killer items the seller is aware of (foundation, flood, title, zoning, code violations)?
- Is there a deadline driving the sale (1031 exchange, divorce, estate, relocation)? That informs how much negotiation room exists.
- Schools are B-rated — typically a magnet for longer-tenancy family renters. What's the average tenant stay here, and is there a school-zone premium baked into asking?
- The area grade is low — what's the realistic commute time and amenity access for the typical tenant pool here? Any planned neighborhood developments (good or bad) we should know about?
- What's the average days-on-market for RENTAL listings here right now (not sales)? A rising rental-DOM trend means longer vacancies and softer asking-rent achievability than the comps imply.
- What's the recent tenant-quality profile in this submarket — average credit score on applications, eviction rate, late-payment / NSF rate, and stable-employment percentage? A property-management company in the area should have these aggregated.
- How much new for-sale + rental construction is in the pipeline within 1–3 miles? Heavy new supply typically softens prices + rents 12–24 months out; constrained supply supports both.
Investment metrics
- 1% rule
- 0.83% ✗
- Cap rate
- 6.52%
- Cash-on-cash
- 0.81%
- DSCR
- 1.04
- GRM
- 10.0
CMA / ARV
No comps found within radius.
Projected returns pro-forma
-3.0% appreciation · 5.6% rent growth · sell at horizon
- IRR
- -13.9%
- Equity multiple
- 0.49×
- Total profit
- $-39,373
- Equity at exit
- $41,003
- IRR
- -1.5%
- Equity multiple
- 0.88×
- Total profit
- $-8,955
- Equity at exit
- $23,777
Cash invested: $77,000 (down + closing). Projections, not guarantees.
Landlord ↔ Tenant lean methodology
- Overall (STATE)
- 87 Strongly Landlord-Friendly
- State Florida
- 87 Strongly Landlord-Friendly · R+3
- County
- — inherits STATE
- City
- — inherits STATE
ZIP-level market 32168
- Home prices YoY
- -27.0%
- Rents YoY
- 5.6%
- Active inventory
- 607
- Price-to-rent
- 10.0×
Monthly cashflow live
- Estimated rent
- $2,289 medium interval (Pro) →
- Mortgage (P&I)
- −$1,442
- Tax from tax record
- −$200 /mo · $2,403/yr
- Insurance
- −$115
- Flood insurance flood zone
- −$66 /mo · $798/yr
- HOA
- −$0
- Vacancy / Maint / Mgmt
- −$481
- Net cashflow
- $-15
Break-even live
Sensitivity live
| Price | -10% $141 | -5% $63 | +0% $-15 | +5% $-93 | +10% $-170 |
|---|---|---|---|---|---|
| Rent | -10% $-196 | -5% $-105 | +0% $-15 | +5% $76 | +10% $166 |
| Rate | -1.0pp $124 | -0.5pp $55 | base $-15 | +0.5pp $-86 | +1.0pp $-159 |
UW: 25.0% down · 7.5% · 30yr · 1.5% tax · 5.0% vac · 8.0% maint · 8.0% mgmt
Financing live
Cash to close
- Down payment
- $68,750
- Closing costs
- $8,250
- Reserves months
- —
- Total cash needed
- —
Loan-product check · same deal, 3 products live
Conventional
25% down · 7.5% · 30yr
- Down + closing
- —
- Monthly P&I
- —
- Monthly cashflow
- —
- DSCR
- —
- Eligible?
- —
Personal DTI + credit; lowest rate.
DSCR
20% down · 8.5% · 30yr
- Down + closing
- —
- Monthly P&I
- —
- Monthly cashflow
- —
- DSCR
- —
- Eligible?
- —
No personal income docs; deal must DSCR.
Hard money
10% down · 12.0% · 12mo
- Down + closing
- —
- Monthly P&I
- —
- Monthly cashflow
- —
- DSCR
- —
- Eligible?
- —
Short-term bridge; refi at stabilization.
Rent comps 3 comps
| Address | Beds | Baths | Sqft | Rent | $/sqft | DOM | Units | Dist |
|---|---|---|---|---|---|---|---|---|
| 2829 Nordman Ave New Smyrna Beach, FL | 3.0 | 2.0 | 1363 | $2,000 | $1.47 | 16d | 1 | 0.05mi |
| 1007 Conrad Dr New Smyrna Beach, FL | 2.0 | 2.0 | 1100 | $2,400 | $2.18 | 25d | 1 | 0.50mi |
| 603 Conrad Dr New Smyrna Beach, FL | 3.0 | 2.0 | 1206 | $2,100 | $1.74 | 16d | 1 | 0.53mi |
Listing history 50 events
-
2026-06-22days on market $275,000 Active 235 DOM
-
2026-06-18days on market $275,000 Active 232 DOM
-
2026-06-17days on market $275,000 Active 231 DOM
-
2026-06-16days on market $275,000 Active 230 DOM
-
2026-06-15days on market $275,000 Active 229 DOM
-
2026-06-14days on market $275,000 Active 227 DOM
-
2026-06-10days on market $275,000 Active 224 DOM
-
2026-06-09days on market $275,000 Active 223 DOM
-
2026-06-08days on market $275,000 Active 222 DOM
-
2026-06-07days on market $275,000 Active 221 DOM
-
2026-06-05days on market $275,000 Active 218 DOM
-
2026-06-03days on market $275,000 Active 217 DOM
-
2026-06-03days on market $275,000 Active 216 DOM
-
2026-06-01days on market $275,000 Active 215 DOM
-
2026-05-31days on market $275,000 Active 214 DOM
-
2026-05-31days on market $275,000 Active 213 DOM
-
2026-03-25price $275,000 1087-char remark
Show marketing remark (1087 chars)
Bring ALL offers!!! Nestled in the highly sought-after neighborhood of Turnbull Shores, this charming 3-bedroom, 2-bath home is the epitome of comfortable living. With its welcoming vaulted ceilings, you step into an open area creating an airy and bright ambiance. The kitchen has ample counter space and a large pantry, providing plenty of storage. The master bedroom boasts a private en-suite bathroom for your convenience. The screened-in lanai is the ideal spot for enjoying the beautiful weather while staying protected from the elements. Recent Updates: A brand-new roof, installed in 2022, ensures the property is well-maintained and ready for the years to come. Explore the local charm and enjoy the picturesque surroundings that make Islesboro a fantastic place to call home. Whether you're a first-time homebuyer, growing family, or seeking a tranquil retirement retreat, this property offers the perfect blend of comfort and style. Easy access and a short drive to shopping, restaurants, and interstate access. Three security cameras on the exterior of building with hook-up.
-
2025-10-29$294,000 Active 1087-char remark
Show marketing remark (1087 chars)
Bring ALL offers!!! Nestled in the highly sought-after neighborhood of Turnbull Shores, this charming 3-bedroom, 2-bath home is the epitome of comfortable living. With its welcoming vaulted ceilings, you step into an open area creating an airy and bright ambiance. The kitchen has ample counter space and a large pantry, providing plenty of storage. The master bedroom boasts a private en-suite bathroom for your convenience. The screened-in lanai is the ideal spot for enjoying the beautiful weather while staying protected from the elements. Recent Updates: A brand-new roof, installed in 2022, ensures the property is well-maintained and ready for the years to come. Explore the local charm and enjoy the picturesque surroundings that make Islesboro a fantastic place to call home. Whether you're a first-time homebuyer, growing family, or seeking a tranquil retirement retreat, this property offers the perfect blend of comfort and style. Easy access and a short drive to shopping, restaurants, and interstate access. Three security cameras on the exterior of building with hook-up.
-
2025-08-29historical
-
2025-08-29historical
-
2025-05-13price $294,000
-
2025-05-13price $294,000
-
2025-01-16price $299,000
-
2025-01-16price $299,000
-
2024-07-31historical
-
2024-06-04price $315,000
-
2024-06-04price $299,999
-
2024-06-04price $315,000
-
2024-06-04price $315,000
-
2024-06-04price $299,999
-
2024-06-04price $299,999
-
2024-02-19price $315,000
-
2024-02-19price $315,000
-
2024-02-19price $315,000
-
2023-10-24price $325,000
-
2023-10-24$32,500 Active
-
2023-10-24$325,000 Active
-
2023-10-24$325,000 Active
-
2018-06-18soldstatus $124,000
-
2011-12-28soldstatus $50,000
-
2011-12-28soldstatus $50,000
-
2011-12-28soldstatus $50,000
-
2011-12-07historical
-
2011-11-24$54,900
-
2011-11-24$54,900
-
2011-11-22$54,900
-
2004-09-28soldstatus $115,000
-
2004-09-16soldstatus $115,000
-
2004-09-16soldstatus $115,000
-
2004-06-28$119,900
ⓘ Source: listings_history table (triggers on properties + properties_extension) + one-shot
backfill from property_details.listing_events for pre-trigger history.
Tax reassessment forecast FL · Resets to sale price
- Current annual tax
- $2,403 · $200/mo
- Projected year-2 tax
- $2,403 · $200/mo
- Expected delta
- $0/yr ($0/mo · 0.0%)
ⓘ Screening estimate from a state-policy table — verify with the county assessor before closing.
Climate risk First Street
- Flood 8/10 Severe FEMA zone X (shaded) · 96% chance over 30 yrs
- Wildfire 3/10 Moderate
- Heat 9/10 Extreme 7 d/yr ≥105°F today · 20 d/yr by 30 yrs out
- Wind 10/10 Extreme 99% chance of damaging wind over 30 yrs
- Air quality 2/10 Low 1 unhealthy d/yr today · 1 by 30 yrs out
Nearby sold comps map
Loading sold comps map…
Walkable amenities ~0.75 mi
Loading nearby amenities…
Taxation est. · year 1
- Rental income
- $27,473
- − Mortgage interest
- −$15,404
- − Property taxes
- −$2,403
- − Insurance
- −$2,172
- − Repairs & maintenance
- −$2,198
- − Management
- −$2,198
- − Depreciation
- −$8,000
- Taxable loss
- −$4,903
- Est. tax savings @ 24.0%
- +$1,177
- After-tax cash flow
- $999/yr
For passive investors: Depreciation is non-cash, so a rental often shows a tax loss while cash-flowing — sheltering income. Rental losses are passive: they offset passive income freely, and up to $25,000/yr can offset ordinary (W-2) income if you actively participate and your MAGI is under $100k (phasing out to $0 by $150k); unused losses carry forward. On sale, claimed depreciation is recaptured at up to 25%, and gains may owe capital-gains tax (a 1031 exchange can defer both). Figures are a year-1 estimate at your 24.0% rate — not tax advice; consult a CPA.
Schools (NCES district)
- District
- Volusia
- NCES district ID
- 1201920
- Math proficiency
- 44% ▼ -9.00%
- Reading proficiency
- 49% ▼ -3.00%
- Median HH income
- $42,946
- Composite
- 39.2/100
- National rank
- #4019
- State rank
- #47 of 73 in FL
Livability — New Smyrna Beach
- Score
- 69/100
- State rank
- #474
- US rank
- #8577
Category grades
Schools grade is shown separately in the Schools card above.
Census & demographics
- Census place
- New Smyrna Beach, FL
- County
- Volusia County · 556,871 people
- City population
- 42,039
- Metro
- Deltona-Daytona Beach-Ormond Beach, FL
- Population (ZIP)
- 31,847
- Household income
- $77,083
- Rent vs Own
- Severe rent burden
- 1139.0
Population outlook (Volusia County) Hauer SSP2
- Today (2025)
- 572,749 people
- By 2030
- 598,695 · +4.5%
- By 2040
- 644,880 · +12.6%
- By 2050
- 681,451 · +19.0%
- By 2075
- 759,957 · +32.7%
- By 2100
- 778,902 · +36.0%
Race, ethnicity, and origin ACS 2023
- Neighborhood character
- Predominantly White (85%)
- Race & ethnicity
- White 85% Hispanic / Latino 6% Black 5% Two or more races 4%
- Hispanic origin (detail)
- Mexican 2% Puerto Rican 1%
- Common ancestry
- Romanian 4% Italian 3% Lithuanian 2%
- Foreign-born
- 5% · Canada, Vietnam
- Languages at home
- 93% English-only · Spanish 5% Other Indo-European 1%
Political lean MEDSL · Volusia
- 2024 margin
- Strong R (+21.8) · D 38.7% · R 60.5%
- 2008→2024 swing
- -27.4pp toward R · 2008: 5.7pp · 2024: -21.8pp
- All cycles
- 2024: R+21.8 2020: R+14.1 2016: R+13.1 2012: R+1.2 2008: D+5.7
Not yet ingested
- Civics
- —
Market trends
- HPI YoY
- ▼ -129.58%
- Current HPI
- 350.4259
- Rent YoY
- ▲ 5.60%
- Metro
- Deltona-Daytona Beach-Ormond Beach, FL
- State GDP YoY
- ▲ 3.28%
- F500 in state
- 36
Industry mix (Fortune 500 HQ in FL)
| Industry | F500 HQs | Revenue |
|---|---|---|
| Industrial Technology | 2 | $29B |
|
||
| Insurance | 2 | $17B |
|
||
| Retail | 1 | $60B |
|
||
| Technology Distribution | 1 | $58B |
|
||
| Homebuilding | 1 | $35B |
|
||
| Technology Manufacturing | 1 | $35B |
|
||
Price history
+218.7% since first listed40 events — show timeline
- 2026-03-25 Price Changed $275,000 Stellar MLS as Distributed by MLS Grid
- 2025-10-29 Listed $294,000 Stellar MLS as Distributed by MLS Grid
- 2025-08-29 Listing Removed — Daytona MLS
- 2025-08-29 Listing Removed — Stellar MLS as Distributed by MLS Grid
- 2025-05-13 Price Changed $294,000 Daytona MLS
- 2025-05-13 Price Changed $294,000 Stellar MLS as Distributed by MLS Grid
- 2025-01-16 Price Changed $299,000 Daytona MLS
- 2025-01-16 Price Changed $299,000 Stellar MLS as Distributed by MLS Grid
- 2024-07-31 Listing Removed — SCMLS
- 2024-06-04 Price Changed $315,000 Daytona MLS
- 2024-06-04 Price Changed $299,999 Daytona MLS
- 2024-06-04 Price Changed $315,000 Stellar MLS as Distributed by MLS Grid
- 2024-06-04 Price Changed $315,000 SCMLS
- 2024-06-04 Price Changed $299,999 SCMLS
- 2024-06-04 Price Changed $299,999 Stellar MLS as Distributed by MLS Grid
- 2024-02-19 Price Changed $315,000 Daytona MLS
- 2024-02-19 Price Changed $315,000 SCMLS
- 2024-02-19 Price Changed $315,000 Stellar MLS as Distributed by MLS Grid
- 2023-10-24 Price Changed $325,000 Stellar MLS as Distributed by MLS Grid
- 2023-10-24 Listed $325,000 SCMLS
- 2023-10-24 Listed $325,000 Daytona MLS
- 2023-10-24 Listed $32,500 Stellar MLS as Distributed by MLS Grid
- 2018-06-18 Sold (Public Records) $124,000 Public Records
- 2011-12-28 Sold (MLS) $50,000 NSBMLS
- 2011-12-28 Sold (MLS) $50,000 Stellar MLS as Distributed by MLS Grid
- 2011-12-28 Sold (MLS) $50,000 Stellar MLS as Distributed by MLS Grid
- 2011-12-07 Listing Removed — Stellar MLS as Distributed by MLS Grid
- 2011-11-24 Listed $54,900 NSBMLS
- 2011-11-24 Listed $54,900 Stellar MLS as Distributed by MLS Grid
- 2011-11-22 Listed $54,900 Stellar MLS as Distributed by MLS Grid
- 2004-09-28 Sold (Public Records) $115,000 Public Records
- 2004-09-16 Sold (MLS) $115,000 NSBMLS
- 2004-09-16 Sold (MLS) $115,000 Stellar MLS as Distributed by MLS Grid
- 2004-06-28 Listed $119,900 NSBMLS
- 2004-06-28 Listed $119,900 Stellar MLS as Distributed by MLS Grid
- 2003-10-28 Sold (MLS) $55,000 Daytona MLS
- 2003-09-08 Listed $74,900 Daytona MLS
- 1993-06-09 Sold (Public Records) $72,000 Public Records
- 1990-01-01 Sold (Public Records) $80,000 Public Records
- 1983-05-01 Sold (Public Records) $86,300 Public Records
Property tax history
+11.6%/yrLatest (2025): $2,403 · +1.1% YoY. Source: county tax records.
Cash-flow waterfall
monthlySold comps — $/sqft
last 12 mo · ≤1 miLoading sold comps…