13510 202nd St E · Graham, WA
Flood risk 1/10 · Minimal
- FEMA flood zone
- X (unshaded)
- Chance of flooding over 30 yrs
- 0.0%
- Est. flood insurance / yr
- $507 – $1,088
Fire risk 3/10 · Minor
- Est. fire insurance / yr
- $604 – $1,122
Heat risk 2/10 · Minimal
- Hot days now (above 87°F)
- 7 days/yr
- Hot days in 30 yrs
- 14 days/yr
Wind risk 1/10 · Minimal
- Chance of severe wind over 30 yrs
- —
Air-quality risk 7/10 · Major
- Unhealthy air days now
- 10 days/yr
- Unhealthy air days in 30 yrs
- 10 days/yr
Risk factors via First Street. Map © Google.
Why this score? — see what drove the B grade
The composite is a weighted blend of 9 inputs, each scored 0–100. Each bar is that input's sub-score; the figure is the points it added to the 100-point composite (weight × sub-score).
- Cash flow +30.0/30.0
- 1% rule +10.0/10.0
- DSCR +10.0/10.0
- ARV discount +7.5/15.0
- Schools +4.5/10.0
- Condition / age +3.8/5.0
- Rent growth +3.3/5.0
- Livability +3.2/5.0
- Appreciation +0.0/10.0
$74,900
🖨 Deal sheet 📄 Offer letter ✓ Due diligence
Listing remarks
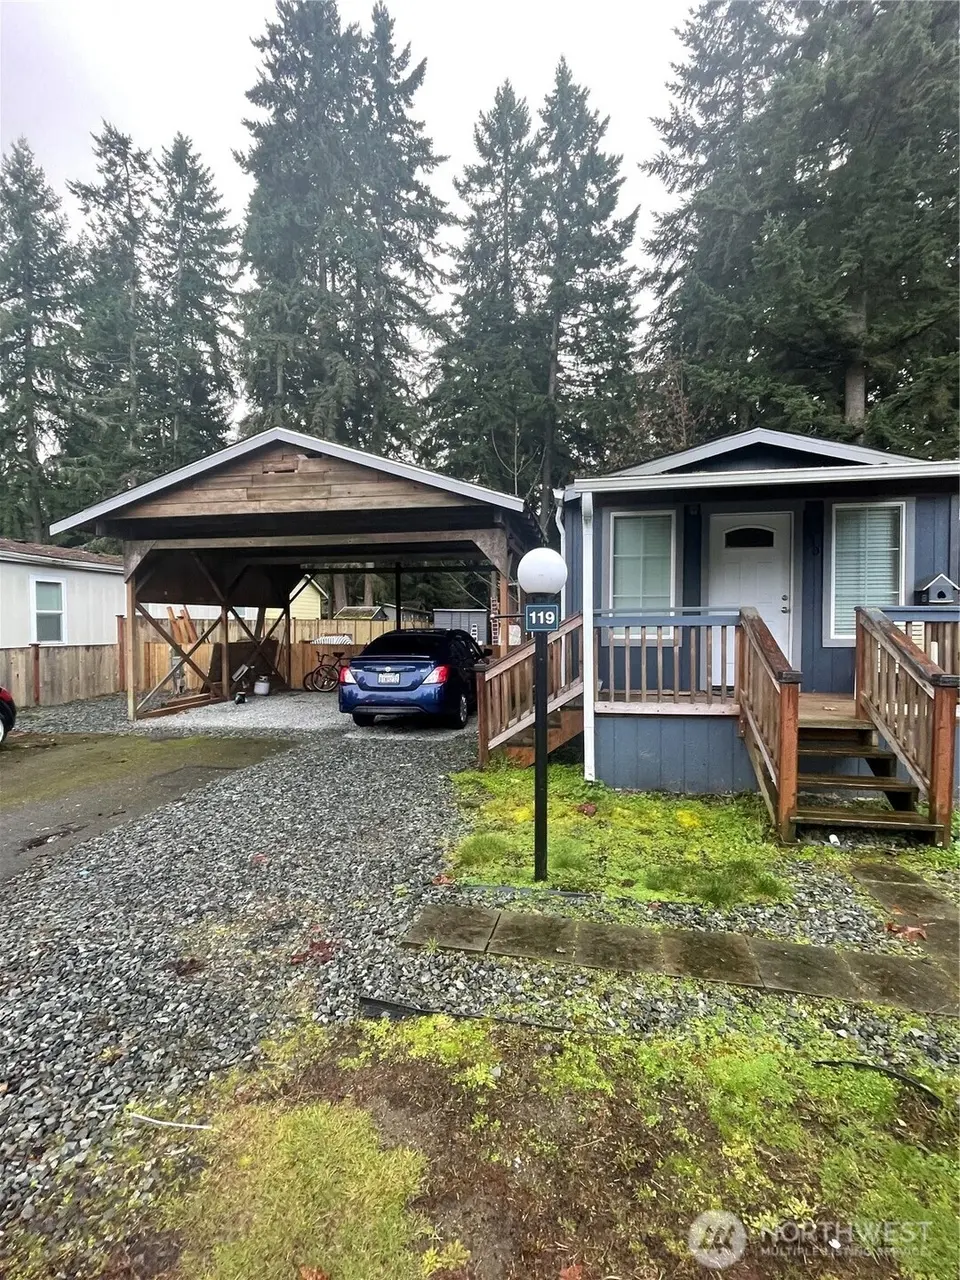
Welcome home to this beautifully updated and move-in-ready 2-bedroom, 2-bath manufactured home nestled in a peaceful, well-maintained community. Rarely available, this property features its own generously sized lot with a private, fully fenced yard—offering a level of outdoor space and privacy that's hard to find in park living. Step inside and discover a stunning new kitchen designed to impress, featuring elegant quartz countertops, a full tile backsplash, stainless steel appliances, and abundant cabinetry. Fresh flooring throughout adds a modern touch, while the remodeled bathroom showcases a stylish tile walk-in shower for everyday comfort and convenience. Whether you're a first-ti
Key facts
- Quartz counters
- New kitchen
- Fully fenced
Tags
Neighborhood map
What this means for you Summary
Snapshot
- This is a 2-bed/2.0-bath manufactured listed at $75k. Condition is rated good.
Deal economics
- At list price, monthly cash flow is $1k ($15k/yr) — positive.
- The deal already cash-flows at list — no discount required.
- Meets the 1% rule at list price ($2k rent vs $75k).
- Recommended offer: $68k (9.0% below list) — sets the bar for market timing.
- Cap rate 26.8% vs local median 3.6% in Graham — top-decile yield for the area; either an underpriced asset or a hidden risk that comps aren't pricing in. Stress-test before assuming the spread holds.
Location & tenants
- Location reads 64/100 on livability (#373 in WA) — a middle-class / working-renter tenant base. Strengths: employment A+, housing A+; Watch: crime C-, health & safety C-, amenities F.
- Orting School District (suburban): math 40% / reading 56% proficiency, ranked #142 of 291 in WA (top 49%) — families likely to look elsewhere, expect single-tenant / working-renter base with shorter leases.
- Market conditions: Rents rising (+3.3%/yr); 232 active listings in the ZIP; 1 comparable units currently listed for rent nearby; high-income renter base; 3,209 units permitted in Pierce County in 2024 (1,269 in 5+ unit buildings).
Forward outlook
- Local home prices are declining (-3.0%/yr); year-one equity from $518 of loan paydown is wiped out by about $2k of value loss. Plan a longer hold.
- Pierce County population projected at +26% by 2050 — long-run rental-demand tailwind backs the buy-and-hold thesis.
- At projected returns (-3.0% appreciation + 3.3% rent growth), your $21k cash investment doubles in ~2 years — after that, you're playing with house money.
Negotiation context
- It's been on market 104 days — a 9% lower offer ($68k) is reasonable based on typical stale-listing flexibility.
Questions for the listing agent
- It's been on market 104 days. Have you received any prior offers? Is the seller open to a 9% concession, seller financing, or rate buy-down credit?
- Why hasn't it sold? Are there any deal-killer items the seller is aware of (foundation, flood, title, zoning, code violations)?
- Is there a deadline driving the sale (1031 exchange, divorce, estate, relocation)? That informs how much negotiation room exists.
- What's the average days-on-market for RENTAL listings here right now (not sales)? A rising rental-DOM trend means longer vacancies and softer asking-rent achievability than the comps imply.
- What's the recent tenant-quality profile in this submarket — average credit score on applications, eviction rate, late-payment / NSF rate, and stable-employment percentage? A property-management company in the area should have these aggregated.
- How much new for-sale + rental construction is in the pipeline within 1–3 miles? Heavy new supply typically softens prices + rents 12–24 months out; constrained supply supports both.
Investment metrics
- 1% rule
- 3.04% ✓
- Cap rate
- 26.83%
- Cash-on-cash
- 73.35%
- DSCR
- 4.26
- GRM
- 2.7
CMA / ARV
- ARV (median comp)
- $290,500
- List price
- $74,900
- Delta
- -74.22%
- Verdict
- UNDERPRICED
- Comps
- 2 within 1.0 mi
Show comp detail 4 sales within ~0.75 mi
| Address | Dist | Beds/Ba | Sqft | Sold | Price | $/sf | Match |
|---|---|---|---|---|---|---|---|
| 20517 135th Ave E Spc 6 | 0.21mi | 2/2.0 | 924 (-2%) | 14mo | $70,000 | $76 | 76 |
| 13605 200th Street Ct E #77 | 0.13mi | 2/1.0 | 925 (-1%) | 15mo | $48,500 | $52 | 75 |
| 21215 Orting Kapowsin Hwy E | 0.64mi | 2/1.0 | 912 (-3%) | 2mo | $425,000 | $466 | 60 |
| 20204 135th Ave E #45 | 0.05mi | 3/2.0 (+1) | 1,026 (+9%) | 24mo | $115,000 | $112 | 57 |
Match score weights: distance 35% · size 25% · config 20% · recency 20%. Top-matched comps best support the ARV.
Projected returns pro-forma
-3.0% appreciation · 3.32% rent growth · sell at horizon
- IRR
- 73.5%
- Equity multiple
- 4.35×
- Total profit
- $70,283
- Equity at exit
- $11,168
- IRR
- 77.4%
- Equity multiple
- 9.08×
- Total profit
- $169,517
- Equity at exit
- $6,476
Cash invested: $20,972 (down + closing). Projections, not guarantees.
Landlord ↔ Tenant lean methodology
- Overall (STATE)
- 28 Tenant-Leaning
- State Washington
- 28 Tenant-Leaning · D+8
- County
- — inherits STATE
- City
- — inherits STATE
ZIP-level market 98338
- Rents YoY
- 3.3%
- Active inventory
- 232
- Price-to-rent
- 2.7×
Monthly cashflow live
- Estimated rent
- $2,278 medium interval (Pro) →
- Mortgage (P&I)
- −$393
- Tax est. 1.5%
- −$94 /mo · $1,124/yr
- Insurance
- −$31
- HOA
- −$0
- Vacancy / Maint / Mgmt
- −$478
- Net cashflow
- $1,282
Break-even live
UW: 25.0% down · 7.5% · 30yr · 1.5% tax · 5.0% vac · 8.0% maint · 8.0% mgmt
Financing live
Cash to close
- Down payment
- $18,725
- Closing costs
- $2,247
- Reserves months
- —
- Total cash needed
- —
Loan-product check · same deal, 3 products live
Conventional
25% down · 7.5% · 30yr
- Down + closing
- —
- Monthly P&I
- —
- Monthly cashflow
- —
- DSCR
- —
- Eligible?
- —
Personal DTI + credit; lowest rate.
DSCR
20% down · 8.5% · 30yr
- Down + closing
- —
- Monthly P&I
- —
- Monthly cashflow
- —
- DSCR
- —
- Eligible?
- —
No personal income docs; deal must DSCR.
Hard money
10% down · 12.0% · 12mo
- Down + closing
- —
- Monthly P&I
- —
- Monthly cashflow
- —
- DSCR
- —
- Eligible?
- —
Short-term bridge; refi at stabilization.
Rent comps 1 comps
| Address | Beds | Baths | Sqft | Rent | $/sqft | DOM | Units | Dist |
|---|---|---|---|---|---|---|---|---|
| 14025 198th St E Graham, WA | 3.0 | 2.0 | 1047 | $2,795 | $2.67 | 1d | 1 | 0.45mi |
Listing history 17 events
-
2026-06-18days on market $74,900 Active 104 DOM
-
2026-06-17days on market $74,900 Active 103 DOM
-
2026-06-16days on market $74,900 Active 102 DOM
-
2026-06-15days on market $74,900 Active 101 DOM
-
2026-06-13days on market $74,900 Active 99 DOM
-
2026-06-13days on market $74,900 Active 98 DOM
-
2026-06-09days on market $74,900 Active 95 DOM
-
2026-06-08days on market $74,900 Active 94 DOM
-
2026-06-07remarks 693-char remark
-
2026-06-07pricedays on market $74,900 Active 93 DOM
-
2026-06-04days on market $79,900 Active 90 DOM
-
2026-06-03days on market $79,900 Active 89 DOM
-
2026-06-02days on market $79,900 Active 88 DOM
-
2026-06-01days on market $79,900 Active 87 DOM
-
2026-05-31days on market $79,900 Active 86 DOM
-
2026-05-01price $79,900
-
2026-03-06$85,000 Active
ⓘ Source: listings_history table (triggers on properties + properties_extension) + one-shot
backfill from property_details.listing_events for pre-trigger history.
Climate risk First Street
- Flood 1/10 Low FEMA zone X (unshaded) · 0% chance over 30 yrs
- Wildfire 3/10 Moderate
- Heat 2/10 Low 7 d/yr ≥87°F today · 14 d/yr by 30 yrs out
- Wind 1/10 Low
- Air quality 7/10 Severe 10 unhealthy d/yr today · 10 by 30 yrs out
Nearby sold comps map
Loading sold comps map…
Walkable amenities ~0.75 mi
Loading nearby amenities…
Taxation est. · year 1
- Rental income
- $27,336
- − Mortgage interest
- −$4,196
- − Property taxes
- −$1,124
- − Insurance
- −$374
- − Repairs & maintenance
- −$2,187
- − Management
- −$2,187
- − Depreciation
- −$2,179
- Taxable income
- $15,089
- Est. tax owed @ 24.0%
- −$3,621
- After-tax cash flow
- $11,762/yr
For passive investors: Depreciation is non-cash, so a rental often shows a tax loss while cash-flowing — sheltering income. Rental losses are passive: they offset passive income freely, and up to $25,000/yr can offset ordinary (W-2) income if you actively participate and your MAGI is under $100k (phasing out to $0 by $150k); unused losses carry forward. On sale, claimed depreciation is recaptured at up to 25%, and gains may owe capital-gains tax (a 1031 exchange can defer both). Figures are a year-1 estimate at your 24.0% rate — not tax advice; consult a CPA.
Condition & rehab AI · 12 photos
This beautifully updated 2-bedroom, 2-bath manufactured home is move-in ready and offers a rare private, fully fenced yard on its own generously sized lot.
Value-add opportunities
- Both paint exterior — enhances curb appeal and resale value
- Both landscaping — improves curb appeal and rental value
- Both replace blinds — modernizes look and improves energy efficiency
Renovation cost estimate screening
Value-add ROI direction
- Both paint exterior — enhances curb appeal and resale value ↑
- Both landscaping — improves curb appeal and rental value ↑
- Both replace blinds — modernizes look and improves energy efficiency ↑
ⓘ Cost ranges are severity-bucket heuristics (US national rule-of-thumb). Get contractor quotes + a written scope before underwriting a rehab budget.
Schools (NCES district)
- District
- Orting School District
- NCES district ID
- 5306450
- Math proficiency
- 40% ▬ 0.00%
- Reading proficiency
- 56% ▬ 0.00%
- Median HH income
- $72,768
- Composite
- 45.37/100
- National rank
- #5719
- State rank
- #142 of 291 in WA
Livability — Graham
- Score
- 64/100
- State rank
- #373
- US rank
- #14219
Category grades
Schools grade is shown separately in the Schools card above.
Census & demographics
- Census place
- Graham, WA
- County
- Pierce County · 788,257 people
- City population
- 32,687
- Metro
- Seattle-Tacoma-Bellevue, WA
- Population (ZIP)
- 32,687
- Household income
- $114,819
- Rent vs Own
- Severe rent burden
- 236.0
Population outlook (Pierce County) Hauer SSP2
- Today (2025)
- 956,648 people
- By 2030
- 1,010,862 · +5.7%
- By 2040
- 1,113,170 · +16.4%
- By 2050
- 1,206,524 · +26.1%
- By 2075
- 1,436,425 · +50.2%
- By 2100
- 1,563,654 · +63.5%
Race, ethnicity, and origin ACS 2023
- Neighborhood character
- Predominantly White (71%)
- Race & ethnicity
- White 71% Two or more races 15% Hispanic / Latino 12% Asian 3% Black 3% Pacific Islander 2% Native American 1%
- Hispanic origin (detail)
- Mexican 7%
- Common ancestry
- Italian 4% Portuguese 4% Iranian 3%
- Foreign-born
- 7% · Canada, South Korea, China
- Languages at home
- 88% English-only · Spanish 5% Russian/Polish/Slavic 2% Other Asian/Pacific 1%
Political lean MEDSL · Pierce
- 2024 margin
- D (+10.8) · D 53.9% · R 43.1% · Other 3.0%
- 2008→2024 swing
- -1.4pp toward R · 2008: 12.2pp · 2024: 10.8pp
- All cycles
- 2024: D+10.8 2020: D+11.2 2016: D+7.5 2012: D+11.0 2008: D+12.2
Not yet ingested
- Civics
- —
Market trends
- HPI YoY
- ▼ -501.28%
- Current HPI
- 304.4241
- Rent YoY
- ▲ 3.32%
- Metro
- Seattle-Tacoma-Bellevue, WA
- State GDP YoY
- ▲ 4.65%
- F500 in state
- 22
Industry mix (Fortune 500 HQ in WA)
| Industry | F500 HQs | Revenue |
|---|---|---|
| Retail | 2 | $269B |
|
||
| Technology / Retail | 1 | $638B |
|
||
| Technology | 1 | $245B |
|
||
| Telecommunications | 1 | $38B |
|
||
| Food / Beverage | 1 | $36B |
|
||
| Automotive / Trucks | 1 | $34B |
|
||
Price history
-6.0% since first listed2 events — show timeline
- 2026-05-01 Price Changed $79,900 NWMLS as Distributed by MLS Grid
- 2026-03-06 Listed $85,000 NWMLS as Distributed by MLS Grid
Cash-flow waterfall
monthlySold comps — $/sqft
last 12 mo · ≤1 miLoading sold comps…