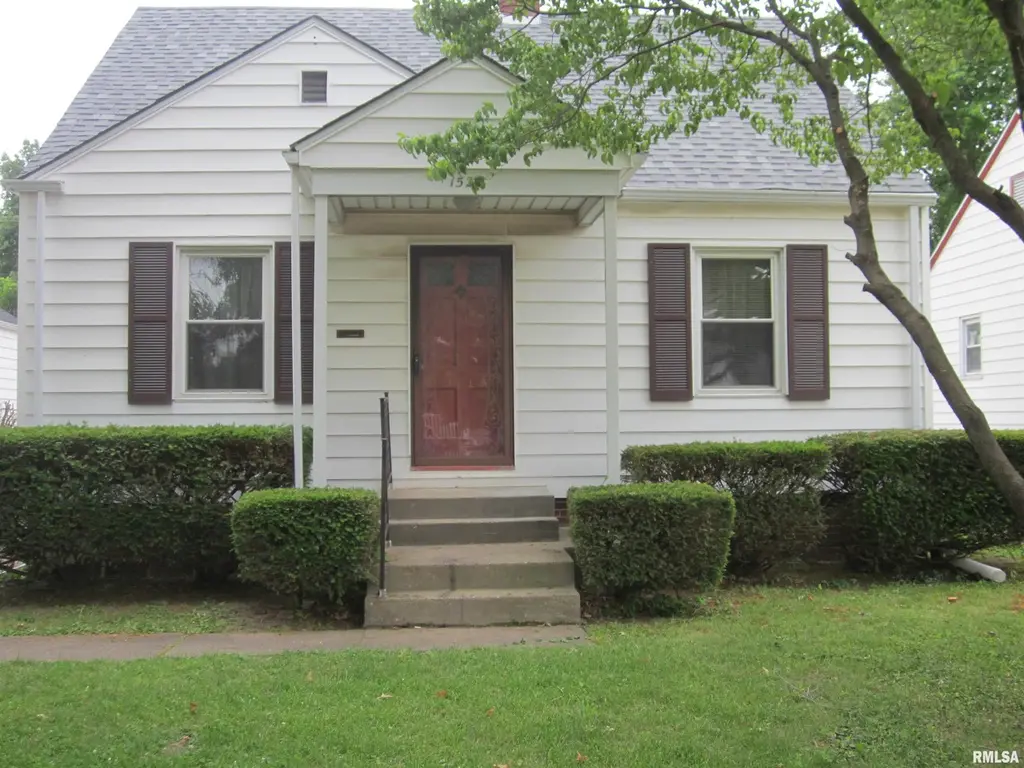
1528 W Monroe St · Springfield, IL
Flood risk 1/10 · Minimal
- FEMA flood zone
- X (unshaded)
- Chance of flooding over 30 yrs
- 0.0%
- Est. flood insurance / yr
- $473 – $860
Fire risk 1/10 · Minimal
- Est. fire insurance / yr
- $804 – $1,492
Heat risk 4/10 · Minor
- Hot days now (above 105°F)
- 7 days/yr
- Hot days in 30 yrs
- 20 days/yr
Wind risk 2/10 · Minimal
- Chance of severe wind over 30 yrs
- 1.0%
Air-quality risk 2/10 · Minimal
- Unhealthy air days now
- 1 days/yr
- Unhealthy air days in 30 yrs
- 2 days/yr
Risk factors via First Street. Map © Google.
Why this score? — see what drove the D grade
The composite is a weighted blend of 9 inputs, each scored 0–100. Each bar is that input's sub-score; the figure is the points it added to the 100-point composite (weight × sub-score).
- Cash flow +13.1/30.0
- ARV discount +11.0/15.0
- 1% rule +4.3/10.0
- Rent growth +4.1/5.0
- Livability +4.0/5.0
- DSCR +3.9/10.0
- Condition / age +2.5/5.0
- Schools +1.7/10.0
- Appreciation +0.0/10.0
$119,900
🖨 Deal sheet (PDF) 📄 Offer letter ✓ Due diligence
Listing remarks
This well cared for home is ready to move into and has updates including, replacement windows, newer furnace, and new roof, flooring, sealed and painted basement in 2026. Oversize garage, a toilet and shower in basement. Upper story could be made into two bedrooms. Come take a look.
Key facts
- Oversize garage
- Newer furnace
- New roof
Tags
Property features AI
Exterior
- Parking: Detached oversized paved garage with 2 spaces
- Utilities: Public water; Public sewer
- Home design: Single family residence; Built in 1941
- Construction: Shingle roof
- Exterior features: Replacement windows; Paved road
Interior
- Kitchen: Kitchen (main level)
- Bedrooms: 2 bedrooms (one on the main level, one on the upper level)
- Flooring: Carpet in bedrooms; Laminate in dining room; Laminate in kitchen; Carpet in living room
- Bathrooms: 1 full bathroom
- Heating & cooling: Forced air heating; Central air conditioning
- Interior features: Cable available; Full basement
- Laundry & utility: No appliances included
Neighborhood map
What this means for you Summary
Snapshot
- This is a 2-bed/1.0-bath single-family listed at $120k.
Deal economics
- At list price, monthly cash flow is $-3 ($-40/yr) — negative.
- To cash-flow at today's rent, offer at most $119k (0.5% below list).
- To meet the 1% rule (rent ≥ 1% of price), the offer needs to be $111k (7.3% below list).
- Recommended offer: $111k (7.3% below list) — sets the bar for 1% rule.
- Cap rate 6.3% vs local median 4.9% in Springfield — meaningfully above typical; check what's discounted (condition, days-on-market, listing class) to confirm the premium yield is real.
Location & tenants
- Location reads 79/100 on livability (#122 in IL, #2,138 nationally) — a middle-class / working-renter tenant base. Strengths: amenities A+, commute A+, cost of living A+; Watch: crime F.
- Springfield SD 186 (urban): math 17% / reading 22% proficiency, ranked #438 of 620 in IL (top 71%) — low school quality limits family demand, transient renter base, plan for 1-2y turnover; 64% free/reduced lunch — lower-income household profile, screen leases tightly.
- Zoned schools: Dubois Elem School (math 2% / reading 2%, grade F, #1,927 of 2,056 statewide, top 100%, 443 students, 0% FRL); U S Grant Middle School (math 6% / reading 15%, grade F, #580 of 665 statewide, top 88%, 529 students, 0% FRL); Springfield High School (math 44% / reading 53%, grade D, #49 of 693 statewide, top 7%, 1,461 students, 0% FRL) — zoned schools average 0% FRL vs 64% district-wide (64 pts lower); this property's tenant base skews higher-income than the district average.
- Market conditions: Rents rising fast (+6.3%/yr); 183 active listings in the ZIP; 12 comparable units currently listed for rent nearby; rentals at typical pace (median 23d on market — plan ~3-4 weeks tenant-placement turnaround); 225 units permitted in Sangamon County in 2024 (48 in 5+ unit buildings).
Forward outlook
- Local home prices are declining (-3.0%/yr); year-one equity from $829 of loan paydown is wiped out by about $4k of value loss. Plan a longer hold.
- Sangamon County population projected to shrink 9% by 2050 — rents likely to lag national; underwrite the cash flow, not the appreciation.
Negotiation context
- Only 3 days on market — expect competitive offers; lowballing is unlikely to land.
- Current owner paid $66k; list at $120k implies a 83% gain — meaningful room to come down on a strong offer.
Risks & watch-outs
- Watch-outs: built in 1941 — expect roof / HVAC / electrical / plumbing capex.
Questions for the listing agent
- What do current leases actually rent for vs. the listed asking? Can we see a recent rent roll and the last 12 months of T-12 income?
- Built in 1941 — when were the roof, HVAC, electrical panel, plumbing, and water heater last replaced?
- Is there a deadline driving the sale (1031 exchange, divorce, estate, relocation)? That informs how much negotiation room exists.
- Schools are D-rated, which usually means shorter tenancies and higher turnover. Who's the typical renter profile here, and what's been the actual vacancy rate?
- Crime grade is F in this area — have there been break-ins, vandalism, or insurance claims at this property in the last 3 years? What carrier currently insures it and at what premium?
- The area grade is low — what's the realistic commute time and amenity access for the typical tenant pool here? Any planned neighborhood developments (good or bad) we should know about?
- What's the average days-on-market for RENTAL listings here right now (not sales)? A rising rental-DOM trend means longer vacancies and softer asking-rent achievability than the comps imply.
- What's the recent tenant-quality profile in this submarket — average credit score on applications, eviction rate, late-payment / NSF rate, and stable-employment percentage? A property-management company in the area should have these aggregated.
- How much new for-sale + rental construction is in the pipeline within 1–3 miles? Heavy new supply typically softens prices + rents 12–24 months out; constrained supply supports both.
Investment metrics
- 1% rule
- 0.93% ✗
- Cap rate
- 6.26%
- Cash-on-cash
- -0.12%
- DSCR
- 0.99
- GRM
- 9.0
CMA / ARV
- ARV (on-the-fly)
- $130,144
- Comps found
- 12
Show comp detail 12 sales within ~0.75 mi
| Address | Dist | Beds/Ba | Sqft | Sold | Price | $/sf | Match |
|---|---|---|---|---|---|---|---|
| 505 S Rosehill Ave | 0.19mi | 2/1.5 | 1,140 (-2%) | 7mo | $163,500 | $143 | 81 |
| 1604 W Monroe St | 0.08mi | 2/1.5 | 1,100 (-5%) | 7mo | $124,000 | $113 | 79 |
| 524 Rosehill Ave | 0.20mi | 2/2.0 | 1,220 (+5%) | 1mo | $167,000 | $137 | 78 |
| 1531 W Monroe St | 0.03mi | 3/1.0 (+1) | 1,040 (-10%) | 1mo | $149,900 | $144 | 75 |
| 423 Adelia St | 0.15mi | 2/1.0 | 1,292 (+11%) | 3mo | $145,000 | $112 | 72 |
| 225 N English Ave | 0.58mi | 2/1.0 | 1,160 (-0%) | 4mo | $80,000 | $69 | 69 |
| 1638 W Capitol Ave | 0.16mi | 2/1.0 | 994 (-14%) | 1mo | $110,000 | $111 | 68 |
| 917 Cleveland Ave | 0.48mi | 3/1.0 (+1) | 1,126 (-3%) | 0mo | $167,000 | $148 | 67 |
| 329 S Park Ave | 0.18mi | 2/1.0 | 991 (-15%) | 1mo | $110,000 | $111 | 66 |
| 146 N State St | 0.71mi | 2/1.0 | 1,203 (+4%) | 7mo | $87,000 | $72 | 56 |
| 1316 W Lawrence Ave | 0.42mi | 2/1.5 | 1,008 (-13%) | 3mo | $112,500 | $112 | 54 |
| 236 N English Ave | 0.60mi | 2/1.0 | 1,332 (+15%) | 2mo | $118,000 | $89 | 46 |
Match score weights: distance 35% · size 25% · config 20% · recency 20%. Top-matched comps best support the ARV.
Projected returns pro-forma
-3.0% appreciation · 6.32% rent growth · sell at horizon
- IRR
- -12.6%
- Equity multiple
- 0.53×
- Total profit
- $-15,754
- Equity at exit
- $17,877
- IRR
- 1.1%
- Equity multiple
- 1.09×
- Total profit
- $3,064
- Equity at exit
- $10,367
Cash invested: $33,572 (down + closing). Projections, not guarantees.
Landlord ↔ Tenant lean methodology
- Overall (STATE)
- 43 Moderately Tenant-Leaning
- State Illinois
- 43 Moderately Tenant-Leaning · D+7
- County
- — inherits STATE
- City
- — inherits STATE
ZIP-level market 62704
- Home prices YoY
- -31.1%
- Rents YoY
- 6.3%
- Active inventory
- 183
- Price-to-rent
- 9.0×
Monthly cashflow live
- Estimated rent
- $1,111 high interval (Pro) →
- Mortgage (P&I)
- −$629
- Tax from tax record
- −$203 /mo · $2,431/yr
- Insurance
- −$50
- HOA
- −$0
- Vacancy / Maint / Mgmt
- −$233
- Net cashflow
- $-3
Break-even live
Sensitivity live
| Price | -10% $65 | -5% $31 | +0% $-3 | +5% $-37 | +10% $-71 |
|---|---|---|---|---|---|
| Rent | -10% $-91 | -5% $-47 | +0% $-3 | +5% $41 | +10% $84 |
| Rate | -1.0pp $57 | -0.5pp $27 | base $-3 | +0.5pp $-34 | +1.0pp $-66 |
UW: 25.0% down · 7.5% · 30yr · 1.5% tax · 5.0% vac · 8.0% maint · 8.0% mgmt
Financing live
Cash to close
- Down payment
- $29,975
- Closing costs
- $3,597
- Reserves months
- —
- Total cash needed
- —
Loan-product check · same deal, 3 products live
Conventional
25% down · 7.5% · 30yr
- Down + closing
- —
- Monthly P&I
- —
- Monthly cashflow
- —
- DSCR
- —
- Eligible?
- —
Personal DTI + credit; lowest rate.
DSCR
20% down · 8.5% · 30yr
- Down + closing
- —
- Monthly P&I
- —
- Monthly cashflow
- —
- DSCR
- —
- Eligible?
- —
No personal income docs; deal must DSCR.
Hard money
10% down · 12.0% · 12mo
- Down + closing
- —
- Monthly P&I
- —
- Monthly cashflow
- —
- DSCR
- —
- Eligible?
- —
Short-term bridge; refi at stabilization.
Rent comps 12 comps
| Address | Beds | Baths | Sqft | Rent | $/sqft | DOM | Units | Dist |
|---|---|---|---|---|---|---|---|---|
| 1539 W Monroe St Springfield, IL | 2.0 | 1.0 | 820 | $2,000 | $2.44 | 23d | 1 | 0.06mi |
| 1644 W Adams St Unit 1 Springfield, IL | 2.0 | 1.0 | 950 | $1,200 | $1.26 | 45d | 1 | 0.18mi |
| 216 N Lincoln Ave Springfield, IL | 2.0 | 1.0 | 800 | $1,200 | $1.50 | 45d | 1 | 0.44mi |
| 300 N Park Ave Springfield, IL | 1.0–2.0 | 1.0 | 694 | $1,035 | $1.49 | 23d | 1 | 0.45mi |
| 203 N Glenwood Ave Springfield, IL | 2.0 | 1.0 | 850 | $1,000 | $1.18 | 23d | 1 | 0.78mi |
| 629 W Washington St Unit 4 Springfield, IL | 2.0 | 1.0 | 700 | $800 | $1.14 | 45d | 1 | 0.90mi |
| 423 W Lawrence Ave Unit 2 Springfield, IL | 2.0 | 1.0 | 900 | $1,050 | $1.17 | 23d | 1 | 1.07mi |
| 1030 N MacArthur Blvd Springfield, IL | 2.0 | 1.0 | 1400 | $1,350 | $0.96 | 23d | 1 | 1.16mi |
| 1004 S College St Springfield, IL | 1.0 | 1.0 | 700 | $800 | $1.14 | 23d | 1 | 1.30mi |
| 229 W Allen St Springfield, IL | 3.0 | 1.5 | 1050 | $1,305 | $1.24 | 23d | 1 | 1.31mi |
| 424 S Durkin Dr Springfield, IL | 2.0 | 1.0 | 885 | $925 | $1.05 | 23d | 1 | 1.32mi |
| 924 Clocktower Dr Unit 4 Springfield, IL | 1.0 | 1.0 | 1000 | $800 | $0.80 | 45d | 1 | 1.44mi |
Listing history 3 events
-
2026-06-22days on market $119,900 Active 3 DOM
-
2026-06-18remarks 283-char remark
-
2026-06-18$119,900 Active 1 DOM
ⓘ Source: listings_history table (triggers on properties + properties_extension) + one-shot
backfill from property_details.listing_events for pre-trigger history.
Tax reassessment forecast IL · Partial reset (capped growth)
- Current annual tax
- $2,431 · $203/mo
- Projected year-2 tax
- $2,576 · $215/mo
- Expected delta
- +$145/yr (+$12/mo · 6.0%)
ⓘ Screening estimate from a state-policy table — verify with the county assessor before closing.
Climate risk First Street
- Flood 1/10 Low FEMA zone X (unshaded) · 0% chance over 30 yrs
- Wildfire 1/10 Low
- Heat 4/10 Moderate 7 d/yr ≥105°F today · 20 d/yr by 30 yrs out
- Wind 2/10 Low 100% chance of damaging wind over 30 yrs
- Air quality 2/10 Low 1 unhealthy d/yr today · 2 by 30 yrs out
Nearby sold comps map
Loading sold comps map…
Walkable amenities ~0.75 mi
Loading nearby amenities…
Taxation est. · year 1
- Rental income
- $13,337
- − Mortgage interest
- −$6,716
- − Property taxes
- −$2,431
- − Insurance
- −$600
- − Repairs & maintenance
- −$1,067
- − Management
- −$1,067
- − Depreciation
- −$3,488
- Taxable loss
- −$2,032
- Est. tax savings @ 24.0%
- +$488
- After-tax cash flow
- $448/yr
For passive investors: Depreciation is non-cash, so a rental often shows a tax loss while cash-flowing — sheltering income. Rental losses are passive: they offset passive income freely, and up to $25,000/yr can offset ordinary (W-2) income if you actively participate and your MAGI is under $100k (phasing out to $0 by $150k); unused losses carry forward. On sale, claimed depreciation is recaptured at up to 25%, and gains may owe capital-gains tax (a 1031 exchange can defer both). Figures are a year-1 estimate at your 24.0% rate — not tax advice; consult a CPA.
Schools (NCES district)
- District
- Springfield SD 186
- NCES district ID
- 1737080
- Math proficiency
- 17% ▼ -7.00%
- Reading proficiency
- 22% ▼ -5.00%
- Median HH income
- $43,744
- Composite
- 16.89/100
- National rank
- #9142
- State rank
- #438 of 620 in IL
Livability — Springfield
- Score
- 79/100
- State rank
- #122
- US rank
- #2138
Category grades
Schools grade is shown separately in the Schools card above.
Census & demographics
- Census place
- Springfield, IL
- County
- Sangamon County · 115,414 people
- City population
- 59,955
- Metro
- Springfield, IL
- Population (ZIP)
- 40,046
- Household income
- $69,976
- Rent vs Own
- Severe rent burden
- 1529.0
Population outlook (Sangamon County) Hauer SSP2
- Today (2025)
- 198,317 people
- By 2030
- 196,127 · -1.1%
- By 2040
- 188,664 · -4.9%
- By 2050
- 179,624 · -9.4%
- By 2075
- 155,027 · -21.8%
- By 2100
- 122,588 · -38.2%
Race, ethnicity, and origin ACS 2023
- Neighborhood character
- Predominantly White (74%)
- Race & ethnicity
- White 74% Black 15% Two or more races 5% Hispanic / Latino 4% Asian 4%
- Common ancestry
- Lithuanian 2% Romanian 2% Slovak 2%
- Foreign-born
- 6% · Canada, China, Vietnam
- Languages at home
- 92% English-only · Spanish 2% Other Indo-European 1% Tagalog/Filipino 1%
Political lean MEDSL · Sangamon
- 2024 margin
- Toss-up / Even · D 46.6% · R 51.6% · Other 1.8%
- 2008→2024 swing
- -9.3pp toward R · 2008: 4.4pp · 2024: -5.0pp
- All cycles
- 2024: R+5.0 2020: R+4.4 2016: R+9.4 2012: R+8.7 2008: D+4.4
Not yet ingested
- Civics
- —
Market trends
- HPI YoY
- ▼ -70.79%
- Current HPI
- 156.7086
- Rent YoY
- ▲ 6.32%
- Metro
- Springfield, IL
- State GDP YoY
- ▲ 1.59%
- F500 in state
- 60
Industry mix (Fortune 500 HQ in IL)
| Industry | F500 HQs | Revenue |
|---|---|---|
| Insurance | 4 | $201B |
|
||
| Consumer Goods | 4 | $87B |
|
||
| Industrial Machinery | 3 | $64B |
|
||
| Healthcare | 2 | $55B |
|
||
| Retail / Pharmacy | 1 | $148B |
|
||
| Agriculture / Food | 1 | $86B |
|
||
Price history
+83.1% since first listed2 events — show timeline
- 2026-06-18 Listed $119,900 RMLSA as Distributed by MLS Grid
- 2010-10-27 Sold (Public Records) $65,500 Public Records
Property tax history
+3.6%/yrLatest (2025): $2,431 · +4.9% YoY. Source: county tax records.
Cash-flow waterfall
monthlySold comps — $/sqft
last 12 mo · ≤1 miLoading sold comps…