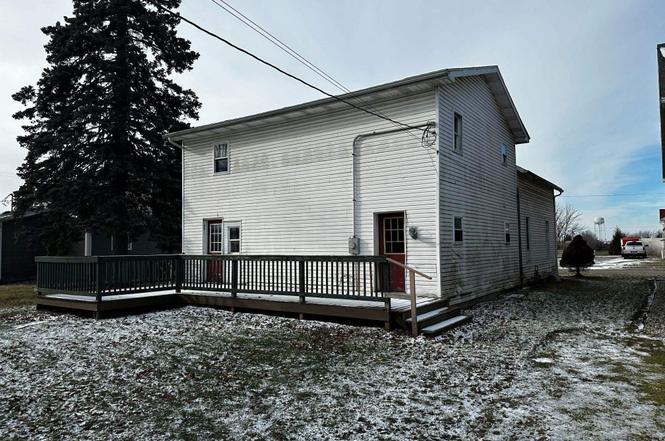
218 N Main St · Topeka, IN
Flood risk 1/10 · Minimal
- FEMA flood zone
- X (unshaded)
- Chance of flooding over 30 yrs
- 0.0%
- Est. flood insurance / yr
- $473 – $860
Fire risk 3/10 · Minor
- Est. fire insurance / yr
- $717 – $1,331
Heat risk 2/10 · Minimal
- Hot days now (above 99°F)
- 7 days/yr
- Hot days in 30 yrs
- 16 days/yr
Wind risk 2/10 · Minimal
- Chance of severe wind over 30 yrs
- —
Air-quality risk 2/10 · Minimal
- Unhealthy air days now
- 1 days/yr
- Unhealthy air days in 30 yrs
- 1 days/yr
Risk factors via First Street. Map © Google.
Why this score? — see what drove the D- grade
The composite is a weighted blend of 9 inputs, each scored 0–100. Each bar is that input's sub-score; the figure is the points it added to the 100-point composite (weight × sub-score).
- Appreciation +7.6/10.0
- ARV discount +7.5/15.0
- Cash flow +5.0/30.0
- Schools +4.8/10.0
- Livability +3.2/5.0
- Rent growth +2.5/5.0
- Condition / age +2.5/5.0
- 1% rule +2.1/10.0
- DSCR +0.0/10.0
$120,000
🖨 Deal sheet (PDF) 📄 Offer letter ✓ Due diligence
Listing remarks MLS
HUD HOME – “ALL properties sold in “AS-IS” condition without any guarantee or warranty by seller. ” CASE NUMBER: 156-455013. NOTES: “EQUAL HOUSING OPPORTUNITY” INSURANCE STATUS:UI, ESCROW AMT: zero, ELIGIBLE FOR 203K:yes; LIST DATE 11/18/25. FOR MORE INFORMATION ON HUD FORMS, EARNEST MONEY AND ON-LINE BIDDING PLEASE SEE www. HUDhomestore.com. OR SPEAK WITH LISTING AGENT FOR FASTER ANSWERS TO YOUR QUESTIONS. ALL INFORMATION DEEMED RELIABLE BUT NOT GUARANTEED.
Key facts
- 9,583 sq ft lot
- Built 1964
- Listed 46 days
Neighborhood map
What this means for you Summary
Snapshot
- This is a 1-bed/1.0-bath single-family listed at $120k.
Deal economics
- At list price, monthly cash flow is $-285 ($-3k/yr) — negative.
- To cash-flow at today's rent, offer at most $70k (42.0% below list).
- To meet the 1% rule (rent ≥ 1% of price), the offer needs to be $85k (29.3% below list).
- Recommended offer: $70k (42.0% below list) — sets the bar for cash-flow.
Location & tenants
- Location reads 65/100 on livability (#329 in IN) — a middle-class / working-renter tenant base. Strengths: cost of living A+, housing A+; Watch: amenities F, commute F, health & safety D-.
- Westview School Corporation (rural): math 58% / reading 53% proficiency, ranked #29 of 301 in IN (top 10%) — acceptable for families but not a draw, mixed tenant base, ~2y average lease.
- Zoned schools: Topeka Elementary School (math 52% / reading 42%, grade D-, #325 of 994 statewide, top 36%, 267 students, 40% FRL); Westview Jr-Sr High School (math 54% / reading 52%, grade C-, #99 of 369 statewide, top 27%, 743 students, 29% FRL).
- Market conditions: 7 active listings in the ZIP; 134 units permitted in LaGrange County in 2024 (0 in 5+ unit buildings).
Forward outlook
- In year one you build about $7k of equity ($830 loan paydown + $6k appreciation (5.3% local appreciation)).
- By year 5, paydown + projected appreciation supports a ~$31k cash-out refi (75% LTV) — recoverable capital for the next deal without selling this one.
Negotiation context
- It's been on market 46 days — a 3% lower offer ($116k) is reasonable based on typical stale-listing flexibility.
- 3 sale attempts since 7y ago; this cycle's ask is 11900% above the opening price — seller raised mid-cycle; expect resistance to lowballs.
- Current owner paid $90k; 33% above their basis — modest negotiation headroom, anchor on the comps not their cost.
Risks & watch-outs
- Watch-outs: property tax is 2.8% of price.
Questions for the listing agent
- What do current leases actually rent for vs. the listed asking? Can we see a recent rent roll and the last 12 months of T-12 income?
- It's been on market 46 days. Have you received any prior offers? Is the seller open to a 42% concession, seller financing, or rate buy-down credit?
- Built in 1964 — when were the roof, HVAC, electrical panel, plumbing, and water heater last replaced?
- Property tax is high relative to price — has the assessment been appealed recently, and will the sale trigger a re-assessment?
- Is there a deadline driving the sale (1031 exchange, divorce, estate, relocation)? That informs how much negotiation room exists.
- Schools are D-rated, which usually means shorter tenancies and higher turnover. Who's the typical renter profile here, and what's been the actual vacancy rate?
- The area grade is low — what's the realistic commute time and amenity access for the typical tenant pool here? Any planned neighborhood developments (good or bad) we should know about?
- What's the average days-on-market for RENTAL listings here right now (not sales)? A rising rental-DOM trend means longer vacancies and softer asking-rent achievability than the comps imply.
- What's the recent tenant-quality profile in this submarket — average credit score on applications, eviction rate, late-payment / NSF rate, and stable-employment percentage? A property-management company in the area should have these aggregated.
- How much new for-sale + rental construction is in the pipeline within 1–3 miles? Heavy new supply typically softens prices + rents 12–24 months out; constrained supply supports both.
Investment metrics
- 1% rule
- 0.71% ✗
- Cap rate
- 3.44%
- Cash-on-cash
- -10.19%
- DSCR
- 0.55
- GRM
- 11.8
CMA / ARV
No comps found within radius.
Projected returns pro-forma
5.28% appreciation · 3.0% rent growth · sell at horizon
- IRR
- 5.2%
- Equity multiple
- 1.34×
- Total profit
- $11,498
- Equity at exit
- $70,042
- IRR
- 7.7%
- Equity multiple
- 2.48×
- Total profit
- $49,795
- Equity at exit
- $122,604
Cash invested: $33,600 (down + closing). Projections, not guarantees.
Landlord ↔ Tenant lean methodology
- Overall (STATE)
- 90 Strongly Landlord-Friendly
- State Indiana
- 90 Strongly Landlord-Friendly · R+11
- County
- — inherits STATE
- City
- — inherits STATE
ZIP-level market 46571
- Home prices YoY
- 2.3%
- Active inventory
- 7
- Price-to-rent
- 11.8×
Monthly cashflow live
- Estimated rent
- $849 medium interval (Pro) →
- Mortgage (P&I)
- −$629
- Tax from tax record
- −$277 /mo · $3,319/yr
- Insurance
- −$50
- HOA
- −$0
- Vacancy / Maint / Mgmt
- −$178
- Net cashflow
- $-285
Break-even live
Sensitivity live
| Price | -10% $-217 | -5% $-251 | +0% $-285 | +5% $-319 | +10% $-353 |
|---|---|---|---|---|---|
| Rent | -10% $-352 | -5% $-319 | +0% $-285 | +5% $-252 | +10% $-218 |
| Rate | -1.0pp $-225 | -0.5pp $-255 | base $-285 | +0.5pp $-316 | +1.0pp $-348 |
UW: 25.0% down · 7.5% · 30yr · 1.5% tax · 5.0% vac · 8.0% maint · 8.0% mgmt
Financing live
Cash to close
- Down payment
- $30,000
- Closing costs
- $3,600
- Reserves months
- —
- Total cash needed
- —
Loan-product check · same deal, 3 products live
Conventional
25% down · 7.5% · 30yr
- Down + closing
- —
- Monthly P&I
- —
- Monthly cashflow
- —
- DSCR
- —
- Eligible?
- —
Personal DTI + credit; lowest rate.
DSCR
20% down · 8.5% · 30yr
- Down + closing
- —
- Monthly P&I
- —
- Monthly cashflow
- —
- DSCR
- —
- Eligible?
- —
No personal income docs; deal must DSCR.
Hard money
10% down · 12.0% · 12mo
- Down + closing
- —
- Monthly P&I
- —
- Monthly cashflow
- —
- DSCR
- —
- Eligible?
- —
Short-term bridge; refi at stabilization.
Listing history 8 events
-
2026-03-07status Pending
-
2026-03-07price $120,000
-
2026-01-20$1,000 Active
-
2025-12-23soldstatus $90,000 Closed 504-char remark
Show marketing remark (504 chars)
HUD HOME – “ALL properties sold in “AS-IS” condition without any guarantee or warranty by seller. ” CASE NUMBER: 156-455013. NOTES: “EQUAL HOUSING OPPORTUNITY” INSURANCE STATUS:UI, ESCROW AMT: zero, ELIGIBLE FOR 203K:yes; LIST DATE 11/18/25. FOR MORE INFORMATION ON HUD FORMS, EARNEST MONEY AND ON-LINE BIDDING PLEASE SEE www. HUDhomestore.com. OR SPEAK WITH LISTING AGENT FOR FASTER ANSWERS TO YOUR QUESTIONS. ALL INFORMATION DEEMED RELIABLE BUT NOT GUARANTEED.
-
2025-12-01status Pending 504-char remark
Show marketing remark (504 chars)
HUD HOME – “ALL properties sold in “AS-IS” condition without any guarantee or warranty by seller. ” CASE NUMBER: 156-455013. NOTES: “EQUAL HOUSING OPPORTUNITY” INSURANCE STATUS:UI, ESCROW AMT: zero, ELIGIBLE FOR 203K:yes; LIST DATE 11/18/25. FOR MORE INFORMATION ON HUD FORMS, EARNEST MONEY AND ON-LINE BIDDING PLEASE SEE www. HUDhomestore.com. OR SPEAK WITH LISTING AGENT FOR FASTER ANSWERS TO YOUR QUESTIONS. ALL INFORMATION DEEMED RELIABLE BUT NOT GUARANTEED.
-
2025-11-18$87,000 Active 504-char remark
Show marketing remark (504 chars)
HUD HOME – “ALL properties sold in “AS-IS” condition without any guarantee or warranty by seller. ” CASE NUMBER: 156-455013. NOTES: “EQUAL HOUSING OPPORTUNITY” INSURANCE STATUS:UI, ESCROW AMT: zero, ELIGIBLE FOR 203K:yes; LIST DATE 11/18/25. FOR MORE INFORMATION ON HUD FORMS, EARNEST MONEY AND ON-LINE BIDDING PLEASE SEE www. HUDhomestore.com. OR SPEAK WITH LISTING AGENT FOR FASTER ANSWERS TO YOUR QUESTIONS. ALL INFORMATION DEEMED RELIABLE BUT NOT GUARANTEED.
-
2020-04-01soldstatus $125,000 182-char remark
Show marketing remark (182 chars)
Big wonderful home just north of downtown Topeka. Convenient to shopping. Hardwood floors on main level. 5 Bedrooms and 2 full Bathrooms with fixtures in place to add a 3rd bathroom.
-
2019-12-11$125,000 182-char remark
Show marketing remark (182 chars)
Big wonderful home just north of downtown Topeka. Convenient to shopping. Hardwood floors on main level. 5 Bedrooms and 2 full Bathrooms with fixtures in place to add a 3rd bathroom.
ⓘ Source: listings_history table (triggers on properties + properties_extension) + one-shot
backfill from property_details.listing_events for pre-trigger history.
Tax reassessment forecast IN · Partial reset (capped growth)
- Current annual tax
- $3,319 · $277/mo
- Projected year-2 tax
- $3,319 · $277/mo
- Expected delta
- $0/yr ($0/mo · 0.0%)
ⓘ Screening estimate from a state-policy table — verify with the county assessor before closing.
Climate risk First Street
- Flood 1/10 Low FEMA zone X (unshaded) · 0% chance over 30 yrs
- Wildfire 3/10 Moderate
- Heat 2/10 Low 7 d/yr ≥99°F today · 16 d/yr by 30 yrs out
- Wind 2/10 Low
- Air quality 2/10 Low 1 unhealthy d/yr today · 1 by 30 yrs out
Nearby sold comps map
Loading sold comps map…
Walkable amenities ~0.75 mi
Loading nearby amenities…
Taxation est. · year 1
- Rental income
- $10,186
- − Mortgage interest
- −$6,722
- − Property taxes
- −$3,319
- − Insurance
- −$600
- − Repairs & maintenance
- −$815
- − Management
- −$815
- − Depreciation
- −$3,491
- Taxable loss
- −$5,575
- Est. tax savings @ 24.0%
- +$1,338
- After-tax cash flow
- $-2,085/yr
For passive investors: Depreciation is non-cash, so a rental often shows a tax loss while cash-flowing — sheltering income. Rental losses are passive: they offset passive income freely, and up to $25,000/yr can offset ordinary (W-2) income if you actively participate and your MAGI is under $100k (phasing out to $0 by $150k); unused losses carry forward. On sale, claimed depreciation is recaptured at up to 25%, and gains may owe capital-gains tax (a 1031 exchange can defer both). Figures are a year-1 estimate at your 24.0% rate — not tax advice; consult a CPA.
Schools (NCES district)
- District
- Westview School Corporation
- NCES district ID
- 1813110
- Math proficiency
- 58% ▼ -6.00%
- Reading proficiency
- 53% ▼ -5.00%
- Median HH income
- $53,000
- Composite
- 47.66/100
- National rank
- #2245
- State rank
- #29 of 301 in IN
Livability — Topeka
- Score
- 65/100
- State rank
- #329
- US rank
- #12744
Category grades
Schools grade is shown separately in the Schools card above.
Census & demographics
- Census place
- Topeka, IN
- Population (ZIP)
- 6,321
Population outlook (LaGrange County) Hauer SSP2
- Today (2025)
- 39,718 people
- By 2030
- 40,060 · +0.9%
- By 2040
- 40,333 · +1.5%
- By 2050
- 39,284 · -1.1%
- By 2075
- 32,100 · -19.2%
- By 2100
- 21,407 · -46.1%
Race, ethnicity, and origin ACS 2023
- Neighborhood character
- Predominantly White (96%)
- Race & ethnicity
- White 96% Two or more races 2% Hispanic / Latino 2%
- Common ancestry
- Polish 12% Italian 5% Iranian 1%
- Foreign-born
- 2%
- Languages at home
- 30% English-only · German/W. Germanic 66% Arabic 2% Spanish 1%
Political lean MEDSL · LaGrange
- 2024 margin
- Solid R (+56.8) · D 20.8% · R 77.6% · Other 1.7%
- 2008→2024 swing
- -35.3pp toward R · 2008: -21.5pp · 2024: -56.8pp
- All cycles
- 2024: R+56.8 2020: R+54.1 2016: R+51.8 2012: R+35.8 2008: R+21.5
Not yet ingested
- Civics
- —
Market trends
- HPI YoY
- ▲ 5.28%
- Current HPI
- 234.2755
- Rent YoY
- —
- Metro
- —
- State GDP YoY
- ▲ 2.90%
- F500 in state
- 18
Industry mix (Fortune 500 HQ in IN)
| Industry | F500 HQs | Revenue |
|---|---|---|
| Industrial Machinery | 2 | $37B |
|
||
| Healthcare | 1 | $177B |
|
||
| Pharmaceuticals | 1 | $45B |
|
||
| Metals / Steel | 1 | $18B |
|
||
| Agriculture | 1 | $17B |
|
||
| Packaging | 1 | $12B |
|
||
Price history
-4.0% since first listed8 events — show timeline
- 2026-03-07 Pending — IRMLS
- 2026-03-07 Price Changed $120,000 IRMLS
- 2026-01-20 Listed $1,000 IRMLS
- 2025-12-23 Sold (MLS) $90,000 IRMLS
- 2025-12-01 Pending — IRMLS
- 2025-11-18 Listed $87,000 IRMLS
- 2020-04-01 Sold (MLS) $125,000 IRMLS
- 2019-12-11 Listed $125,000 IRMLS
Property tax history
+4.4%/yrLatest (2024): $3,319 · +6.0% YoY. Source: county tax records.
Cash-flow waterfall
monthlySold comps — $/sqft
last 12 mo · ≤1 miLoading sold comps…