295 Williams Rd · Guyton, GA
Flood risk 1/10 · Minimal
- FEMA flood zone
- X (unshaded)
- Chance of flooding over 30 yrs
- 0.0%
- Est. flood insurance / yr
- $507 – $1,088
Fire risk 4/10 · Minor
- Est. fire insurance / yr
- $963 – $1,789
Heat risk 8/10 · Major
- Hot days now (above 110°F)
- 7 days/yr
- Hot days in 30 yrs
- 18 days/yr
Wind risk 8/10 · Major
- Chance of severe wind over 30 yrs
- 94.0%
Air-quality risk 2/10 · Minimal
- Unhealthy air days now
- 2 days/yr
- Unhealthy air days in 30 yrs
- 2 days/yr
Risk factors via First Street. Map © Google.
Why this score? — see what drove the C- grade
The composite is a weighted blend of 9 inputs, each scored 0–100. Each bar is that input's sub-score; the figure is the points it added to the 100-point composite (weight × sub-score).
- Cash flow +17.8/30.0
- ARV discount +7.5/15.0
- DSCR +5.6/10.0
- 1% rule +4.8/10.0
- Condition / age +4.8/5.0
- Schools +4.3/10.0
- Livability +3.5/5.0
- Rent growth +2.5/5.0
- Appreciation +0.0/10.0
$279,996
🖨 Deal sheet (PDF) 📄 Offer letter ✓ Due diligence
Listing remarks
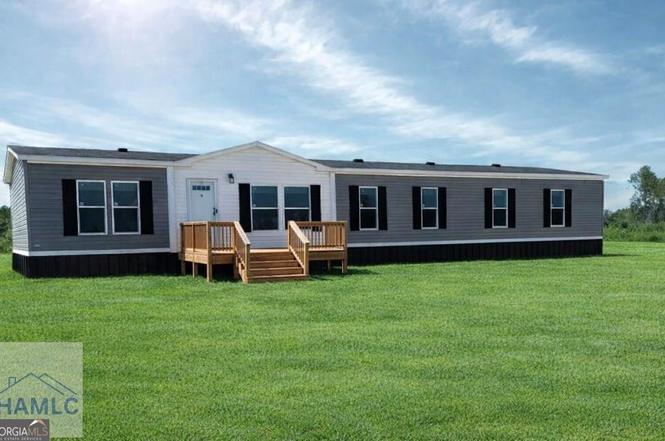
LOT 3 SIT ON 1 ACRE!!! WILL GO VA AND FHA ! Don't miss out on this Charming NEW, ENERGY EFFICIENT 4 bedroom / 3-bathroom home that HAS IT ALL!!! Open and inviting floor plan, elegant white cabinetry, upgraded lighting fixtures and recessed lighting. Complete modern home essentials with a comfortable layout. Double vanity in master bathroom with a tub/shower. Brand new appliances! Home has a 1-year manufacture warranty. VISIT the property today. Seller is a licensed Realtor in GA. Exterior photos enhanced for lawn purposes. Homes qualify for FHA and VA loans with a permanent foundation. Pictures of Model Home and represent similar fixtures and color options
Key facts
- 1 acre lot
- Built 2026
- Listed 9 days
Neighborhood map
What this means for you Summary
Snapshot
- This is a 4-bed/3.0-bath single-family listed at $280k. Condition is rated excellent.
Deal economics
- At list price, monthly cash flow is $229 ($3k/yr) — positive.
- The deal already cash-flows at list — no discount required.
- To meet the 1% rule (rent ≥ 1% of price), the offer needs to be $274k (2.2% below list).
- Recommended offer: $274k (2.2% below list) — sets the bar for 1% rule.
- Cap rate 7.3% vs local median 4.6% in Guyton — top-decile yield for the area; either an underpriced asset or a hidden risk that comps aren't pricing in. Stress-test before assuming the spread holds.
Location & tenants
- Location reads 69/100 on livability (#128 in GA) — a middle-class / working-renter tenant base. Strengths: crime A+, cost of living A+, housing A+; Watch: amenities F, commute F, health & safety F.
- Effingham County (rural): math 49% / reading 48% proficiency, ranked #16 of 174 in GA (top 9%) — families likely to look elsewhere, expect single-tenant / working-renter base with shorter leases.
- Zoned schools: Guyton Elementary School (math 45% / reading 35%, grade F, #427 of 1,228 statewide, top 35%, 739 students, 54% FRL); Effingham County Middle School (math 38% / reading 40%, grade F, #155 of 470 statewide, top 33%, 1,064 students, 52% FRL); Effingham County High School (math 28% / reading 27%, grade F, #158 of 424 statewide, top 37%, 2,108 students, 37% FRL).
- Zoned-school proficiency averages 36% at this address vs 48% district-wide (-13 pts) — the specific schools serving this property underperform the Effingham County average; the district grade overstates school quality for this exact location.
- Market conditions: 400 active listings in the ZIP; 1 comparable units currently listed for rent nearby; solid renter incomes; 836 units permitted in Effingham County in 2024 (46 in 5+ unit buildings).
- This rent runs 32% of the median local income ($102k/yr) — at the standard rent-burdened threshold; future hikes will face affordability resistance.
Forward outlook
- Local home prices are declining (-3.0%/yr); year-one equity from $2k of loan paydown is wiped out by about $8k of value loss. Plan a longer hold.
- Effingham County population projected at +33% by 2050 — long-run rental-demand tailwind backs the buy-and-hold thesis.
Negotiation context
- Only 9 days on market — expect competitive offers; lowballing is unlikely to land.
Risks & watch-outs
- Climate carrying-cost: severe wind risk, 94% chance of damaging wind over 30y; extreme-heat days projected 7→18/yr by 2055 (HVAC capex compounding) — expect insurance premiums to compound above CPI over the hold.
Questions for the listing agent
- Is there a deadline driving the sale (1031 exchange, divorce, estate, relocation)? That informs how much negotiation room exists.
- What's the average days-on-market for RENTAL listings here right now (not sales)? A rising rental-DOM trend means longer vacancies and softer asking-rent achievability than the comps imply.
- What's the recent tenant-quality profile in this submarket — average credit score on applications, eviction rate, late-payment / NSF rate, and stable-employment percentage? A property-management company in the area should have these aggregated.
- How much new for-sale + rental construction is in the pipeline within 1–3 miles? Heavy new supply typically softens prices + rents 12–24 months out; constrained supply supports both.
Investment metrics
- 1% rule
- 0.98% ✗
- Cap rate
- 7.28%
- Cash-on-cash
- 3.51%
- DSCR
- 1.16
- GRM
- 8.5
CMA / ARV
No comps found within radius.
Show comp detail 3 sales within ~0.75 mi
| Address | Dist | Beds/Ba | Sqft | Sold | Price | $/sf | Match |
|---|---|---|---|---|---|---|---|
| 540 Brogdon Rd | 0.28mi | 3/2.0 (-1) | 1,316 | 2mo | $314,000 | $239 | 64 |
| 538 4th St Ext Ext | 0.56mi | 4/2.0 | 1,820 | 2mo | $275,000 | $151 | 55 |
| 900 Brogdon Rd | 0.61mi | 4/4.0 | 3,346 | 6mo | $925,000 | $276 | 50 |
Match score weights: distance 35% · size 25% · config 20% · recency 20%. Top-matched comps best support the ARV.
Projected returns pro-forma
-3.0% appreciation · 3.0% rent growth · sell at horizon
- IRR
- -10.8%
- Equity multiple
- 0.61×
- Total profit
- $-30,721
- Equity at exit
- $41,748
- IRR
- -1.4%
- Equity multiple
- 0.90×
- Total profit
- $-7,771
- Equity at exit
- $24,209
Cash invested: $78,399 (down + closing). Projections, not guarantees.
Landlord ↔ Tenant lean methodology
- Overall (STATE)
- 90 Strongly Landlord-Friendly
- State Georgia
- 90 Strongly Landlord-Friendly · R+3
- County
- — inherits STATE
- City
- — inherits STATE
ZIP-level market 31312
- Home prices YoY
- -26.6%
- Active inventory
- 400
- Price-to-rent
- 8.5×
Monthly cashflow live
- Estimated rent
- $2,740 medium interval (Pro) →
- Mortgage (P&I)
- −$1,468
- Tax est. 1.5%
- −$350 /mo · $4,200/yr
- Insurance
- −$117
- HOA
- −$0
- Vacancy / Maint / Mgmt
- −$575
- Net cashflow
- $229
Break-even live
Sensitivity live
| Price | -10% $423 | -5% $326 | +0% $229 | +5% $133 | +10% $36 |
|---|---|---|---|---|---|
| Rent | -10% $13 | -5% $121 | +0% $229 | +5% $338 | +10% $446 |
| Rate | -1.0pp $370 | -0.5pp $301 | base $229 | +0.5pp $157 | +1.0pp $83 |
UW: 25.0% down · 7.5% · 30yr · 1.5% tax · 5.0% vac · 8.0% maint · 8.0% mgmt
Financing live
Cash to close
- Down payment
- $69,999
- Closing costs
- $8,400
- Reserves months
- —
- Total cash needed
- —
Loan-product check · same deal, 3 products live
Conventional
25% down · 7.5% · 30yr
- Down + closing
- —
- Monthly P&I
- —
- Monthly cashflow
- —
- DSCR
- —
- Eligible?
- —
Personal DTI + credit; lowest rate.
DSCR
20% down · 8.5% · 30yr
- Down + closing
- —
- Monthly P&I
- —
- Monthly cashflow
- —
- DSCR
- —
- Eligible?
- —
No personal income docs; deal must DSCR.
Hard money
10% down · 12.0% · 12mo
- Down + closing
- —
- Monthly P&I
- —
- Monthly cashflow
- —
- DSCR
- —
- Eligible?
- —
Short-term bridge; refi at stabilization.
Rent comps 1 comps
| Address | Beds | Baths | Sqft | Rent | $/sqft | DOM | Units | Dist |
|---|---|---|---|---|---|---|---|---|
| 131 Freesia Dr Springfield, GA | 4.0 | 2.5 | 1930 | $2,275 | $1.18 | 45d | 1 | 1.25mi |
Listing history 30 events
-
2026-06-18status $279,996 Under Contract 9 DOM
-
2026-06-18days on market $279,996 New 9 DOM
-
2026-06-17days on market $279,996 New 8 DOM
-
2026-06-16days on market $279,996 New 7 DOM
-
2026-06-15days on market $279,996 New 6 DOM
-
2026-06-14days on market $279,996 New 4 DOM
-
2026-06-13days on market $279,996 New 3 DOM
-
2026-06-10statusdays on market $279,996 New 1 DOM
-
2026-06-09days on market $279,996 Active 26 DOM
-
2026-06-09price $279,996 Active 25 DOM
-
2026-06-08days on market $279,997 Active 25 DOM
-
2026-06-07pricedays on market $279,997 Active 24 DOM
-
2026-06-05pricestatusdays on market $279,998 Active 21 DOM
-
2026-04-10price $281,999
-
2026-04-03status Pending
-
2026-04-03price $282,000
-
2026-04-02price $279,983
-
2026-04-01price $279,984
-
2026-03-31price $279,985
-
2026-03-30price $279,986
-
2026-03-26price $279,988
-
2026-03-25price $279,989
-
2026-03-24price $279,990
-
2026-03-24price $279,991
-
2026-03-21price $279,992
-
2026-03-20price $279,994
-
2026-03-19price $279,996
-
2026-03-17price $2,799,965
-
2026-03-17price $279,996
-
2026-03-10$279,997 Active
ⓘ Source: listings_history table (triggers on properties + properties_extension) + one-shot
backfill from property_details.listing_events for pre-trigger history.
Climate risk First Street
- Flood 1/10 Low FEMA zone X (unshaded) · 0% chance over 30 yrs
- Wildfire 4/10 Moderate
- Heat 8/10 Severe 7 d/yr ≥110°F today · 18 d/yr by 30 yrs out
- Wind 8/10 Severe 94% chance of damaging wind over 30 yrs
- Air quality 2/10 Low 2 unhealthy d/yr today · 2 by 30 yrs out
Nearby sold comps map
Loading sold comps map…
Walkable amenities ~0.75 mi
Loading nearby amenities…
Taxation est. · year 1
- Rental income
- $32,877
- − Mortgage interest
- −$15,684
- − Property taxes
- −$4,200
- − Insurance
- −$1,400
- − Repairs & maintenance
- −$2,630
- − Management
- −$2,630
- − Depreciation
- −$8,145
- Taxable loss
- −$1,813
- Est. tax savings @ 24.0%
- +$435
- After-tax cash flow
- $3,188/yr
For passive investors: Depreciation is non-cash, so a rental often shows a tax loss while cash-flowing — sheltering income. Rental losses are passive: they offset passive income freely, and up to $25,000/yr can offset ordinary (W-2) income if you actively participate and your MAGI is under $100k (phasing out to $0 by $150k); unused losses carry forward. On sale, claimed depreciation is recaptured at up to 25%, and gains may owe capital-gains tax (a 1031 exchange can defer both). Figures are a year-1 estimate at your 24.0% rate — not tax advice; consult a CPA.
Condition & rehab AI · 5 photos
This charming, energy-efficient home is in excellent condition with a modern kitchen, well-maintained exterior, and a comfortable layout. It is move-in ready and has the potential for further value-adding improvements.
Value-add opportunities
- Both Painting the exterior and interior walls — Fresh paint can enhance curb appeal and interior aesthetics.
- Both Landscaping improvements — Enhanced landscaping can improve curb appeal and attract potential buyers/tenants.
- Both Add a small outdoor seating area — A small outdoor seating area can increase the home's appeal and functionality.
- Both Install smart home features — Smart home features can increase the home's value and attract tech-savvy buyers/tenants.
- Both Add a small outdoor storage shed — A small outdoor storage shed can increase the home's functionality and appeal to potential buyers/tenants.
Renovation cost estimate screening
Value-add ROI direction
- Both Painting the exterior and interior walls — Fresh paint can enhance curb appeal and interior aesthetics. ↑
- Both Landscaping improvements — Enhanced landscaping can improve curb appeal and attract potential buyers/tenants. ↑
- Both Add a small outdoor seating area — A small outdoor seating area can increase the home's appeal and functionality. ↑
- Both Install smart home features — Smart home features can increase the home's value and attract tech-savvy buyers/tenants. ↑
- Both Add a small outdoor storage shed — A small outdoor storage shed can increase the home's functionality and appeal to potential buyers/tenants. ↑
ⓘ Cost ranges are severity-bucket heuristics (US national rule-of-thumb). Get contractor quotes + a written scope before underwriting a rehab budget.
Schools (NCES district)
- District
- Effingham County
- NCES district ID
- 1301980
- Math proficiency
- 49% ▼ -6.00%
- Reading proficiency
- 48% ▼ -5.00%
- Median HH income
- $60,503
- Composite
- 42.56/100
- National rank
- #3195
- State rank
- #16 of 174 in GA
Livability — Guyton
- Score
- 69/100
- State rank
- #128
- US rank
- #9058
Category grades
Schools grade is shown separately in the Schools card above.
Census & demographics
- County
- Effingham County · 68,439 people
- City population
- 25,991
- Metro
- Savannah, GA
- Population (ZIP)
- 25,991
- Household income
- $101,750
- Rent vs Own
- Severe rent burden
- 97.0
Population outlook (Effingham County) Hauer SSP2
- Today (2025)
- 67,399 people
- By 2030
- 72,297 · +7.3%
- By 2040
- 81,602 · +21.1%
- By 2050
- 89,494 · +32.8%
- By 2075
- 105,976 · +57.2%
- By 2100
- 111,943 · +66.1%
Race, ethnicity, and origin ACS 2023
- Neighborhood character
- Predominantly White (75%)
- Race & ethnicity
- White 75% Black 11% Two or more races 9% Hispanic / Latino 7%
- Hispanic origin (detail)
- Mexican 3% Puerto Rican 2% Cuban 1%
- Common ancestry
- Slovak 2% Italian 2% Lithuanian 1%
- Foreign-born
- 3% · Canada
- Languages at home
- 96% English-only · Spanish 2%
Political lean MEDSL · Effingham
- 2024 margin
- Solid R (+49.1) · D 25.2% · R 74.3%
- 2008→2024 swing
- +1.6pp toward D · 2008: -50.7pp · 2024: -49.1pp
- All cycles
- 2024: R+49.1 2020: R+49.5 2016: R+55.6 2012: R+51.2 2008: R+50.7
Not yet ingested
- Civics
- —
Market trends
- HPI YoY
- ▼ -74.77%
- Current HPI
- 205.9899
- Rent YoY
- —
- Metro
- Savannah, GA
- State GDP YoY
- ▲ 2.66%
- F500 in state
- 28
Industry mix (Fortune 500 HQ in GA)
| Industry | F500 HQs | Revenue |
|---|---|---|
| Paper / Packaging | 2 | $29B |
|
||
| Retail | 1 | $160B |
|
||
| Transportation / Logistics | 1 | $91B |
|
||
| Airlines | 1 | $62B |
|
||
| Consumer Goods | 1 | $47B |
|
||
| Utilities | 1 | $25B |
|
||
Price history
+0.7% since first listed17 events — show timeline
- 2026-04-10 Price Changed $281,999 HABR
- 2026-04-03 Pending — HABR
- 2026-04-03 Price Changed $282,000 HABR
- 2026-04-02 Price Changed $279,983 HABR
- 2026-04-01 Price Changed $279,984 HABR
- 2026-03-31 Price Changed $279,985 HABR
- 2026-03-30 Price Changed $279,986 HABR
- 2026-03-26 Price Changed $279,988 HABR
- 2026-03-25 Price Changed $279,989 HABR
- 2026-03-24 Price Changed $279,990 HABR
- 2026-03-24 Price Changed $279,991 HABR
- 2026-03-21 Price Changed $279,992 HABR
- 2026-03-20 Price Changed $279,994 HABR
- 2026-03-19 Price Changed $279,996 HABR
- 2026-03-17 Price Changed $2,799,965 HABR
- 2026-03-17 Price Changed $279,996 HABR
- 2026-03-10 Listed $279,997 HABR
Cash-flow waterfall
monthlySold comps — $/sqft
last 12 mo · ≤1 miLoading sold comps…